Building a Simple Metrics Dashboard with the Signals REST API
Overview
In this guide we will walk through the process of building a simple metrics dashboard using the Signals REST API. The goal is to create a command-line interface (CLI) tool that provides insights into user status, license status, and creation activity. We will then explore what this could look like in a simple web interface. Each part of this guide will enhance the tool step by step, making it more useful and robust.
We will be using Python for this demonstration, leveraging its ability to handle API requests, data parsing, CLI-based interactions, and its ability to create a Flask server for hosting a proof-of-concept web interface.
By the end of this series, we will have a functional user reporting tool that can:
- Retrieve all users from the Signals API
- Categorize them based on login activity
- Provide insights into their licenses and roles
- Track license usage, showing total and remaining licenses per license type
- Provide insight into entity creation over the past 30 days
- Create a simple Web App user dashboard
Python Libraries Used
To build this tool, we will be using the following Python libraries:
- requests - for making API calls
- datetime - to manage and compare login timestamps
- tabulate - for displaying tabular data in the CLI
- flask - for hosting a simple web server for our Web App POC
APIs Used
We are working with the Signals REST API.
The API endpoints used throughout:
-
Users API: Retrieves all active users:
GET /usersThis provides details on your users.
-
Licenses API: Retrieves license usage information:
GET /users/licensesThis provides details on licenses availability and usage.
-
Search Terms API: Retrieves metrics for fields with terms based a provided query:
POST /entities/search/termsThis provides the ability to search fields for terms in Signals.
Assumptions
While this guide will walk you through using the Signals API it is important to understand key concepts about the format of our API responses. Specifically how to read and parse out required information.
To learn about this (and more!) check out: Revvity Signals Developer Guide - REST API
Disclaimer
This guide is intended as a demonstration of how to use the Signals API and be a helpful education tool. The code examples provided are meant as a proof of concept, focusing on simplicity to illustrate basic integration techniques. They are not intended to be production-quality nor a fully developed solution. This code lacks robust error handling, security, and may not be an optimized solution.
Part 1: Fetching and Categorizing Users
The first step in our reporting tool is to retrieve a list of all users and categorize them based on their last login activity. We define three categories:
- Users who have never logged in
- Users who haven't logged in for 30+ days
- Active users (logged in within 30 days)
Implementation
Fetching the users using Signals API
We first fetch our users to obtain their basic details. From the JSON response's data element, we capture data from each user's attributes to retrieve the user ID, first name, last name, email, last login, and licenses. We then examine the relationships object for their roles, with additional role details available in the responses included object.
import requests
import datetime
from tabulate import tabulate
# Base API URL
BASE_API_URL = "YOUR_TENANT_URL"
HEADERS = {
    "accept": "application/vnd.api+json",
    "x-api-key": "YOUR_API_KEY"
}
def fetch_all_users():
    """Fetches all users from the API, handling pagination automatically."""
    users_data = []
    included_roles = []
    PAGE_LIMIT = 100
    user_endpoint = f"{BASE_API_URL}users?enabled=true&page[offset]=0&page[limit]={PAGE_LIMIT}"
    while True:
        response = requests.get(user_endpoint, headers=HEADERS)
        if response.status_code != 200:
            print("Error fetching data:", response.status_code)
            return None
        data = response.json()
        users_data.extend(data.get("data", []))
        # Store role data separately to resolve user roles later
        if "included" in data:
            included_roles.extend(data["included"])  # Ensure we gather all roles
        # Check for pagination and continue fetching if needed
        next_link = data.get("links", {}).get("next")
        if not next_link:
            break  # No more pages to fetch
        user_endpoint = next_link
    return {"data": users_data, "included": included_roles}
Parsing the users data from our API Response
With our data fetched we parse out all of the information we will use for categorizing and displaying our users.
def parse_users(data):
    users = []
    role_mapping = {r["id"]: r["attributes"]["name"] for r in data.get("included", []) if r["type"] == "role"}
    now = datetime.datetime.utcnow()
    for user in data["data"]:
        attributes = user["attributes"]
        last_login = attributes.get("lastLoginAt")
        last_login_date = datetime.datetime.strptime(last_login, "%Y-%m-%dT%H:%M:%S.%fZ") if last_login else None
        days_since_login = (now - last_login_date).days if last_login_date else None
        roles = [role_mapping.get(role["id"], "Unknown") for role in user["relationships"].get("roles", {}).get("data", [])]
        licenses = [license["name"] for license in attributes.get("licenses", [])]
        users.append({
            "User ID": attributes.get("userId"),
            "First Name": attributes.get("firstName"),
            "Last Name": attributes.get("lastName"),
            "Email": attributes.get("email"),
            "Last Login": last_login_date.strftime("%Y-%m-%d") if last_login_date else "Never",
            "Days Since Login": days_since_login if last_login_date else "Never",
            "Licenses": ", ".join(licenses),
            "Roles": ", ".join(roles)
        })
    return users
Categorizing and displaying our User data
Next we simply organize our data we previously fetched and parsed from the API into the three categories we are interested in and prepare it for display.
def categorize_users(users):
    never_logged_in = [u for u in users if u["Last Login"] == "Never"]
    over_30_days = [u for u in users if isinstance(u["Days Since Login"], int) and u["Days Since Login"] > 30]
    active_users = [u for u in users if isinstance(u["Days Since Login"], int) and u["Days Since Login"] <= 30]
    return never_logged_in, over_30_days, active_users
def display_summary(never_logged_in, over_30_days, active_users):
    print("\nUser Summary Report:")
    print(f"Total Users: {len(never_logged_in) + len(over_30_days) + len(active_users)}")
    print(f"Users who never logged in: {len(never_logged_in)}")
    print(f"Users who haven't logged in for 30+ days: {len(over_30_days)}")
    print(f"Active users (logged in within 30 days): {len(active_users)}")
def display_users(users, category):
    print(f"\n{category} Users:")
    print(tabulate(users, headers="keys", tablefmt="pretty"))
Bringing it all together via CLI
Lastly, we bring everything together in our main() function to fetch users, categorize them, prepare our displayed data, and prompt the user for further action.
def main():
    data = fetch_all_users()
    if not data:
        return
    users = parse_users(data)
    never_logged_in, over_30_days, active_users = categorize_users(users)
    display_summary(never_logged_in, over_30_days, active_users)
    while True:
        choice = input("\nView user details for: (1) Never Logged In, (2) Inactive (30+ days), (3) Active, (q) Quit: ")
        if choice == "1":
            display_users(never_logged_in, "Never Logged In")
        elif choice == "2":
            display_users(over_30_days, "Inactive (30+ days)")
        elif choice == "3":
            display_users(active_users, "Active")
        elif choice.lower() == "q":
            break
        else:
            print("Invalid choice, please try again.")
if __name__ == "__main__":
    main()
Download
Running the Tool
Once you have saved the script, as metrics_app.py, you can run it using:
python metrics_app.py
Note that this was created and run on a Windows machine. Exact command line commands may vary based on your OS and python version.
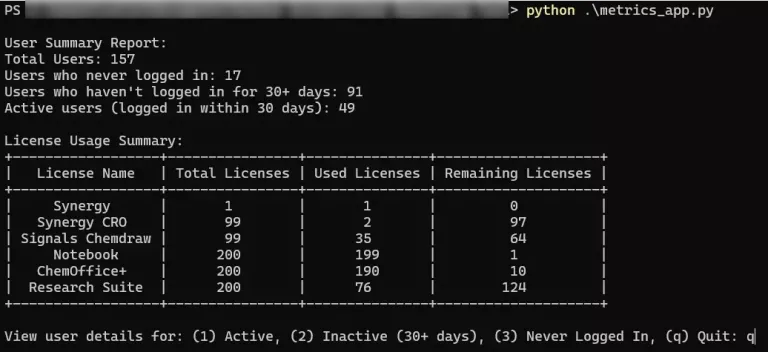
The script will fetch users, categorize them, display a summary via the CLI and allow options for displaying our three categories of users.

Part 2: Adding License Usage Information
Now that we have a working user report, we will enhance the script by adding license usage tracking. This step will:
- Fetch license usage details from the Licenses API.
- Display total, used, and remaining licenses per license type.
Implementation
Fetching and displaying our license information
To accomplish this we use the licenses API. From the JSON response's attributes object, contained in the data object we find all our license details. We then use the python library tabulate to prepare a very simple table to display the details.
def fetch_license_usage():
    response = requests.get(BASE_API_URL + "users/licenses", headers=HEADERS)
    if response.status_code != 200:
        print("Error fetching license data:", response.status_code)
        return None
    data = response.json()
    licenses = data.get("data", {}).get("attributes", {}).get("licenses", [])
    license_summary = []
    for license in licenses:
        total = license["totalLicense"]
        used = license["totalLicenseConsumed"]
        remaining = total - used
        license_summary.append({
            "License Name": license["name"],
            "Total Licenses": total,
            "Used Licenses": used,
            "Remaining Licenses": remaining
        })
    return license_summary
def display_license_summary(license_summary):
    print("\nLicense Usage Summary:")
    print(tabulate(license_summary, headers="keys", tablefmt="pretty"))
Updating main()
We now extend our main() function to include the licenses information we have prepared for display.
def main():
    """Main function to fetch and display user and license data."""
    data = fetch_all_users()
    if not data:
        return
    users = parse_users(data)
    never_logged_in, over_30_days, active_users = categorize_users(users)
    display_summary(never_logged_in, over_30_days, active_users)
    license_summary = fetch_license_usage()
    if license_summary:
        display_license_summary(license_summary)
    while True:
        choice = input("\nView user details for: (1) Never Logged In, (2) Inactive (30+ days), (3) Active, (q) Quit: ")
        if choice == "1":
            display_users(never_logged_in, "Never Logged In")
        elif choice == "2":
            display_users(over_30_days, "Inactive (30+ days)")
        elif choice == "3":
            display_users(active_users, "Active")
        elif choice.lower() == "q":
            break
        else:
            print("Invalid choice, please try again.")
if __name__ == "__main__":
    main()
Download
Running the Updated Tool
After saving the updated script, run:
python user_report.py
Note that this was created and run on a Windows machine. Exact command line commands may vary based on your OS and python version.
This version will fetch both user and license data, displaying an overview of available, used, and remaining licenses.

Part 3: Adding Entity Creation Details Over the Past 30 Days
In Part 2, we extended our reporting tool to categorize users based on login activity and track license usage. Now, we further enhance the tool by introducing an entity creation summary.
We add a new function, display_entity_summary, to monitor entity creation activity. This function queries a new endpoint (entities/search) to identify entities created in the past 30 days. It captures the following entity types:
- Experiments
- Samples
- Tasks
This additional data layer provides deeper insights into Signals usage by revealing the amount of entities being created.
The Signals search terms API requires a request body to build our search query. We will specify a list of entity types (experiment, sample, task) and define a date range from 30 days ago to the current time, while filtering out template items.
{
  "query": {
    "$and": [
      {
        "$in": {
          "field": "type",
          "values": [
            "experiment",
            "sample",
            "task"
          ]
        }
      },
      {
        "$range": {
          "field": "createdAt",
          "as": "date",
          "from": from_date,
          "to": to_date
        }
      },
      {
        "$match": {
          "field": "isTemplate",
          "value": False
        }
      }
    ]
  },
  "field": "type"
}
Implementation
Fetching our newly created entities and preparing for display
Our first step in displaying the entity creation summary is to use the search terms API with our crafted query. This searches a provided field for values it contains that meet a provided search query and provides metrics on usage. Our query sets our date range, the past 30 days, and provides a list of entity type values we are interested in, experiments, samples, and tasks. Then to prepare for display we again utilize the tabulate* python library to create a simple table UI to display.
def fetch_entity_creation_total():
    """Fetches number of entities were created for the entities we are interested in in the last 30 days from the tags search API."""

    # Get the current time in UTC
    now = datetime.datetime.now(datetime.timezone.utc)
    # Calculate the time 30 days ago
    thirty_days_ago = now - datetime.timedelta(days=30)

    # Format both dates to match the Signals expected date format
    from_date = thirty_days_ago.strftime("%Y-%m-%dT%H:%M:%S.000Z")
    to_date = now.strftime("%Y-%m-%dT%H:%M:%S.000Z")
    payload = {
        "query": {
            "$and": [
                {
                    "$in": {
                        "field": "type",
                          "values": [
                            "experiment",
                            "sample",
                            "task"
                          ]
                    }
                },
                {
                    "$range": {
                        "field": "createdAt",
                        "as": "date",
                        "from": from_date,
                        "to": to_date
                    }
                },
                {
                    "$match": {
                      "field": "isTemplate",
                      "value": False
                    }
                }
            ]
        },
        "field": "type"
    }
    response = requests.post(BASE_API_URL + "entities/search/terms?source=SN", headers=HEADERS, json=payload)

    if response.status_code != 200:
        print("Error fetching entity data:", response.status_code)
        return None

    data = response.json()
    return [{"Entity Type": entry["attributes"]["term"], "Total Created": entry["attributes"]["count"]} for entry in data["data"]]
Updating main()
We once again extend our main() function to include the entity creation summary we have prepared for display.
def main():
    users_data = fetch_all_users()
    if not users_data:
        return
    users = parse_users(users_data)
    never_logged_in, over_30_days, active_users = categorize_users(users)
    while True:
        display_summary(never_logged_in, over_30_days, active_users)
        license_summary = fetch_license_usage()
        entity_creation_summary = fetch_entity_creation_total()
        if license_summary and entity_creation_summary:
            display_license_summary(license_summary)
            display_entity_summary(entity_creation_summary)
        choice = input("\nView user details for: (1) Active, (2) Inactive (30+ days), (3) Never Logged In, (q) Quit: ")
        if choice == "1":
            display_users(active_users, "Active")
            input("Press Enter to return")
        elif choice == "2":
            display_users(over_30_days, "Inactive (30+ days)")
            input("Press Enter to return")
        elif choice == "3":
            display_users(never_logged_in, "Never Logged In")
            input("Press Enter to return")
        elif choice.lower() == "q":
            break
        else:
            print("Invalid choice, please try again.")
            continue
if __name__ == "__main__":
    main()
Download
Running the Updated Tool
After saving the updated script, run:
python user_report.py
Note that this was created and run on a Windows machine. Exact command line commands may vary based on your OS and python version.
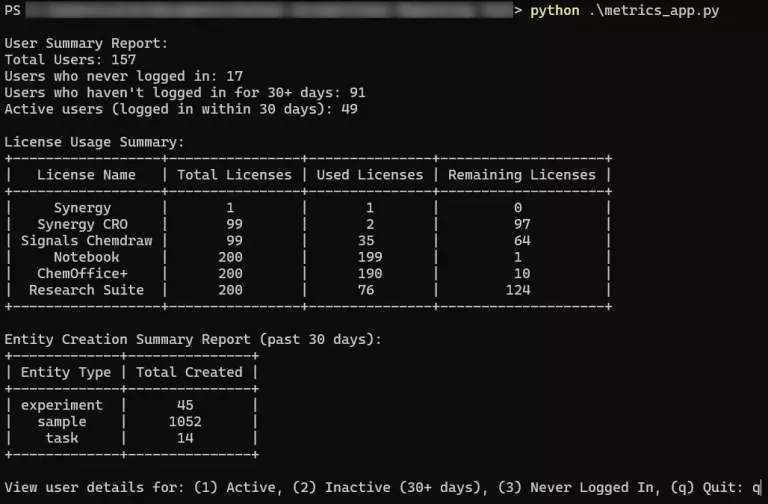
With these changes in place, running the application will now:
- Display a summary of user login activity along with license usage details.
- Allow detailed views of user lists based on their activity (never logged in, inactive, or active).

Part 4: Building the Web Application
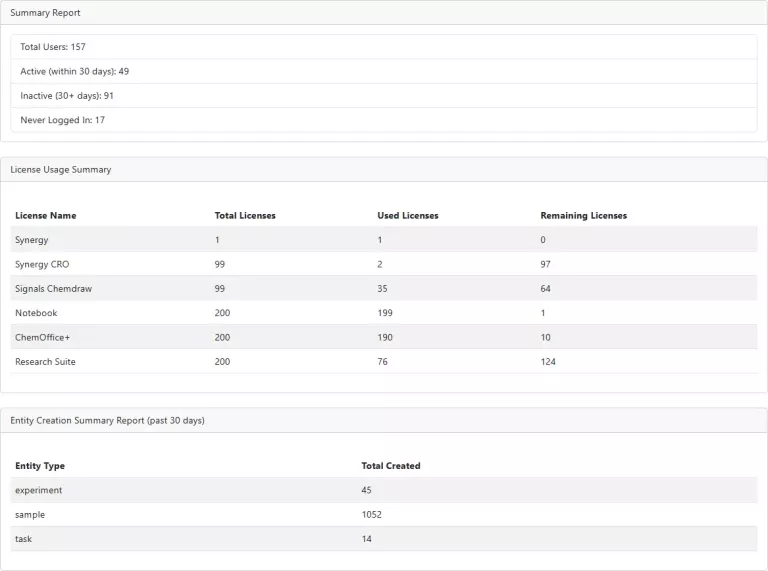
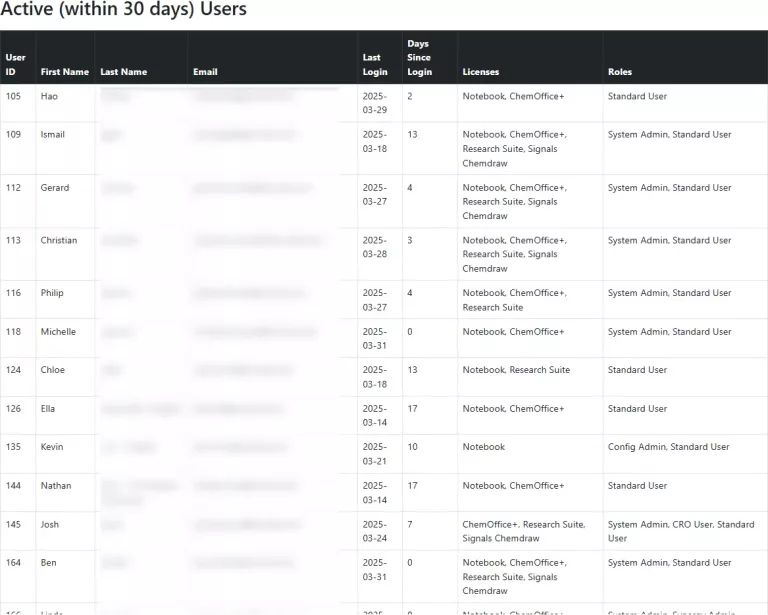
In our next part we transition from a command-line interface to a proof-of-concept web application using Flask. This version integrates all our previous functionality into a user interface on web. We will use a basic HTML page and styling to display our summary information and categories in tabular form.
Summary of changes and functionality for part 4:
- Web Application Framework:
- API Integration and Data Processing:
- Functions like
fetch_all_users,fetch_license_usage,fetch_creation_summary,parse_users, andcategorize_usershandle data retrieval and processing.
- Functions like
Notes
Since this piece is largely proof of concept and is simply reusing the same concepts from previous parts I will provide basic snippets to explain usage. You can download the full version, including the python code and HTML page at the end of this section.
Implementation Snippets
The Flask Server and headers
    from flask import Flask, render_template, jsonify
import requests
import datetime

app = Flask(__name__)
Rendering our HTML page and making our API requests
def get_data():
    """
    Fetches and processes all required data.
    """
    all_data = fetch_all_users()
    if not all_data:
        return None, None, None, None
    users = parse_users(all_data)
    never_logged_in, over_30_days, active_users = categorize_users(users)
    license_summary = fetch_license_usage()
    entity_creation_summary = fetch_entity_creation_total()
    return never_logged_in, over_30_days, active_users, license_summary, entity_creation_summary

"""This binds the below function to the default route of our Flask server"""
@app.route("/")
def index():
    """
    The main route that renders the dashboard.
    """
    never_logged_in, inactive, active, license_summary, entity_creation_summary = get_data()
    total_users = len(never_logged_in) + len(inactive) + len(active)
    summary = {
        "Total Users": total_users,
        "Active (within 30 days)": len(active),
        "Inactive (30+ days)": len(inactive),
        "Never Logged In": len(never_logged_in)
    }
    return render_template("webapp.html",
                           summary=summary,
                           license_summary=license_summary,
                           entity_creation_summary=entity_creation_summary,
                           never_logged_in=never_logged_in,
                           inactive=inactive,
                           active=active)

if __name__ == "__main__":
    app.run(debug=True)
Download
Downloadable Zip with webapp.py, and html template
Notes on Flask Usage
By default, Flask binds to 127.0.0.1 (localhost) on port 5000. To change this, you can specify a different host and port when running your application. For example, if your machine’s local network IP is, say, 192.168.1.100, you can restrict the app to that interface and change the port to 8000:
if __name__ == '__main__':
    app.run(host='192.168.1.100', port=8000)
Running the Web Application
- Setup:
- Place webapp.py in your project folder.
- Ensure you have a
templatesfolder containing the updated index.html. -
Install Flask (if not already installed):
pip install flask
- Running the App:
-
Run the application:
python webapp.py - Open your browser and navigate to http://localhost:5000 to view the dashboard.
-
Note that this was created and run on a Windows machine. Exact command line commands may vary based on your OS and python version.


Conclusion
With Part 4, our user metrics dashboard has evolved into an interactive web application. Administrators can view user activity, license usage, and entity creation metrics all through an simple web interface.