Find out how we're leveraging AI to empower you to accelerate your science
Spotfire® Visual Analytics
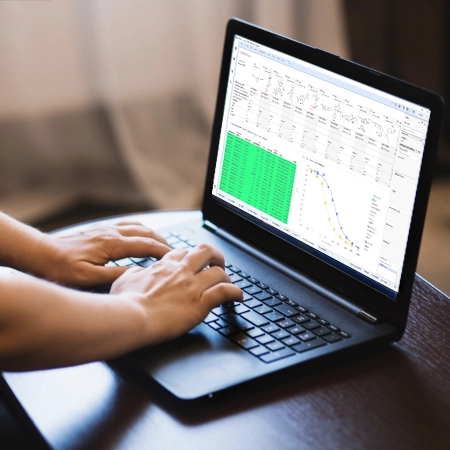
Revvity Signals is the only source of Spotfire for scientific R&D and clinical development. The enterprise-class visual and discovery platform empowers teams or organizations to mine scientific data and gain insights to drive data-driven decisions

Spotfire for Science
Lead Discovery Premium
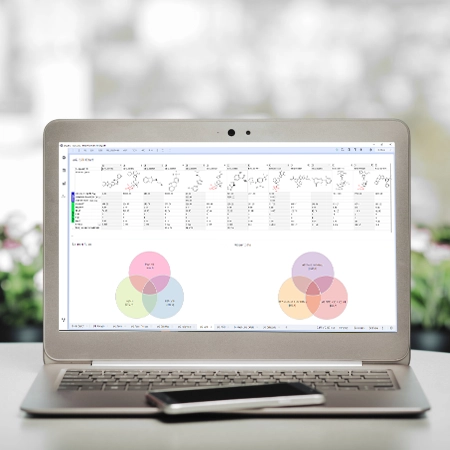
Incisive Chemical and Biological Analytics: Analyze & visualize chemical structures, bio sequence data compare, score & segment leads based on data

Spotfire Lead Discovery Premium Biotech Bundle on the AWS Cloud
Essential tools for developing both small molecule and biologics-based therapies for any company, any size
Spotfire Powered Clinical Solutions
Reduces the time spent preparing data for analytics to enable the rapid delivery of clinical insights

NEXUS Keynotes
Explore recent developments in Spotfire, NLP and LLM, and how Spotfire’s visual data science experience is changing the game.
Related Events & Webinars
What is Revvity Signals Spotfire?
Revvity Signals Software is a Global Strategic Partner for Spotfire since 2012, the leading analytics platform in the scientific community. With exclusive rights to sell and support Spotfire in the Life Sciences market, Revvity Signals Software has a long experience and depth in addressing the complex analytics challenges of research professionals.
How does Spotfire support data visualization?
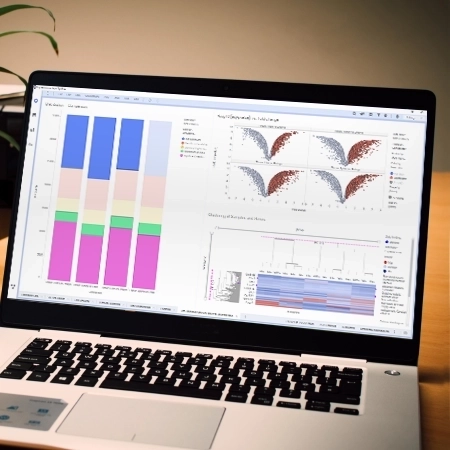
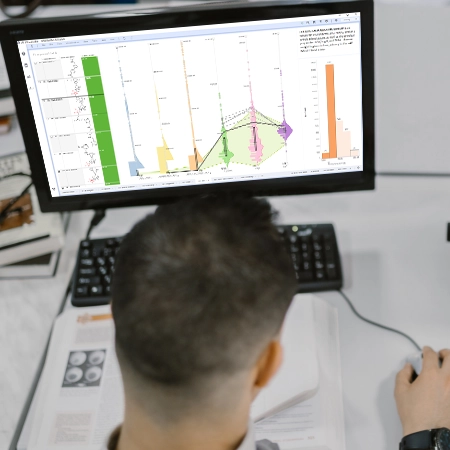
Spotfire offers interactive dashboards and visualizations that allow users to explore data in real-time, making it easier to identify trends and insights.
Adding a visualization to an analysis can be handled in three ways:
1. Starting from the data: By selecting data columns you are interested in among the loaded data, you will get recommendations on visualizations based on the particular columns. Then, the visualization of interest can simply be dragged to the analysis page, and if needed, you can fine-tune it there.
2. Start from a visualization type: You can simply select the visualization type you want to use and drag it to the analysis page in Spotfire. Once on the page, you can select which data columns you want to visualize, and how.
3. Search for what you want to visualize: You can search for data you are interested in among existing content and also get recommendations on new visualizations that can be relevant. The visualizations can then be dragged to the analysis page.
Can Spotfire handle large datasets?
Yes, Spotfire is built to process and analyze big data, making it suitable for enterprise-level deployments.
What industries can benefit from using Spotfire?
Spotfire is particularly beneficial for industries such as Drug Discovery, Clinical Trial Analytics, Chemicals & Materials R&D, Food, Flavor & Fragrance, among others.
Can you provide use cases of Spotfire in Drug Discovery?
Here are a few examples of how Spotfire can be utilized across various domains. Please note that these are just a sampling of the many applications available:
1. Hit Screening and Lead Identification: Spotfire can analyze large datasets from high-throughput screening to identify potential drug candidates. Its visualization tools help researchers quickly spot promising hits based on biological activity and other metrics.
2. Lead Optimization / Structure-Activity Relationship (SAR) Analysis: Spotfire facilitates SAR analysis by allowing scientists to visualize and correlate chemical structures with their biological activities. This helps in refining lead compounds for better efficacy and safety.
3. Dashboards for Monitoring Project Status: Spotfire's interactive dashboards provide real-time insights into project progress, enabling teams to track milestones, resource allocation, and timelines effectively.
Can you provide use cases of Spotfire in Chemicals & Materials / Food, Flavor & Fragrances?
Here are a few examples of how Spotfire can be utilized across various domains. Please note that these are just a sampling of the many applications available:
1. Design, Develop, or Modify Formulations: Spotfire supports formulation scientists by visualizing data related to ingredient interactions and performance, aiding in the design of effective products.
2. Counterfeit Detection & Competitive Analysis: By analyzing market data and product compositions, Spotfire can help identify counterfeit products and assess competitive positioning, enhancing strategic decision-making.
3. Food, Flavor & Fragrance Adulteration: Spotfire can analyze ingredient data to detect adulteration in food and fragrance products, ensuring quality control and compliance with safety standards.
Can you provide a use cases of Spotfire in Clinical Trials Analytics?
Here are a few examples of how Spotfire can be utilized across various domains. Please note that these are just a sampling of the many applications available:
1. Clinical Data Review: Spotfire enables comprehensive analysis of clinical trial data, allowing for efficient review of patient outcomes and treatment effects.
2. Medical Review: The platform supports medical reviewers by providing tools to visualize and interpret complex clinical data, facilitating informed decision-making.
3. Risk-Based Monitoring: Spotfire's analytics capabilities allow for the identification of potential risks in clinical trials, enabling proactive management and mitigation strategies.
4. Pharmacovigilance & Drug Safety: Spotfire can analyze adverse event data and other safety information, helping organizations monitor drug safety and comply with regulatory requirements.
Is there a trial version available for Spotfire?
Yes, users can request a free trial to explore Spotfire’s features and capabilities before making a purchase here.
What types of analytics can I perform with Spotfire?
Spotfire supports various analytics, including predictive analytics, statistical analysis, and real-time data exploration.
How can I collaborate with my team using Spotfire?
Spotfire promotes collaboration through shared interactive dashboards, reports, annotations, conversations, and the ability to export insights in various formats (including JPG, PNG, PDF, text files, and PowerPoint).
Does Spotfire integrate with other tools?
Yes, Spotfire integrates seamlessly with other scientific tools and platforms, enhancing its functionality and user experience.
Spotfire includes a comprehensive set of APIs to support a variety of use cases and extend Spotfire capabilities.
What support resources are available for Spotfire users?
Revvity Signals Software provides extensive support resources, including documentation, training, and professional services to assist users.
How can I get started with Spotfire?
1. Clinical Data Review: Spotfire enables comprehensive analysis of clinical trial data, allowing for efficient review of patient outcomes and treatment effects.
2. Medical Review: The platform supports medical reviewers by providing tools to visualize and interpret complex clinical data, facilitating informed decision-making.
3. Risk-Based Monitoring: Spotfire's analytics capabilities allow for the identification of potential risks in clinical trials, enabling proactive management and mitigation strategies.
4. Pharmacovigilance & Drug Safety: Spotfire can analyze adverse event data and other safety information, helping organizations monitor drug safety and comply with regulatory requirements.
Resources
Unlock the power of Spotfire®️. Beyond its standalone abilities, Spotfire drives advanced analytics and visualization across the Signals platform. Explore these additional resources to discover other remarkable solutions harnessing the potential of Spotfire.
