Signals™ VitroVivo - What's new
Signals VitroVivo is an intuitive, configurable, and flexible workflow processing engine and data management system that includes the unparalleled data visualization and analysis capabilities of Spotfire® .
Check out the latest improvements.
What's New
Revvity Signals is delighted to announce the release of Signals VitroVivo 3.3.
Signals VitroVivo 3.3 is focused on the integration with Signals Notebook and broad improvements across scientific domains:
- In Vitro:
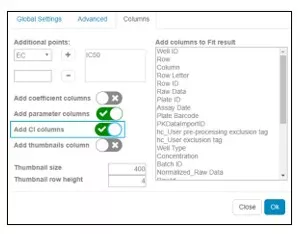
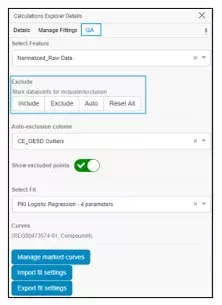
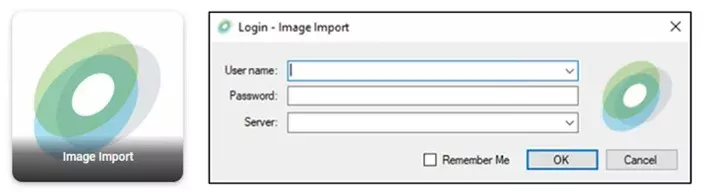
- The functionality of the following Apps has been improved: Data Import, Image Import, Grid Plate Editor, and the Calculations Explorer, with a broad range of enhancements including support for color schemes, subsets, filter rows, exclude columns, curve label settings and free layouts.
- The security of the connectivity with Signals Image Artist and with the metastore has been enhanced (https)
- In workflows, the user is allowed to move forward with a warning even if the previous App has not been executed, as this allows for certain use cases that are not supported when enforcing the previous App execution.
- SPR:
- Support for file loading from Signals Notebook experiments, metadata from properties, and for multiple files when using T200, Biacore or Carterra formats.
- In Vivo:
- Only the “PK Parameter” App remains in the OnPrem version of Signals VitroVivo, while all the other InVivo Apps are now available in the SaaS version of Signals VitroVivo only.
- General:
- Compatible with Spotfire® 11.4LTS and 12LTS.
- Ten deprecated Apps removed, in accordance with the retention policy for deprecated Apps introduced in the previous version.
Signals VitroVivo is available through the Download Center. If you do not have access to the Download Center, contact Support to assist you with sign-up. Please contact your Account Manager if you are interested in licensing Signals VitroVivo.
What’s New
Signals VitroVivo 3.2 is focused on the integration with Signals Notebook and broad improvements across scientific domains:
In Vitro:
The functionality of the following Apps has been improved: Data Import, including SciStream, Grid Plate Editor, Editable Data Grid, Extensible Normalizations and the Calculations Explorer, with a broad range of enhancements. Importantly, the Apps can now natively consume and write back data from/to Signals Notebook. Finally, WebHelp support is now available for all the Apps.
SPR:
The SPR Data Import and QA/QC Apps have been improved and an Out-of-the-Box workflow is now provided with example data and a how-to guide for a quicker onboarding experience.
In Vivo:
Of particular importance for large studies, for the first time the Signals Notebook integration enables concurrent editing. In addition, data capture improvements in the Vivarium make the process more efficient and painless. Finally, the PK Parameters App has been further refined and improved.
General:
Compatible with Spotfire® 10.10LTS, 11.4LTS and now 12LTS.
A retention policy for deprecated Apps has been introduced.
Signals Notebook integration is more secure and the state of an Apps’ connection to the Signals Notebook is now readily visible on the App (the user can easily re-establish a connection if it is lost).
Further Details
Changes in Behavior in Signals VitroVivo 3.2
General
- Name of the initial table created by the Apps is no longer “Data table”, as this was misleading
- All R packages are now installed by the dependency manager. Users should run the dependency manager to ensure all R packages are installed or updated correctly
Calculations Explorer
- When using a column parameter, it is now unambiguously shown as fixed
In Vivo
- Connection with Signals Notebook required for the Study Designer, Baseline Capture and Sequence of Events Apps.
Deprecations of Apps
To avoid confusion and errors due to the use of unsupported Apps, starting in the next Signals VitroVivo version all deprecated Apps will be removed one version after their deprecation. This means any .dxp that contains deprecated Apps will need to be updated to the new version of the App(s) or regenerated without the deprecated App(s) if it will be opened in newer versions of Signals VitroVivo
What’s New
Release 3.1 introduces Signals Pipelines, automatically analyze datasets by running Signals VitroVivo workflows within the Signals Data Factory. Signals Pipelines increases the scale of datasets easily handled by Signals VitroVivo while the increased automation saves time.
In Vitro Apps
- Tighter Signals Research Suite integration by using Signals Notebook authentication for Signals VitroVivo.
- Additional controls for layout and content of reports.
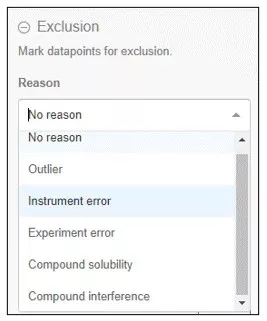
- Curve fitting improvements including easier access to QA tools as well as the ability to document the reason for point exclusion.
- New SPR QA/QC App allows report points creation for any instrument as well as user defined thresholds to automatically exclude curves.
In Vivo Apps
- Improvements to the data integrity checking across Apps.
- Study Templates can now be cloned.
- PK Parameters App calculation improvements.
Signals Inventa Release 3.1 Highlights
- Reminder: Signals VitroVivo includes Signals Inventa and all its capabilities.
- Integrate in vivo pharmacokinetic and in vitro efficacy data to calculate inhibition over time with the new Target Engagement Profile App. Identify the best drug candidates faster with the unique solution only available in Signals Inventa.
- SmartCells allows custom aggregations and displays within the SAR Analysis App.
- Configurable asset names allow custom terminology for more intuitive data handling.
Signals Pipelines
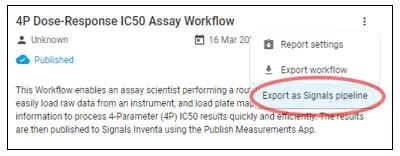
Workflows can be exported as Signals Pipelines allowing large datasets to be analyzed automatically by user defined analysis methods. Signals Pipelines extends the scope of Signals VitroVivo by allowing analysis without the standard user interface. Large datasets (many files, large files, or both) can now be easily handled. This capability is available without losing the flexibility to easily adjust analysis methods by simply modifying the existing workflow and reexporting the now revised Signals Pipeline.
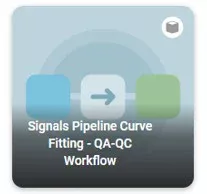
New out-of-the-box dataset review workflow imports data analyzed by Signals Pipeline, allows for quality checks, and publishes the revised results.
Reports
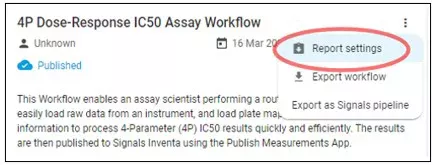
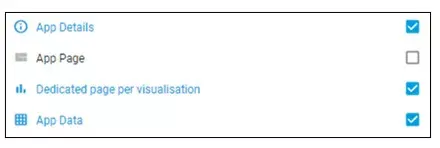
Workflow reports allow further customization including finer control of content and layout such as dedicating a page to each visualization.
Quick Start Guides
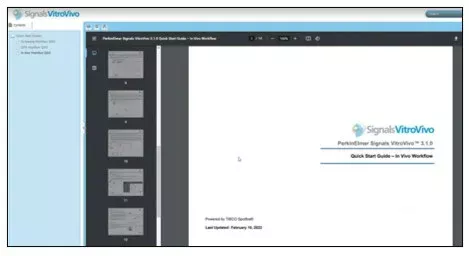
Easier access to documentation from help link in App store.
Curve Fitting Improvements
See list below for more information, but here are two with additional details:
-Excluded datapoints now include annotations documenting who excluded them, when they were excluded, and why they were excluded. Customizable list of exclusion reasons ensures consistency while maintaining flexibility.
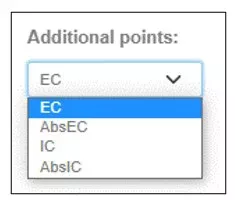
-More options for IC50 definitions including absolute IC50.
Calculation Explorer
- No need to press apply, calculation explorer templates now run automatically within workflows saving mouse clicks and time
- QA interface opens automatically after curve fitting directing users to the next step
- Template creator name saved within template for better tracking
- Support for “Calculate and Replace Column” transformations
- Support for “Change Data Types” transformations
- Auto excluded datapoints include reason for exclusion
- Revised user interface with easier to understand buttons and settings
Surface Plasmon Resonance (SPR)
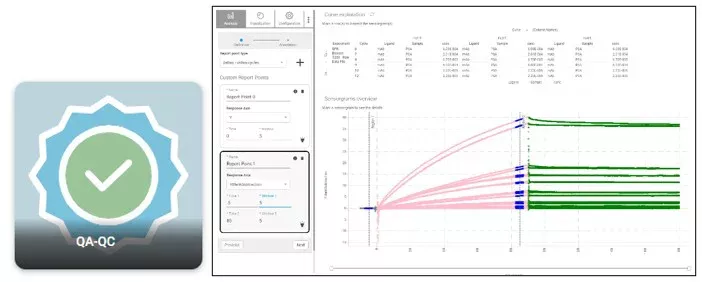
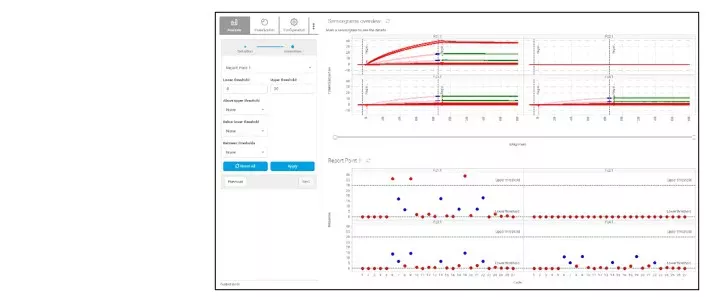
New SPR QA/QC App allows custom report point creation for all supported SPR instruments. Report points can then be used to automatically exclude curves based on user defined thresholds.
Signals Inventa
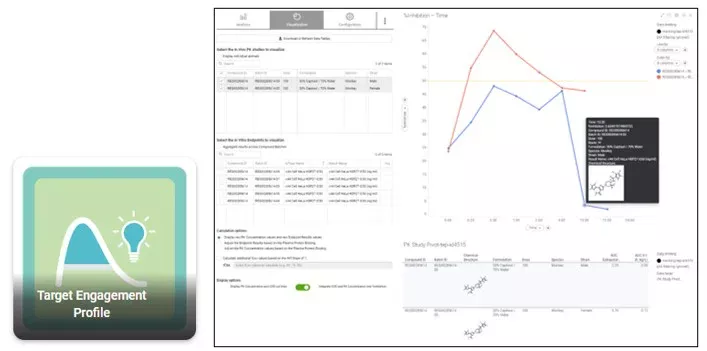
New Target Engagement Profile App integrates in vivo pharmacokinetic and in vitro efficacy data to calculate inhibition over time. What previously took months now takes minutes with the unique solution only available in Signals Inventa.
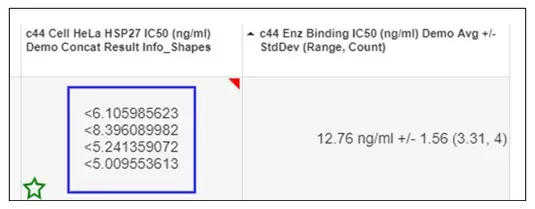
SmartCell editor expands the information within the SAR Analysis App by allowing custom aggregations and displays. Preset templates are included for configuring standard deviation, range, count, and qualifiers.
Configurable entity names allow meaningful nomenclature for any application. One name pair per Inventa instance such as Compound/Batch, Antibody/Lot, or Formulation/Container.
-Out-of-the-box measurement types are now included for the most common customer assays (4-Parameter Dose-Response).
-New App icons for a more consistent look and feel across Signals VitroVivo.
Didn't find what you're looking for?
Check out older patch notes: (2021: 3.0-2.6) - (2020: 2.5.1 - 2.4.1)
What’s New
Release 3.0 introduces a new name for the solution formerly known as Signals Screening: Signals VitroVivo. The new name highlights the breadth of the solutions provided from self-service flexible data analysis to scalable data management for in vitro and in vivo data. Signals VitroVivo does so much more than screening.
Not just a name change, this release brings Spotfire 11.4.0 LTS support along with all these new features:
In Vitro Apps
- Improved introduction to Signals VitroVivo with ready-to-run workflows. Get comfortable with four built-in workflows using provided data sets, then easily modify or build your own workflow to analyze your data your way.
- Over 70 built-in PRISM-like equations that can be deployed using Calculations Explorer Templates.
- Over 40 requested feature enhancements throughout all the core Apps.
- Signals Image Artist, the recently released next generation cell image analysis and management platform, is fully integrated with Signals VitroVivo.
- New SPR Data Import App brings a simpler consistent user interface and a streamlined backend data model allowing the user to edit and annotate the imported data using the existing Editable Data Grid App
- Custom attribution of Entities and Events.
- Study Templates now supported.
- Many updates throughout all the In Vivo Apps.
Signals Inventa Release 3.0 Highlights
- Reminder: Signals VitroVivo includes Signals Inventa (formerly Signals Lead Discovery) and all its capabilities.
- Dynamic pivot of the Assay Endpoint Result into the SAR table by any Spotfire-like expression enables simpler assay hierarchies and more flexible definition of the SAR Table.
- ChemCharts 3.0 is a complete overhaul of this core component. Includes improved performance, new visualizations, and many UI improvements.
- Replaceable datasets allow data updates to be almost instantaneous.
Out-of-the-box workflows
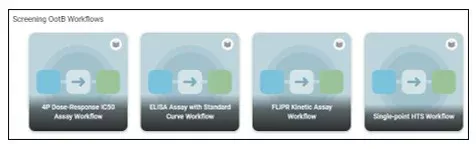
Prebuilt workflows are now included for four standard assays. These workflows introduce Signals VitroVivo allowing easier adoption and faster implementation.
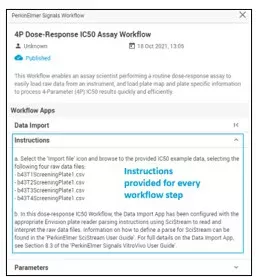
-Users initiate the workflow and follow instructions to analyze provided data
-These workflows can then be cloned and modified as desired for user specific use case. These can also be used as a basis for a new workflow the user can easily create using any of the Apps.
-Users can now add instructions to their own workflows as well.
Over 70 Built-In Equations
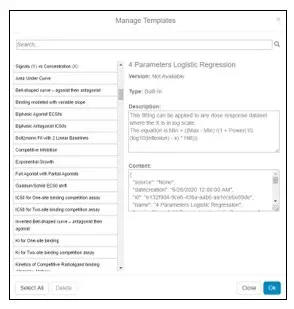
Huge increase to the built-in curve fit options with the goal: If you can fit it in PRISM, you can fit it in Signals VitroVivo. Users can still add their own custom equations, but most likely you will find the desired equation in the provided list.
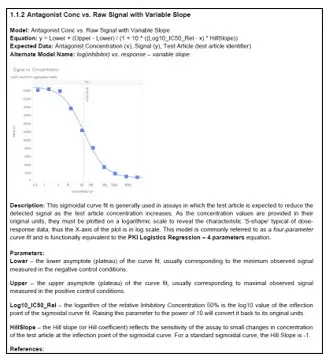
Complete documentation of all equations with associated references allow users to easily dig deeper into each equation and its function.
Over 40 improvements to the core screening apps
See list below for more information, but here are two with additional details:
-Confidence intervals can now be added to results in calculation Explorer App.
-Quality Assurance tab is now available for all calculation explorer templates and will persist while marking curves so that users can easily select and exclude or refit data.
- Calculation Explorer Templates
- Added additional built-in
- Support for table visualization and sort order
- Support for error bars
- Support for visualizations using the fitting curve table
- Support for calculations using the fitting curve table
- Support for tooltips in scatterplots and bar charts
- Support for “Add data from table”
- Support for “Curve from table” using the main table
- Improved support for complex calculation sequences
- Properties and calculated columns can be kept when deleting the template
- Nomenclature is more consistent
- Calculation Explorer Curve Fitting
- Thumbnail font can be configured
- Table can be used in template calculations
- Table can be used in template visualizations
- Parameter estimation has improved
- Parameters can be saved to file
- Parameters can be set from saved file
- ECx labels can be set to scientific notation
- IRLS tags are more informative
- IRLS cut-off can be specified for datapoint shape definition
Signals Image Artist Support
Support for Revvity Signals next generation cell image analysis and management platform, Signals Image Artist, while maintaining support for Columbus.
In Vivo
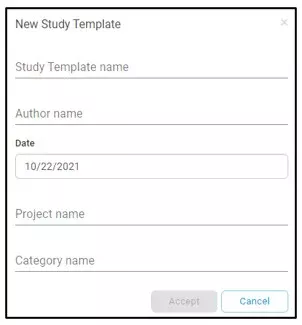
Study Templates now supported allowing each template to be configured for the specific experiment type.
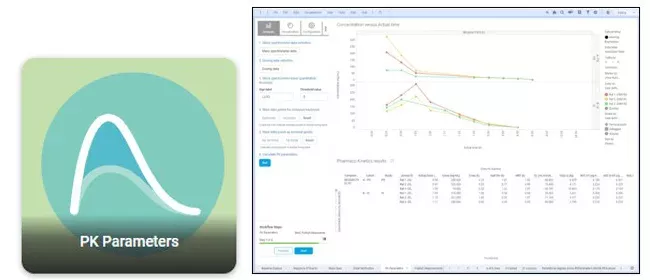
PK Parameters App features have expanded significantly.
Surface Plasmon Resonance (SPR)
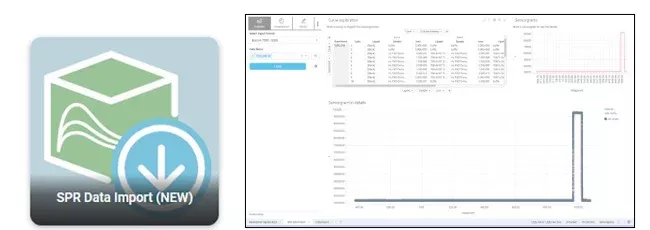
SPR Data Import App (NEW) brings a consistent user interface to align with the Screening Data Import App for ease of use. Data tables imported are reduced for simplicity and to allow new features moving forward.
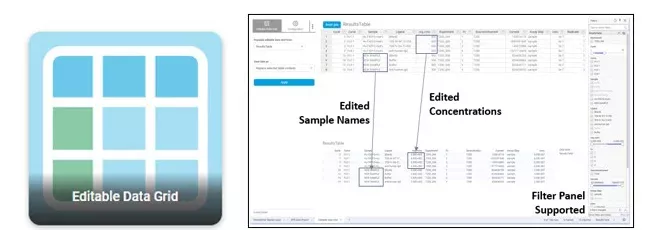
One new feature enabled by the above SPR Data Import App (NEW) is the ability to edit and annotate the imported data. This is accomplished by using the existing Editable Data Grid App. This App allows the user to easily correct a concentration or enrich the data set by adding virtually any metadata to the analysis. The changes are applied to the Results Table and pushed to all necessary tables for downstream analysis.
What’s New
Signals Screening 2.7 introduces In Vivo Apps, bringing support to a whole new wing of science: Pharmacokinetic experiments. The release also brings Signals Notebook integration, Calculation Explorer and Workflow improvements, as well as additional SPR instrument compatibility. With its many new features, we think you will find Release 2.7 a robust replacement for IDBS ActivityBase.
In Vivo Apps for Pharmacokinetics
- First full release of Apps focused on the process of running Pharmacokinetics (PK). These experiments are used to evaluate how much drug is in the blood stream of a treated organism.
- Nine new Apps organize all the steps of a complicated In Vivo workflow: study definition, treatment planning, drug dose calculation, animal measurement, blood sampling, dose verification, final PK calculations, and QA/QC.
- Includes a novel Sequence of Events view of an in vivo study that is a game-changer for how in vivo scientist can capture their data.
Signals Notebook Integration
- Notebook properties are now included when opening a Signal Screening file from Signals Notebook allowing the context of the analysis to persist. These properties can be combined with the analysis and found easily later for traceability.
- Tables defined by an administrator in Signals Notebook are now automatically available in Signals Screening when opening the file from the notebook. This allows easy transfer of data from notebook to analysis with no unnecessary copy and paste steps.
Calculation Explorer Visualization Layout Preserved
- The chosen visual representation of your analysis is often critical to understanding your results. Arrange data the way you like and when you apply your calculation explorer template to the next data set you are presented with the results your way
Workflows Improvements
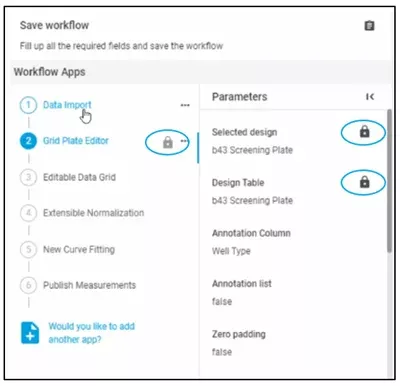
- Ensure proper analysis by locking parameters as desired.
- Customize reports by configuring what items to include.
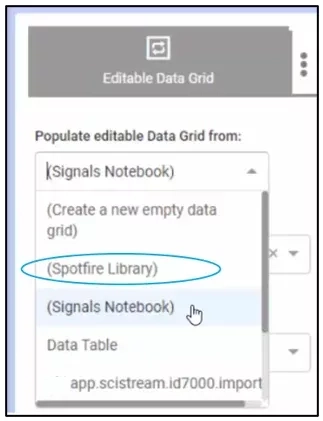
- Access frequently used information easily from the Spotfire Library. Easily load saved tables to quickly integrate the information into your analysis.
Surface Plasmon Resonance (SPR)
- Biacore 8K and Carterra LSA – SPR Data Import App expanded to include these two cutting edge instruments.
- Dissociation only model – Additional kinetic model beyond standard 1:1 interaction with mass transport allows fitting just the dissociation component of the molecular interaction.
Quick Start Guides
-Release documentation now includes introductory guides for Screening, SPR, and the new In Vivo Apps.
-Introduction to workflows allowing easier adoption and faster implementation.
Signals Notebook Integration
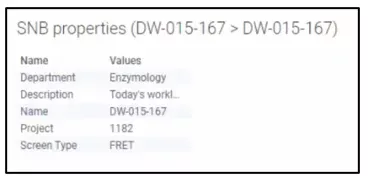
Notebook administrator defined properties are automatically brought in as a table when a Signal Screening file is opened from Signals Notebook and data is imported. These properties can then be combined with the analysis.
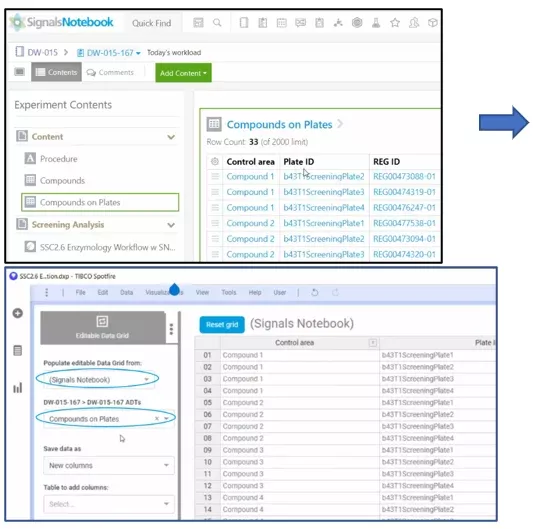
Signals Notebook administrator defined tables are now directly accessible in the Editable Data Grid App within Signals Screening when the file is opened from Signals Notebook.
Calculation Explorer
Visualization Improvements
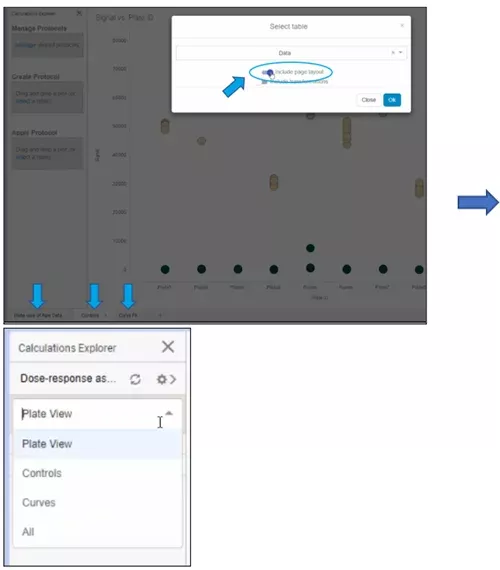
Page Layout – Each page of your calculation explorer template is now preserved and can be viewed individually.
-The order of detail visualization on each page are better preserved to maintain the analysis layout as built.
-Y-axis single scale setting maintained.
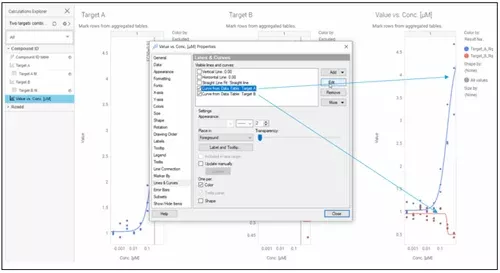
-Custom “Curve from Data Table” are saved in template allowing multiple curve fits that are brought together to be visualized together.
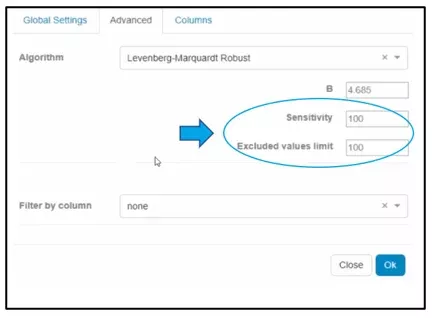
-Iteratively Reweighted Least Squares (IRLS)
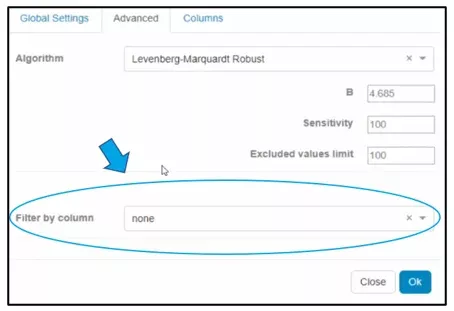
-Adjustable sensitivity and limits on the number of excluded points.
-Curve fit parameters now have same number formatting as the corresponding axes.
-Limit set of curves to fit via Boolean column
Infrastructure
-Metastores restart automatically when the hosting server reboots to ensure connectivity.
-SPK file containing the R libraries can now be uploaded into Spotfire library ensuring app dependencies are met. Previously this was ensured on a per client basis.
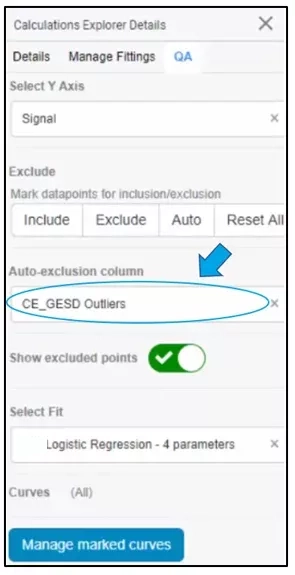
Auto-exclusion column can now be included in calculation explorer template and applied automatically
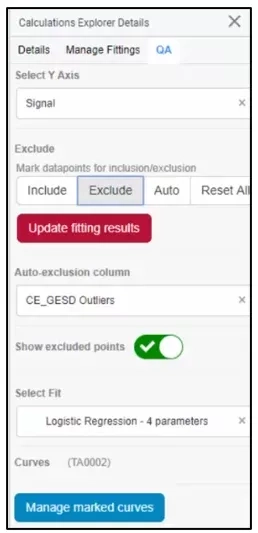
New alert whenever a change has occurred requiring recalculation of cascading data tables. Allows the review and exclusion of points without the recalculation of all fits slowing the process. Then when complete, all the curves are refit by updating the fitting results.
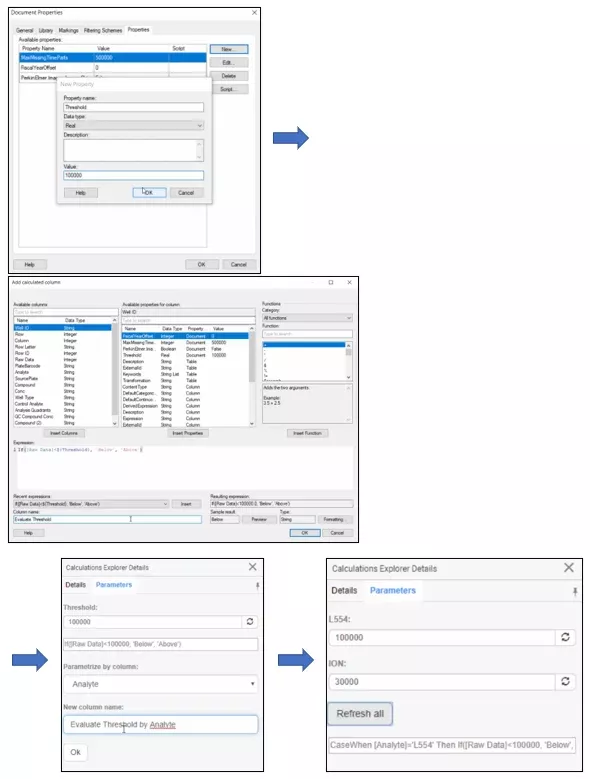
Multi-analyte (multi-parameter)
Method for use: Calculate a column based on a document property. Then create a Calculation Explorer and use the new option to parameterize by this column. A new column is created using the new parameters. The example below uses multiple analytes as the parameters. Run the calculation explorer on a new data set and this analysis step is completed automatically based on the new data in your selected column.
Workflow
-Faster exclusion of data and fitting.
-Globally Unique IDentifiers (GUID) added for each curve to help with publication of data as well as traceability.
-Individual parameters of Apps can now be locked so that they are not editable when executing the workflow.
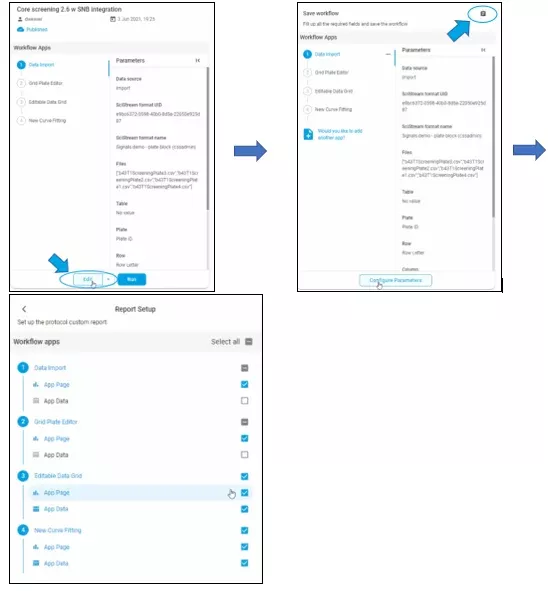
The report setup can be edited to include/exclude which components to include in the report.
-Table automatically selected in calculation explorer template when run within a workflow.
-An empty template table can be loaded in the Editable Data Grid App to be filled in manually.
-Reference tables from Spotfire Library are now accessible in the Editable Data Grid App
Surface Plasmon Resonance (SPR)
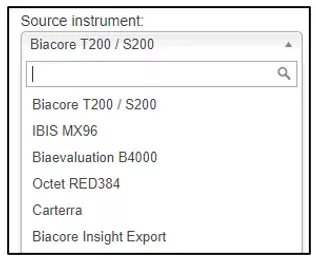
Data Import App now supports Cytiva Biacore 8K and Carterra LSA instruments. The Biacore file (JSON) is exported from the Biacore Insight software. The Carterra LSA file (SPRData) is supported directly from the instrument.
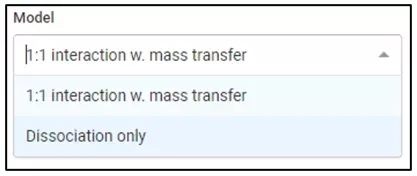
Multi-Cycle Kinetics App now supports dissociation only kinetic model. Allows for fitting just the dissociation component of the molecular interaction. This model can be applied to the entire data set or just a subset of your data mixed with other fitting models if desired.
New Relative Potency App extends the functionality of the previous Parallel Line Analysis App while simplifying the analysis. It is now possible to go directly from Data Import to the new App using imported report points. Additionally, any dose response data can be analyzed as opposed to just SPR data. Finally, an editable data grid is incorporated to allow easier entry of comparison samples within the App as opposed to uploading a file.
Signals Screening 2.6 continues our rapid progress on many fronts to support scientists doing testing work throughout all stages of life science product R&D, from early-stage assay development all the way through late stage testing in vivo. This release is a feature rich release adding a new main Apps page, our first support for In Vivo workflows, and for addressing specific targeted bug fixes and feature enhancements.
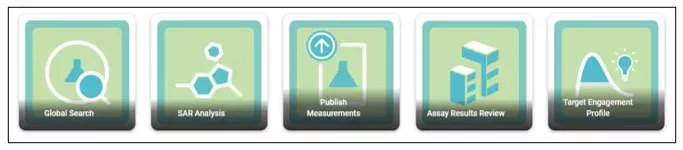
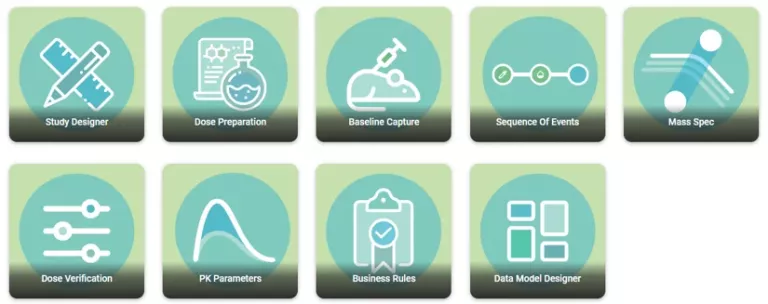
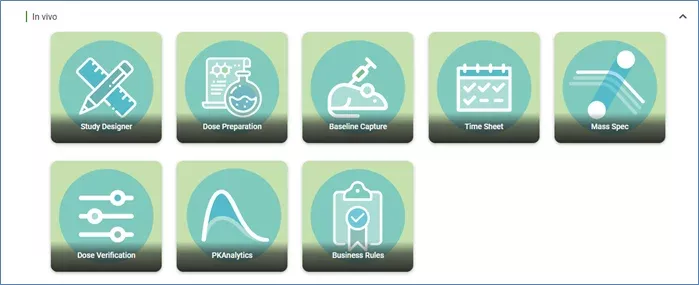
New Signals App main page. Signals Screening’s new App page is a beautiful, slick, intuitive, user interface that is easy to navigate, allows users to bookmark favorites workflows and apps, and consistent in its iconography. Also, the user’s experiences of Workflow creation and management have been improved greatly. Important detail: we have re-labeled Signals Screening “Protocols” to “Workflows”.
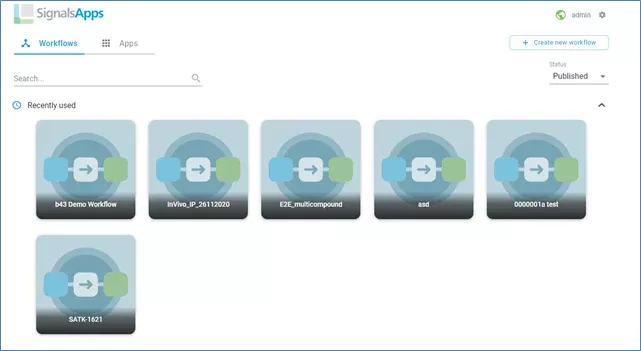
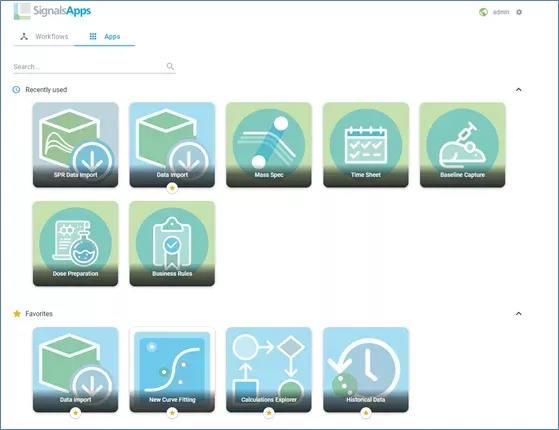
Fig 2: New Signals App main page with intuitive user interface that is easy to navigate, easy to bookmark favorite workflows and apps.
In Vivo Apps for Pharmacokinetics. We have added a new wing to the science our product supports – In Vivo experiments. This first release of In Vivo Apps is focused on the process of running Pharmacokinetic (PK) experiments. The 8 new Apps in this domain help organize all the steps of a complicated In Vivo workflow: Study Definition, treatment planning, drug dose calculation, animal measurement, blood sampling, dose verification and final PK calculations and QA/QC. Contact your Revvity Signals account manager to get access to beta version of the in vivo apps, see our roadmap or discuss your in vivo workflows and potential collaboration with Revvity Signals.
Curve Fitting and Calculations Explorer improvements. Signals Screening 2.6 adds several improvements to curve fitting and Calculations Explorer including:
- Page Views – now you can configure a Calculations Explorer template with exactly the configuration of visualization that you want to see on a page and have multiple predefined pages to show different perspectives on the results.
- Calculate Columns Transformations and Freeze Column actions can now be captured in a Calculations Explorer template.
- Additional GESD calculation options are supported.
- The curve fit feature is now selectable for toggling between different parameters in a multi-parametric data set on the fly.
Also included in this release are many additional smaller bug fixes, feature enhancements, and incremental improvements.
As a reminder, Signals Screening enables biologists to perform all the foundational steps of screening:
- Load data from instruments. Signals Screening brings the power of the SciStream instrument file parser to the screening scientist and ties it more directly into the data processing workflow.
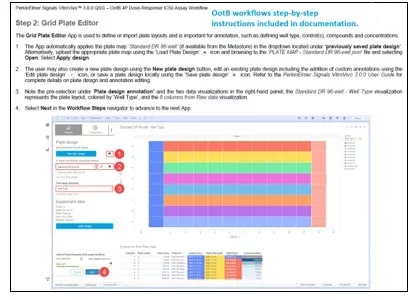
- Develop and reuse plate maps. A key part of the screening process is the definition of the layout of the test articles on a plate. The Grid Plate Editor overhauled this part of the screener’s process and creates a significantly improved process for individual plate design and library management.
- Normalize the data with standard or customer-defined methods. We provide out-of-the-box the most standard normalization methods and customers can easily define their own normalization equations in an intuitive interface.
- Define and review Curve Fits. Any measurement from the plate and be selected for input into a parameterized and customizable curve fit engine, and the resulting curves can be reviewed and adjusted by knocking out aberrant points.
- Publish the results to Signals Lead Discovery. As a final step, a processed dataset can be published to Signals Lead Discovery to use by the lead discovery scientist in deciding which candidates to advance.
- Workflow authoring and reuse. The whole user-defined workflow can then be saved to Signals Screening so routine assays can be run, and data processed in an efficient and repeatable fashion.
These new capabilities are additions on to the prior Signals Screening capabilities, such that our customers are now enabled for Basic Screening, High-Content Screening, as well as SPR.
Summarizing, the Signals Screening product includes:
- Core Screening Apps to support normalizing and processing results
- Calculation Explorer to enable rapid assay development and flexible new data processing
- Capabilities for directly editing data of plate maps and ad hoc raw data
- Surface Plasmon Resonance (SPR) Apps
- And the following TIBCO Spotfire® add-ons:
- SciStream™
- Columbus Navigator for Spotfire
- High Content Profiler
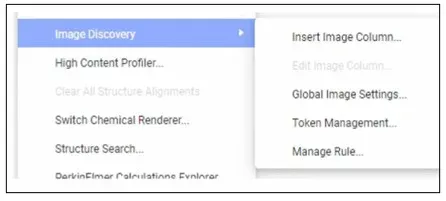
- Image Discovery
Product Compatibility
These applications require Spotfire® 10.3 LTS, or 10.10 LTS . Signals Screening is available for onsite deployment.
NOTE: with this release we are officially discontinuing support for Spotfire 7.11LTS version in the product.
Didn't find what you're looking for?
Check out older patch notes: (2020: 2.5.1 - 2.4.1)
Signals Screening 2.5.1 continues our rapid progress on the core screening and SPR capabilities to support scientists doing testing work throughout all stages of life science product R&D, from early-stage assay development all the way through late stage testing. This release is focused around adding official support for Spotfire® 10.10 LTS and for addressing specific targeted bug fixes and feature enhancements.
Curve Fitting and Calculations Explorer improvements. Signals Screening 2.5.1 adds several improvements to the settings that are stored with the CE templates including:
- Number formatting on Columns are saved
- The visibility states of all visualizations are saved
- Color schemes are captured and saved
- Curve fit results display includes a fit status “stop-light” and an improved results display
- Significant curve fit performance improvement during curve fit QA/QC
- Flexibility on the business rule to be used to knock out points automatically
SPR capability improvements
-
New Referencing App – Supports referencing of different flow cells with different reference flow cells, improved Summary table visualization, and improved Sensorgram visualizations with additional information in the tooltips.
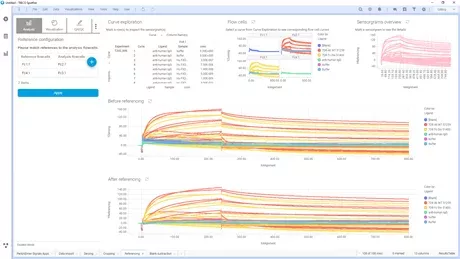
Fig 1: New Referencing App in Signals Screening 2.5.1 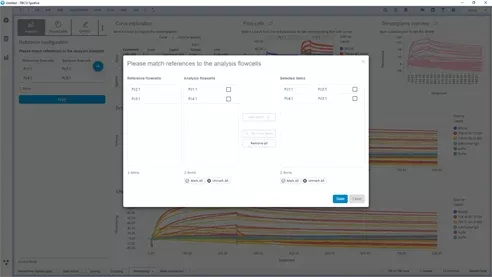
Fig 2: Flexible reference channel(s) selection - Also included in this release are many additional smaller bug fixes, feature enhancements, and incremental improvements.
Product Compatibility
These applications require Spotfire® 7.11 LTS, 10.3 LTS, or 10.10 LTS. Signals Screening is available for onsite deployment.
Signals Screening 2.5 continues the rapid progress on core screening and SPR capabilities to support scientists doing testing work throughout all stages of life science product R&D, from early-stage assay development all the way through late stage testing.
Core Screening capability improvements
-
Curve Fitting flexibility – Signals Screening 2.5 completes the overhaul in the core curve fitting capability, enabling support for all types of assay development, physical characterization and in vitro ADME workflows. Our curve fit engine now supports global vs local curve fitting equations, incorporating other (non-graphed) data in curve fits, as well as the inclusion of any raw data into final results. Also, curve fit equations are now stored and managed by the Signals Screening meta-store, making it much easier to expand which equations are rolled out to scientists out of the box.
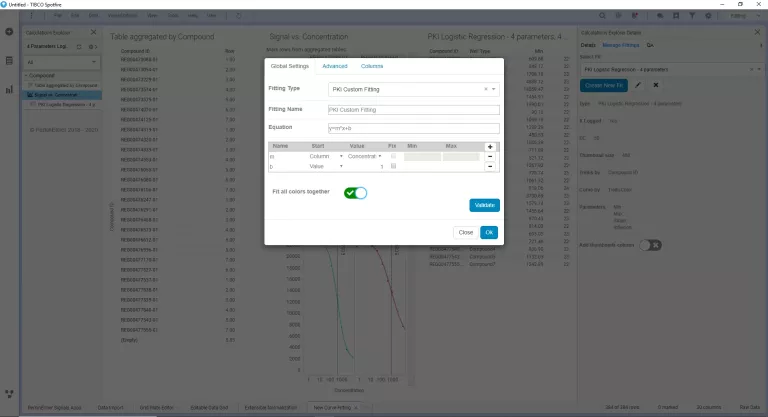
Fig 1: Global Curve Fitting equations -
New Curve Fit App – This App leverage significant improvements we have made to all Calculations Explorer workflows for curve fit selection and QA /QC. More curve fit options are now available, and data is auto matched to the curve fits wherever possible.
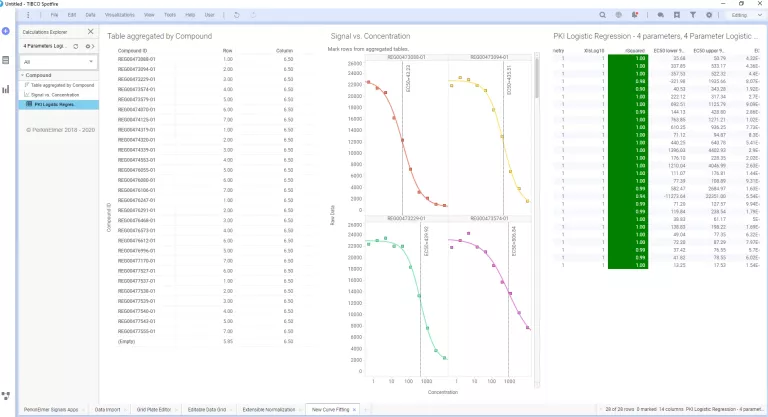
Fig 2: New Curve Fitting App in Signals Screening 2.5 - Automated point exclusion – Signals Screening now includes an option to automatically exclude datapoints using the GESD algorithm to facilitate the ease with which large datasets can be processed in the system. This automatic point exclusion capability will greatly facilitate how customers are able to apply business rules to their screening data automatically.
-
TERR dependency checking and facilitated R package installation – Users now can see all the R package dependencies for Signals Screening and download and install all required packages at the push of a button.
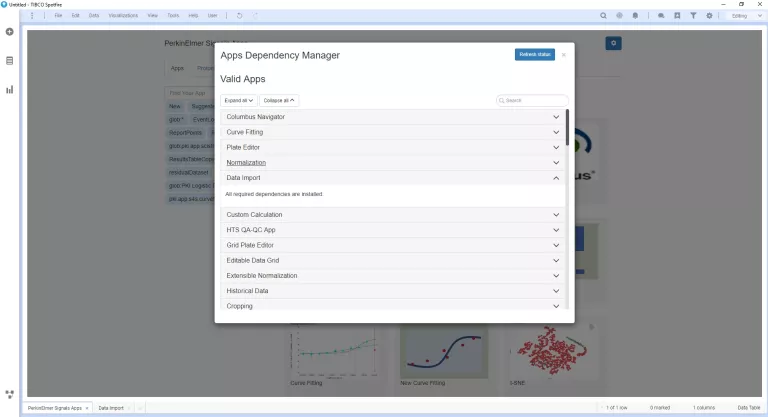
Fig 3: TERR dependency Manager
SPR capability improvements
- Biacore S200 instrument support
- New Multi-cycle Kinetics App – this improved workflow provides a significantly improved UI with replicate grouping, sensogram coloring, and better Rmax and results reporting.
- New Solvent Correction App – provides functionality to correct any signal distortions caused by the solvent used in small molecule signal measurements. The app allows the selection of solvent correction regions in the solvent cycle, as well as the position on the reference to be used for the correction.
- Also included in this release are dozens of additional smaller bug fixes, feature enhancements, and incremental improvements.
- Intuitive naming for data import tables
- Data import app now previews the plate map results
- Improved user workflow for curve QA/QC
- Toggle-able plate view in Normalization App
- Easier composition of final reporting tables
- … and much more!
This release of Signals™ Screening brings a new enhancement to the Editable Data Grid and allows historical data integration as well as new data publication app. This update also contains a few usability enhancements and fixes several small bugs.
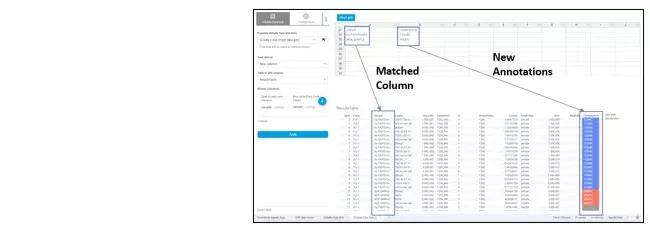
Adding plate specific details through the Editable Data Grid: Screening scientist often must join the list of Compound IDs (and any other plate specific details), while assembling a dataset. This allows for each plate maps to have specific meaning for that day's screening run. In 2.4.1, this ability is enhanced by leveraging the flexibility of the Editable Grid (so the user can copy-paste in the compound IDs) and allow for a more flexible join to be defined, using a mapping interface / workflow like that in the Calculations Explorer.
Users can now:
- Add Compound IDs and other columns can be directly added to the Editable Grid display.
- Add their data in the Editable grid and define how that data should be joined to the Imported data and Plate Map.
-
The app saves the table definition and join conditions into Protocol.
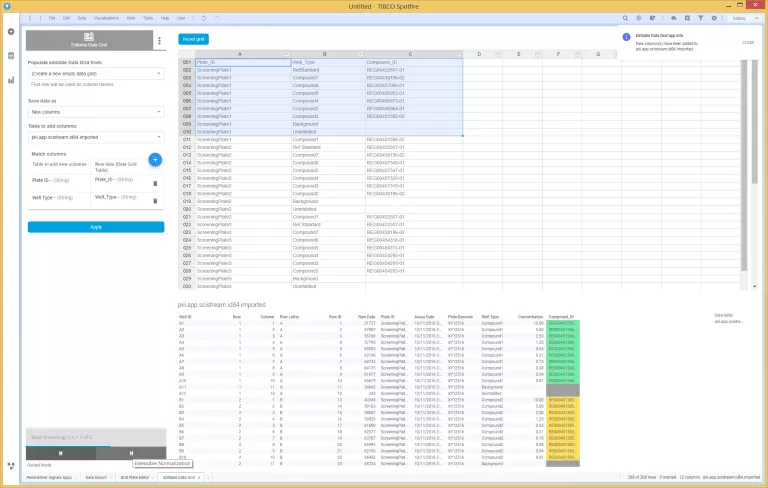
Fig 1: Editable Data Grid Enhancement: Add plate specific details
Normalization App Enhancements: along with fixes for previously noted bugs the enhancements to the normalization app now utilize the Calculations Explorer as its core engine, such that the calculations are consistently using a single calculation methodology.
- In addition to an expanded set of core Normalization Calculations, the App can access and apply any stored Calculations Explorer template document that has been configured to act as a Normalization calculation.
-
In all cases, the Scientist is guided through the Normalization process with point-and-click ease to select the Well Type and Positive / negative controls using the same interface as in the prior version of the Normalization App.
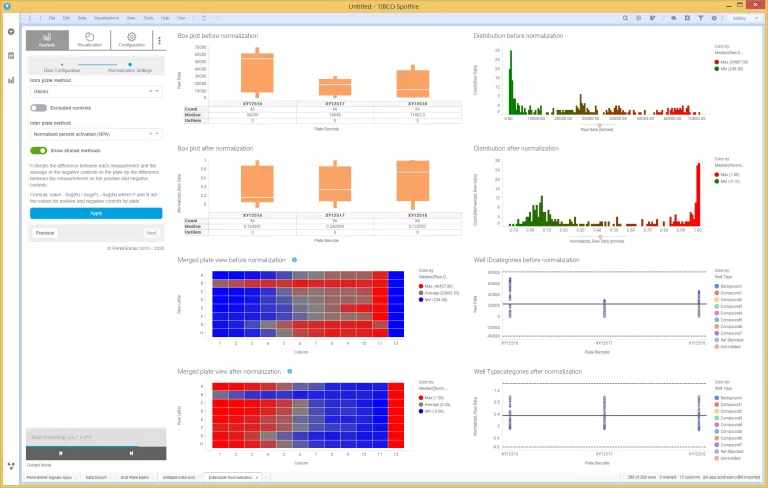
Fig 2: Expanded normalization app in Signals Screening - Curve Fitting flexibility. Signals Screening 2.4.1 includes an overhaul of the core curve fitting engine and algorithm to expand its capabilities, increase its accuracy, and provide more facilities for curve QA/QC control. User control over which core curve fitting algorithm to use either the Levenberg-Marquadt algorithm and the robust algorithm IRLS.
- Support for weighted curve fits including all the standard weighting methodologies.
- Support for constrained curve fits, that will properly limit the range of allowed returned parameter values to user-defined ranges.
-
Significant usability improvements to curve fit QA/QC workflows
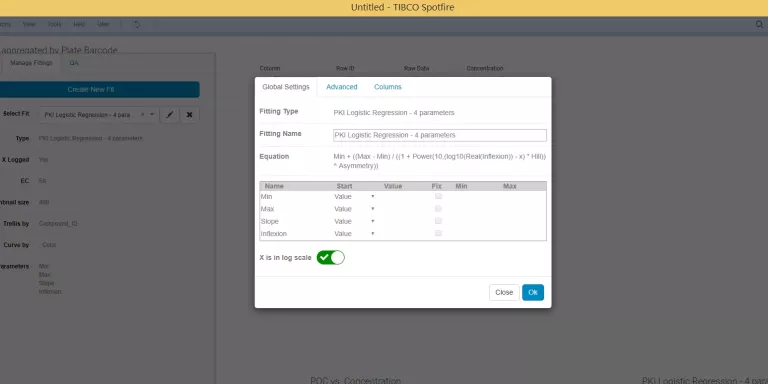
Fig 3: Curve fitting flexibility: Managing global curve fitting settings 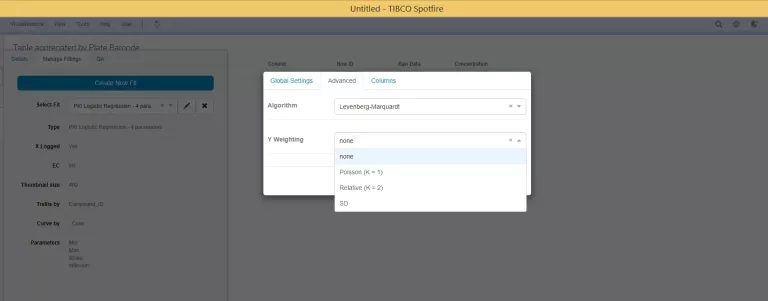
Fig 4: Curve weighting options
Ability to pull in historical (batch equivalent) data for data trend review before data publication
- Scientists can now pull all historical results for equivalent compounds or compound batches into their current Signals Screening workflow. This feature enables scientists to confirm consistency with historical trends before publishing new data.
Publish to SLD as an App:
Signals Screening 2.4.1 includes and utilizes the new SLD Publication App, such that a fully configured publication configuration can be saved as part of a Protocol.
The final step of a screening workflow is to publish results into Signals Lead Discovery, currently this must be done manually at the end of each protocol. User will be guided to capture following data through this App and process:
- The Measurements that represent the assay endpoints (e.g. IC50).
- The associated Measurements that represent the penultimate details that were used to derive that assay endpoint (e.g. the individual % inhibition data points that defined the dose-response curve).
- The curve thumbnail image, if a curve fit is defined
Product Compatibility
These applications require Spotfire® Professional 7.11 LTS and 10.3 LTS Signals Screening is available for onsite deployment.