How EMD Electronics Unified Scientific Data for Advanced Analytics Through a Strategic Collaboration Between Revvity Signals and Scitara


Introduction
Merck KGaA, Darmstadt, Germany, is a leading global science and technology company that combines three specialized, innovation-driven businesses: Life Science, Healthcare, and Electronics. The electronics division, EMD Electronics, provides chemicals, formulates materials, and synthesizes materials for chip manufacturers. As technology provides new capabilities, scientists at EMD Electronics have begun using advanced analytics, including artificial intelligence (AI) and machine learning (ML), to accelerate the development of new chemicals that meet their customers’ needs.
However, to effectively utilize these analytical tools in discovery and product development, EMD Electronics had to find a way to aggregate and structure data in a form that both machines could process, and humans could understand. Their raw files were technically readable, but they lacked context, clarity, and presentation.
To address this challenge, EMD Electronics partnered with Revvity Signals and Scitara to implement a connected, cloud-native solution that unifies and structures research data. This strategic collaboration enabled streamlined, automated data integration laying the foundation for advanced analytics and AI-driven insights.
The Challenge of Interpreting and Utilizing Fragmented Data
In the quest to develop new materials for chips, scientists at EMD Electronics use a variety of experiments and techniques to evaluate material candidates. The company was experiencing difficulties, however, in collecting and managing this data.
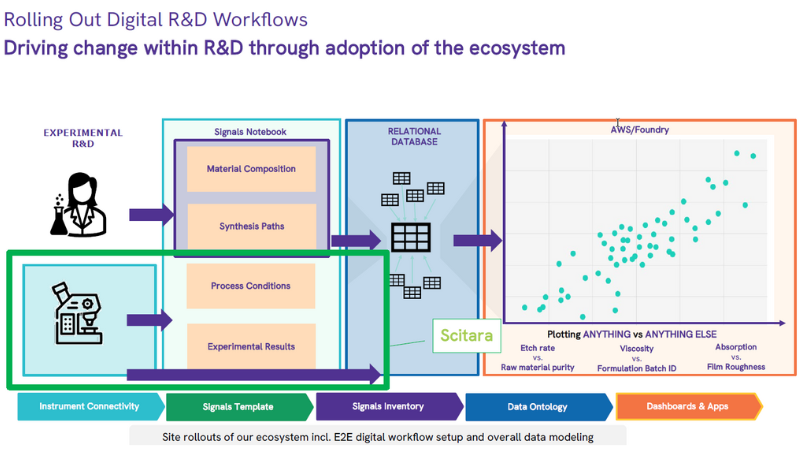
For instance, when their scientists use atom layer deposition laying down thin layers of materials onto wafers an arsenal of metrology instruments, such as ellipsometers and infrared spectrophotometers, analyze the material, generating information on qualities like thickness and electrochemical properties. The EMD Electronics team required a unified, structured system to integrate data from these varied sources, to enable them to utilize the information to its full potential. They also needed a way to visualize the data effectively and dynamically, moving beyond raw numerical text to intuitive graphical representations. In addition to facilitating data interpretation and decision making, data visualization tools would also enable clearer and more engaging communication with customers.
Connecting the Lab with Automated Data Capture and Transfer
To address these challenges, EMD Electronics implemented a streamlined, automated data integration strategy. By deploying Scitara’s integration technology, the team can aggregate data directly from scientific instruments, while Signals Notebook captures non-instrumental data from experimental research. This unified approach ensures that all data, instrument-generated and manually entered, is properly structured and collected in one consistent, secure, and centralized location.
To transform this data collection strategy into a practical solution, EMD Electronics implemented a systematic, step-by-step approach to data transfer and integration:
- Step 1: Data Collection. Whether instrument data is stored on-premises or in the cloud, Scitara’s integration technology collects and transmits raw data to Signals Notebook for interpretation. This platform enables flexible, bidirectional data flow across multiple systems, ensuring seamless integration of diverse data sources.
- Step 2: Simultaneous Data Routing. As data is sent to Signals Notebook via the joint solution developed by Revvity Signals and Scitara, it is also routed to a relational database where it can be organized and structured. Here, the EMD Electronics team begins building an ontology layer, a framework that defines relationships and context across datasets, enabling more meaningful data interpretation and integration.
- Step 3: Data Structuring. Once structured through the ontology layer, the data becomes ready for downstream analytics. Scientists can access and select relevant datasets directly within Signals Notebook, supporting more informed experimental design and data exploration.
- Step 4: Scientific Analysis. With structured, integrated data in place, scientists can build dashboards and perform advanced analytics. This enables flexible, dynamic exploration, essentially allowing users to “plot anything versus anything else,” and supports data-driven decision-making across research workflows, including the use of AI and ML tools.
Quote from Kyle Mouallem
"Now we can send something to our Signals Notebook at the same time that we send it to the relational database, and then it's up to the scientists if they want to pull it into their experiment or not.”
Key Results and Benefits
Implementing Signals Notebook with Scitara’s integration technology has enabled the scientists at EMD Electronics to focus on analysis and interpretation rather than data management. They can now extract all data points from their laboratory measurements and create visualizations, such as graphs, to more easily share them with customers and to facilitate collaboration and interpretation of findings. And because the data is now unified and properly structured, it can be used effectively with AI and ML tools.
Looking Forward to Predictive Insights and Continuous Optimization
By integrating laboratory instruments with Signals Notebook through the joint solution developed by Revvity Signals and Scitara, EMD Electronics has established the critical infrastructure for a modern laboratory: automated processes that integrate data from every source. By structuring, standardizing, and contextualizing this data, they have enabled advanced analytics, including visualization tools, artificial intelligence, and machine learning.
Soon they will be able to add even more AI capabilities, such as extracting and analyzing data from results screens from older instruments that lack data export capabilities, as well as using AI agents for predictive insights and continuous optimization.
“As all the information flows, is audited and controlled. We’re now connecting the lab IT with the corporate network and the cloud solution, which is becoming more and more standard.”
Discover the power of seamless lab connectivity.
Learn how the strategic collaboration between Revvity Signals and Scitara is driving innovation in scientific data integration paving the way for next-generation solutions like Signals DLX, designed to unify and automate modern laboratory workflows.

End-to-end workflow support across scientific disciplines.

The Standard for Chemical Drawing.

End-to-end Clinical Data Science Platform.