What’s New
We are delighted to release our new version of Signals, 26.4.
The following improvements are available for users, administrators and developers on the Signals platform. Certain features may only be available with appropriate licensing and/or with enablement by an administrator.
- Fundamentals
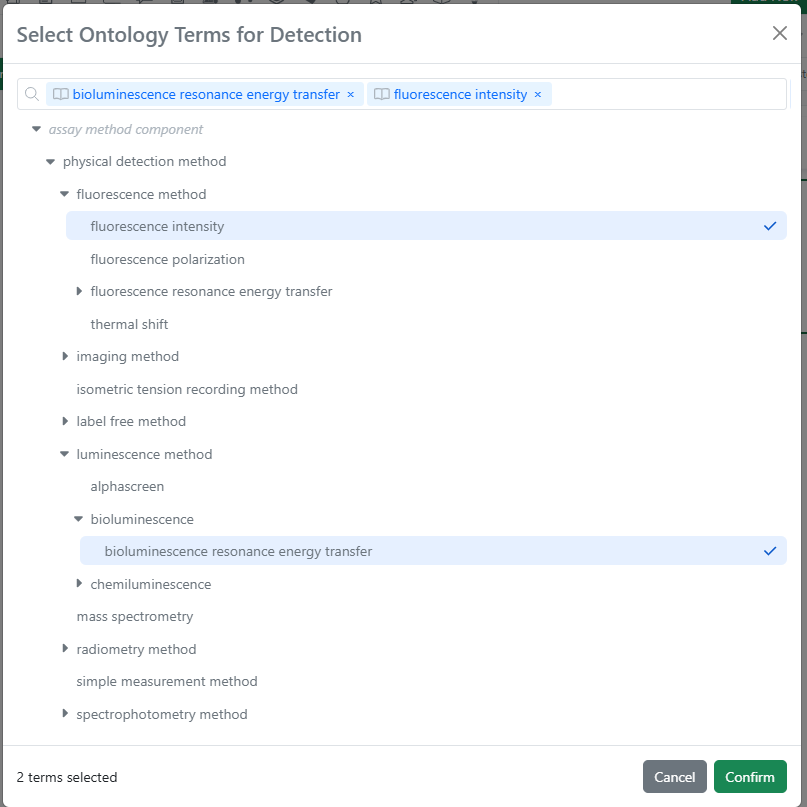
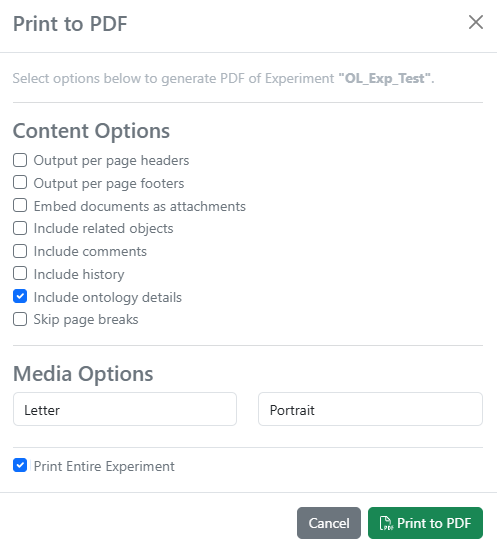
– Ontologies integration allows terms to be used across experiments, materials, tables, and more available to all systems
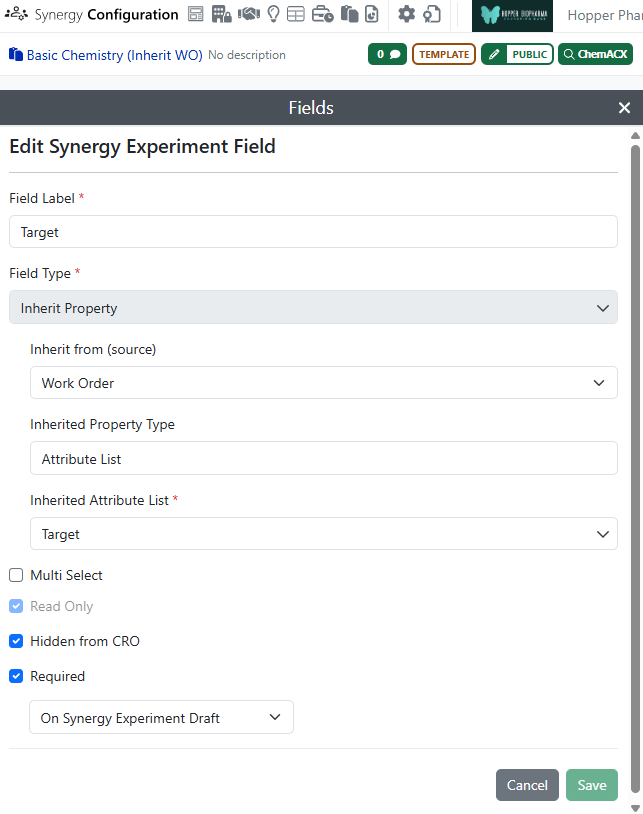
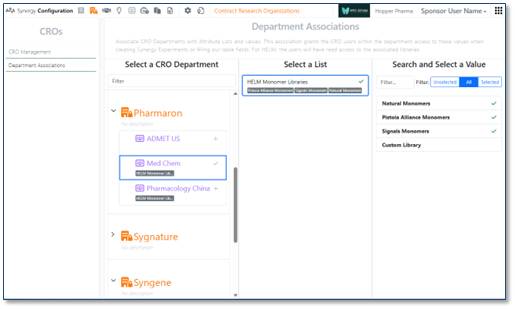
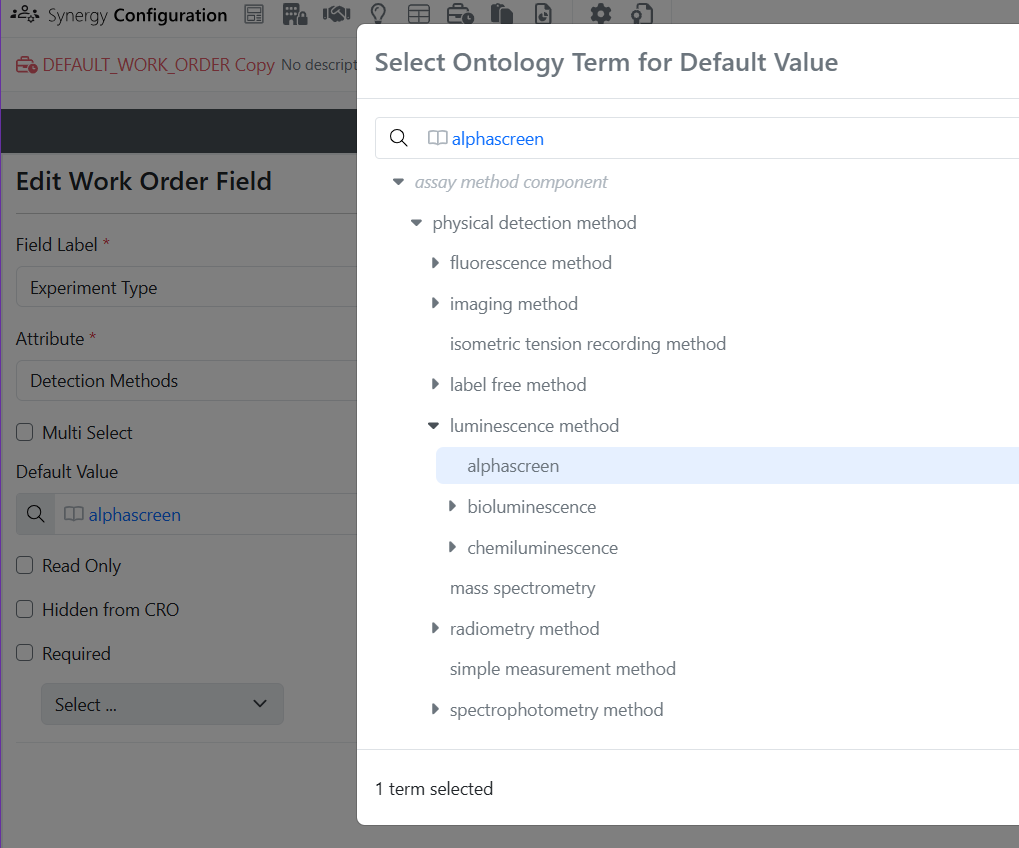
– Ontology integration now supported in Synergy, including Collaboration, Idea, Work Order, and Synergy Experiments Templates, as well as Designs and Reference Table fields available to all systems
– CSV import handling for ontology terms
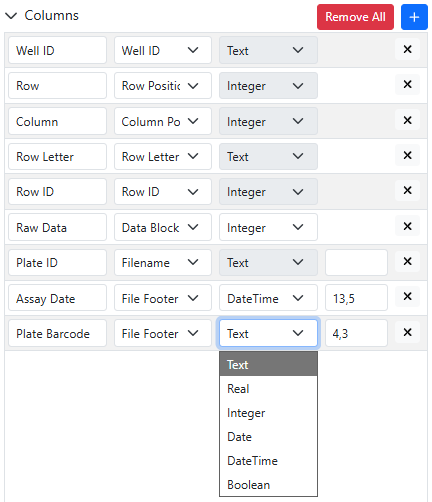
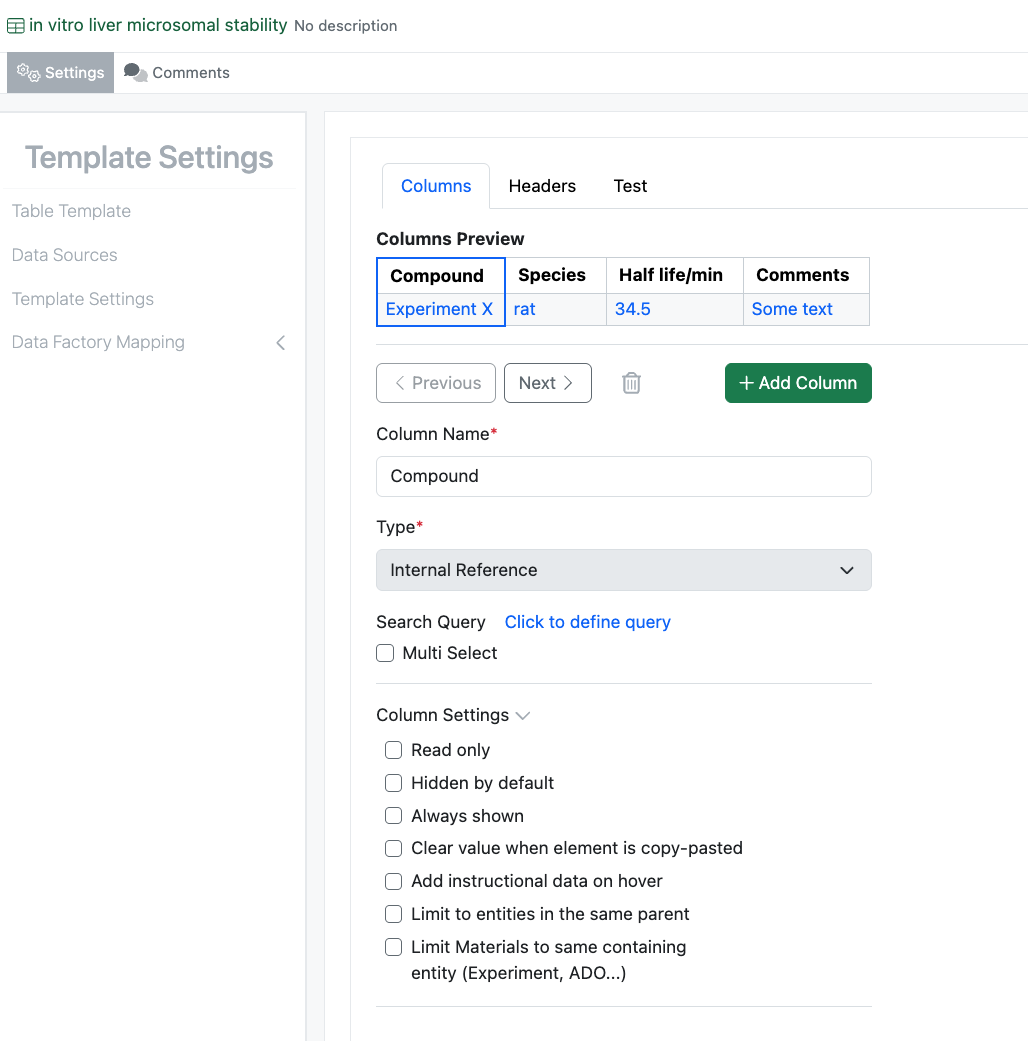
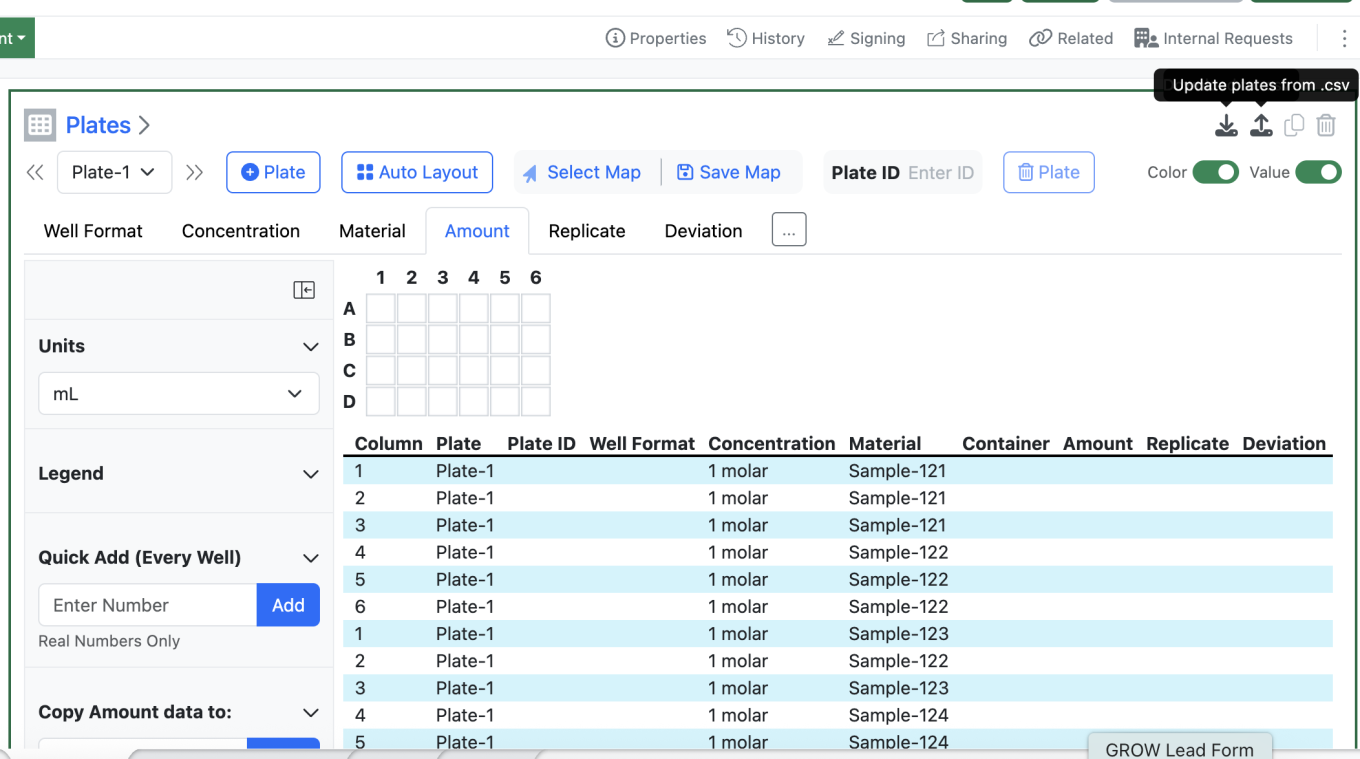
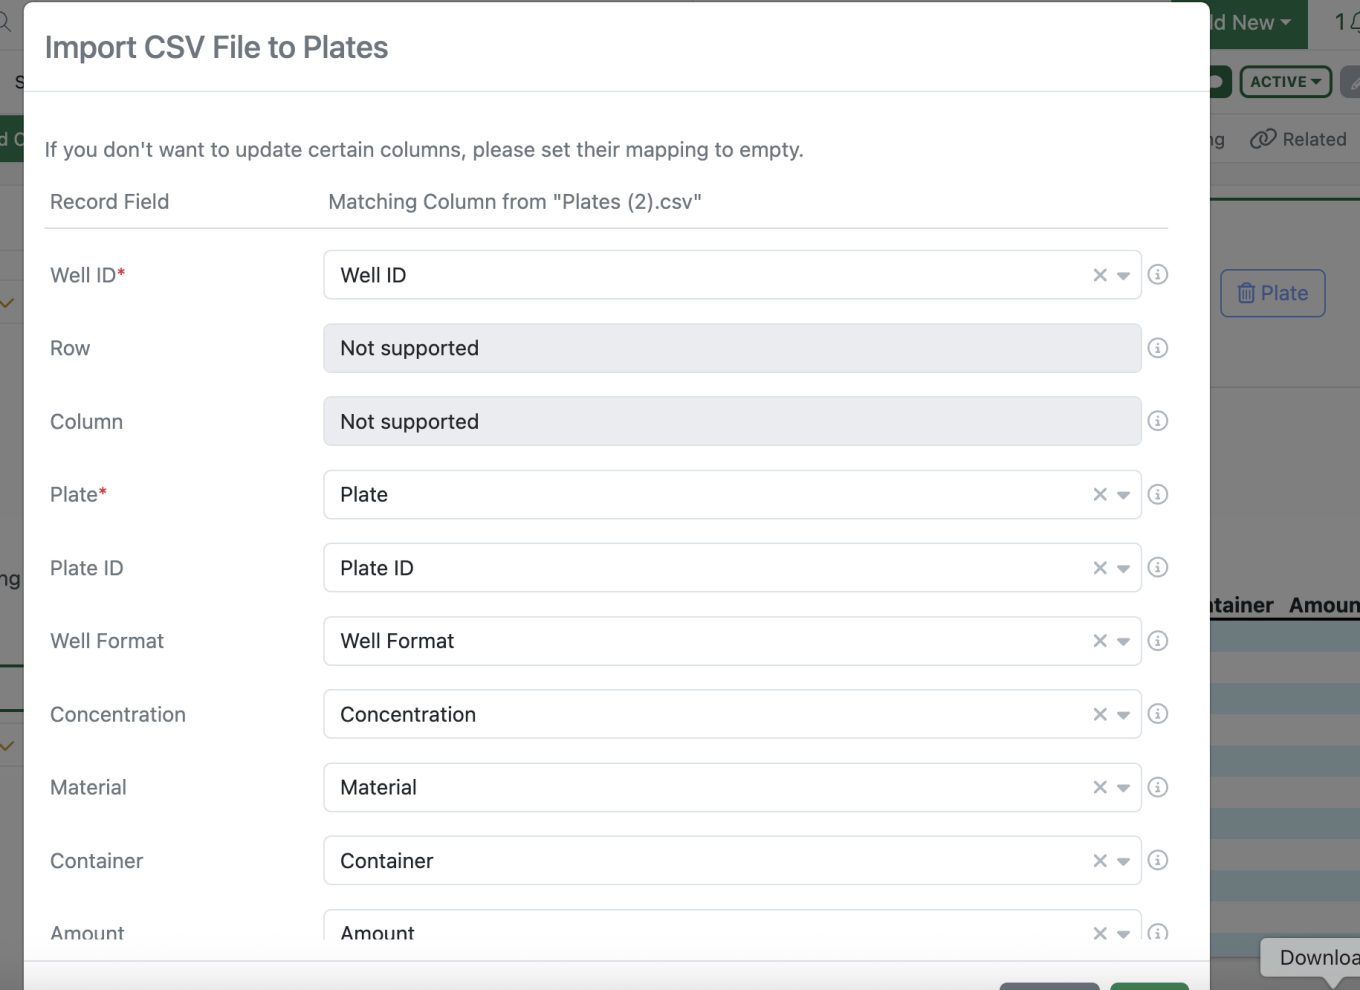
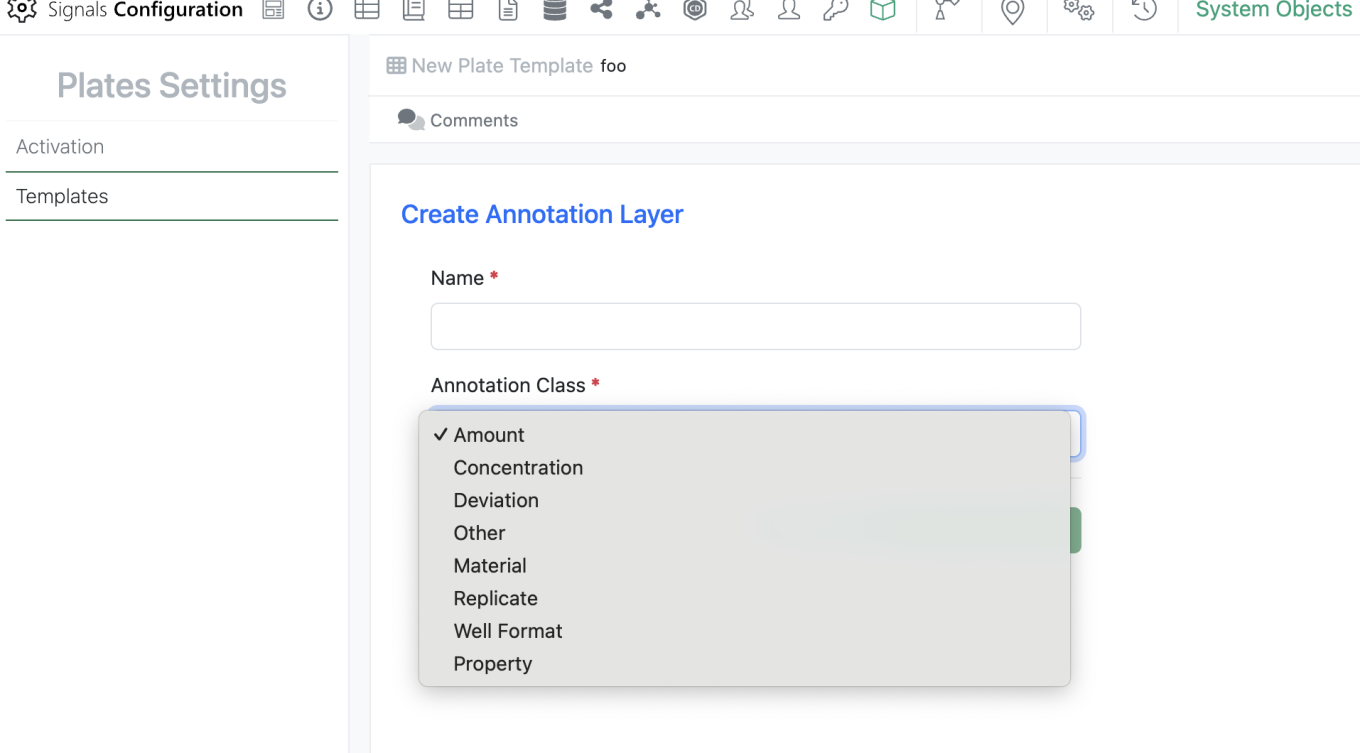
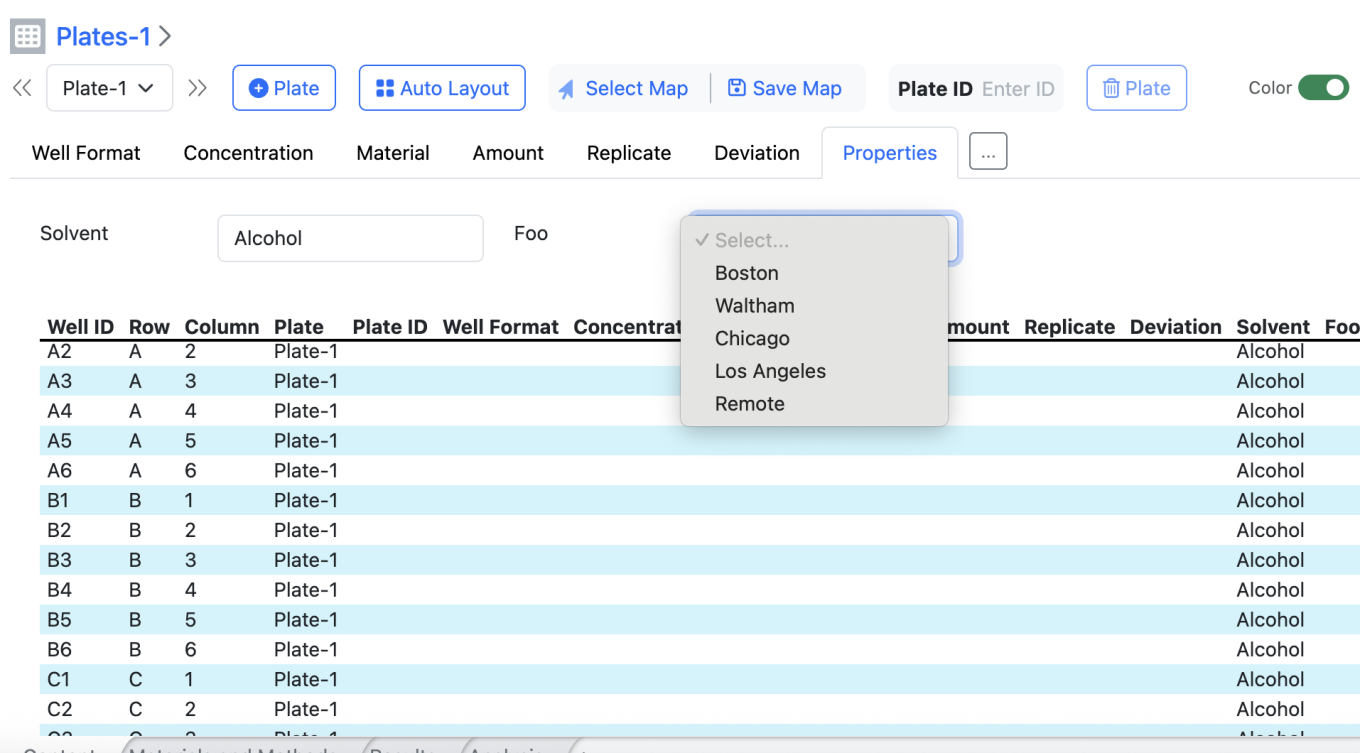
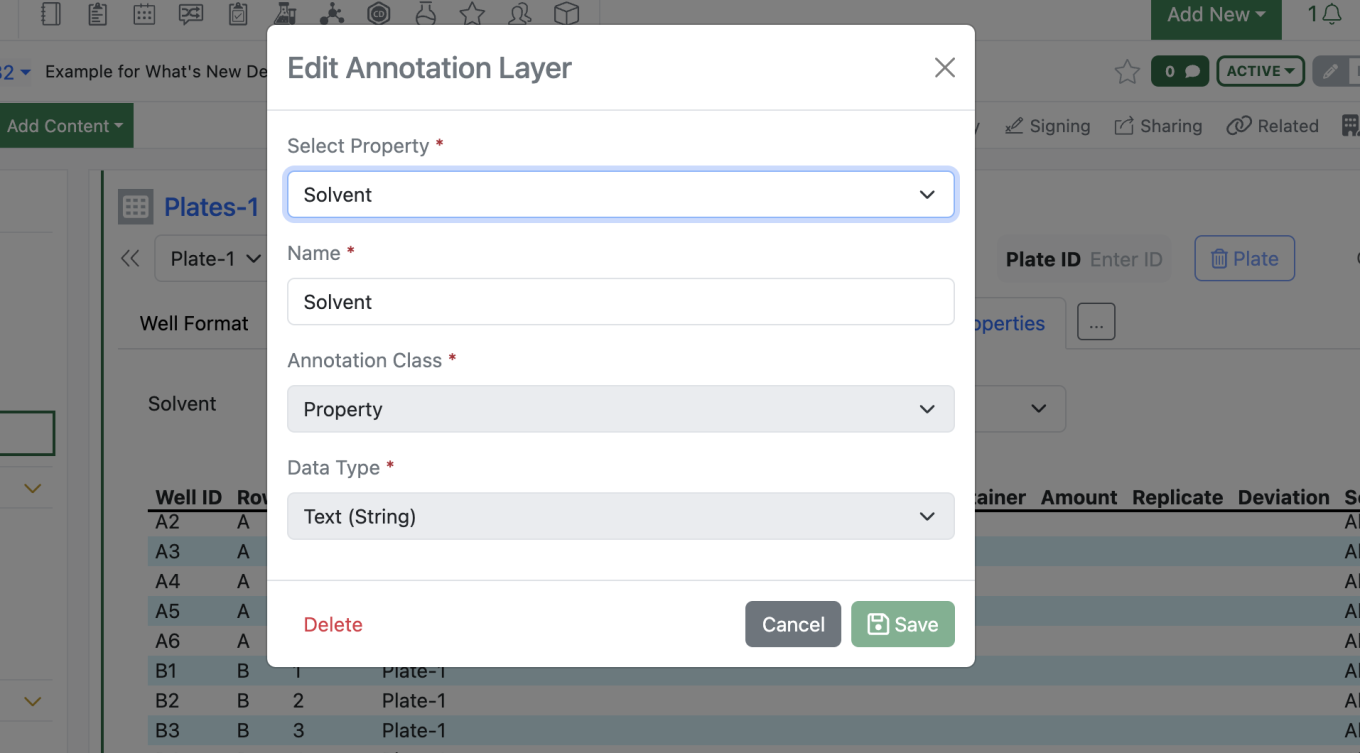
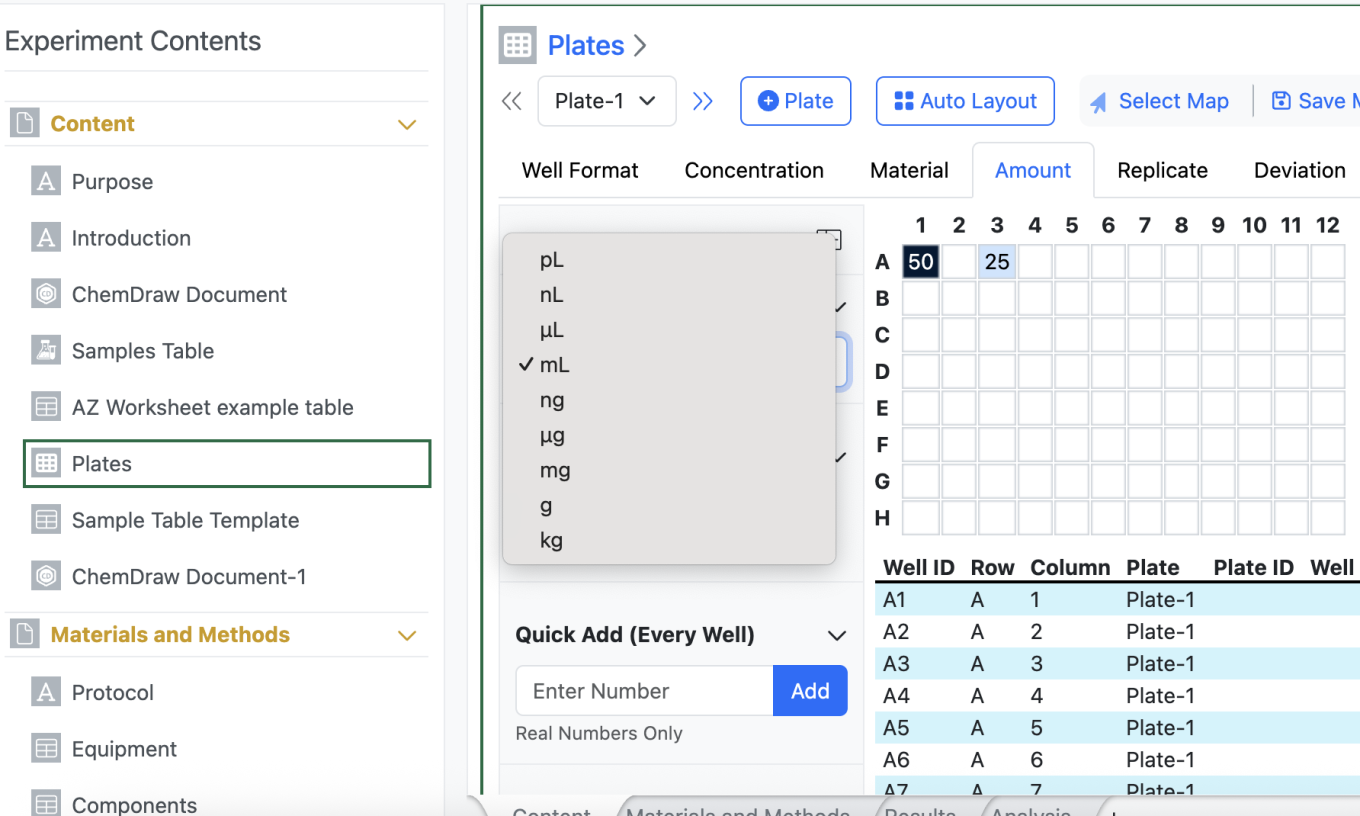
– Ontology support for plate templates
– External Ontology Sources now support SciBite CENtree
– Audit trail displays highlighted granular changes for text elements (beta)
- AI
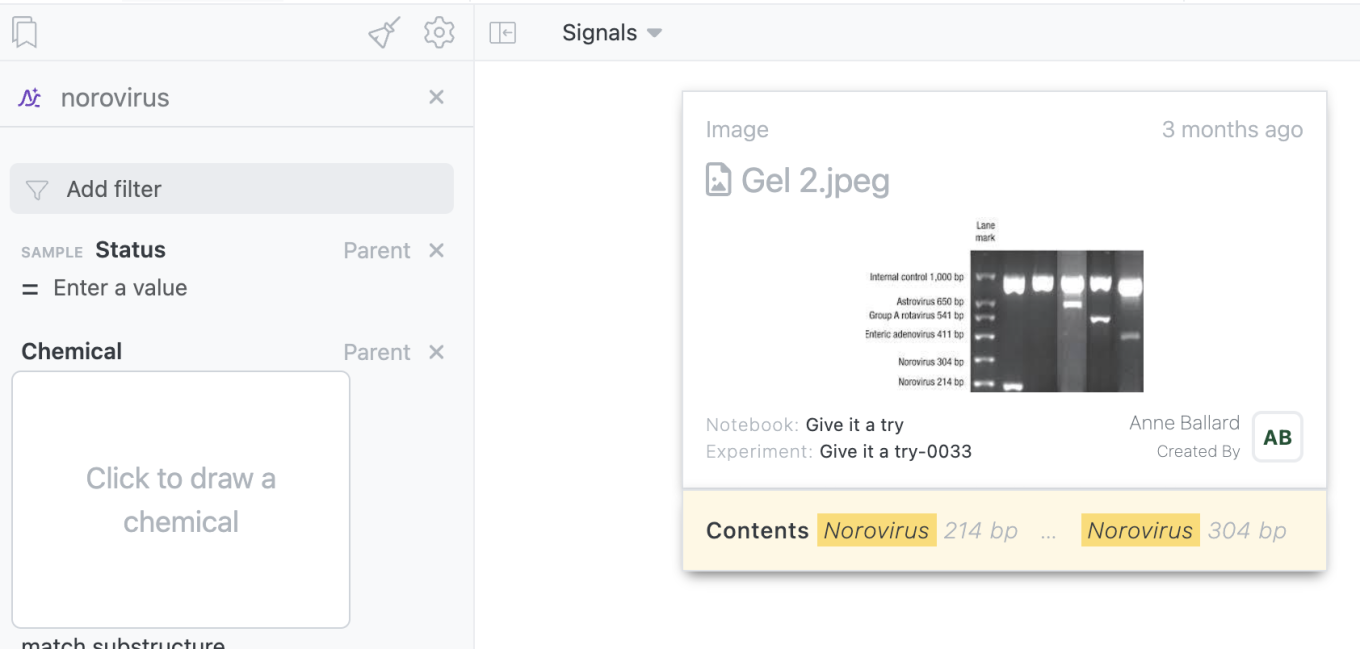
– Prompt-to-filter (beta)* - Data Workflows & Analytics*
– Data Assembly continuous viewer
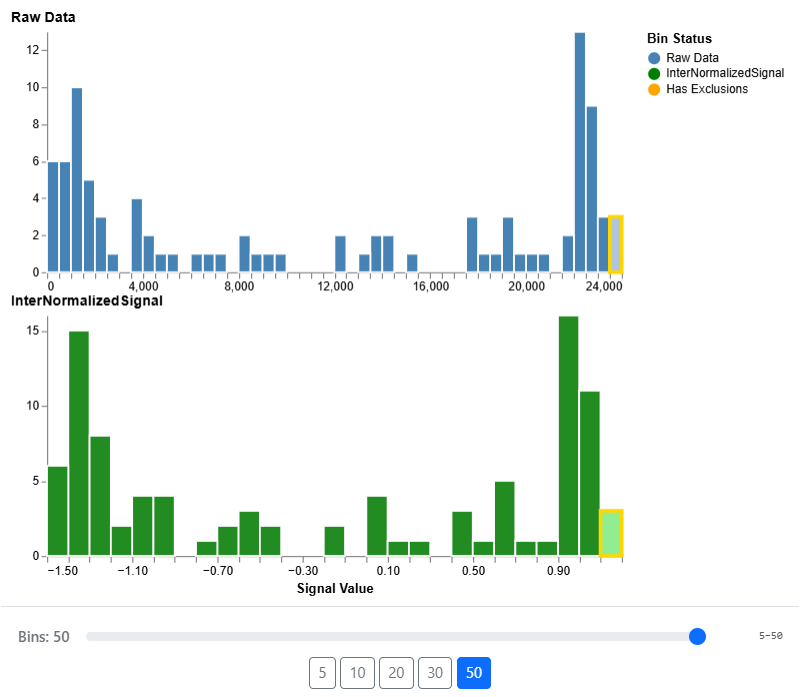
– Median-based robust Normalizations
– Additional Quality Control metrics
- SAR & Decisioning*
– Ontology support on Inventa Analysis templates
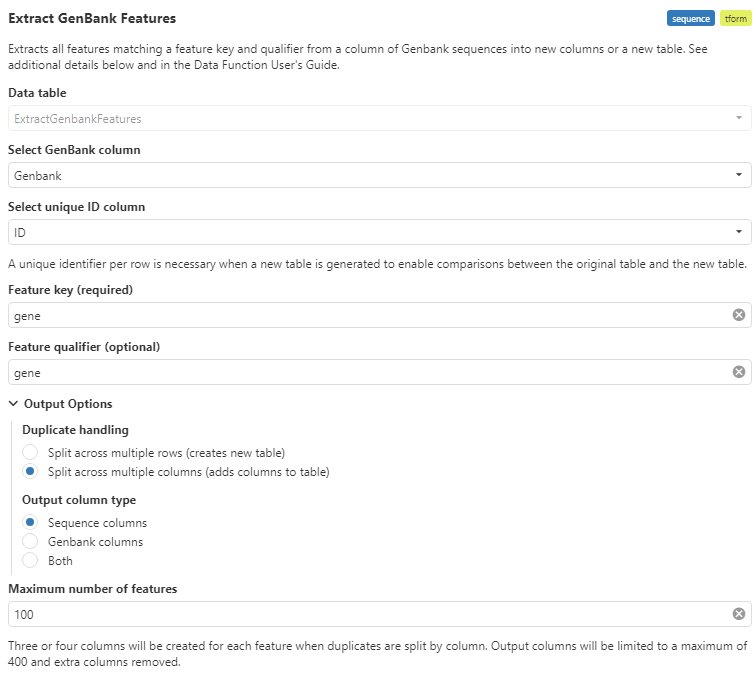
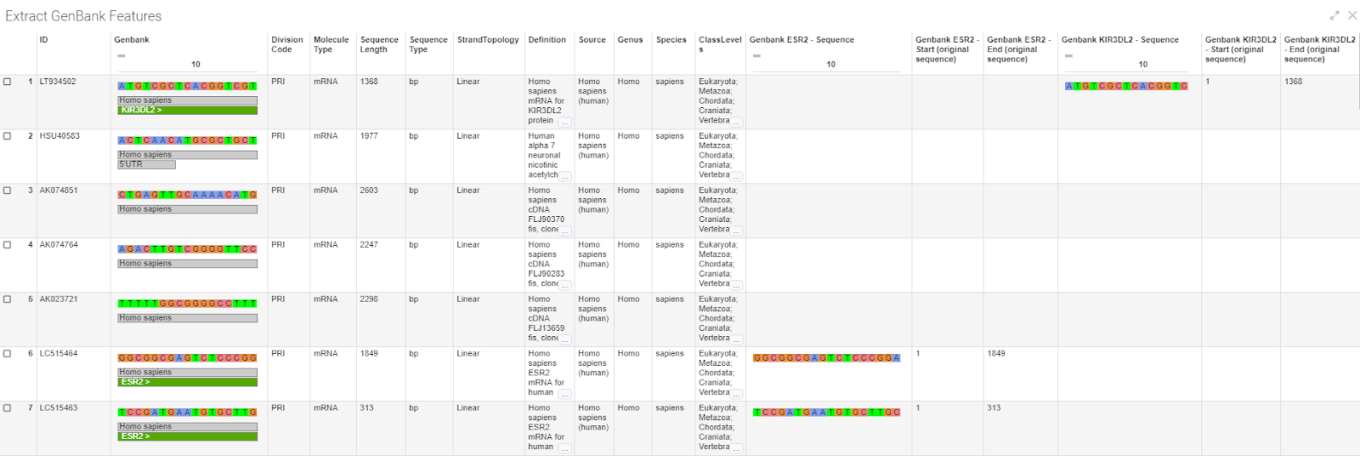
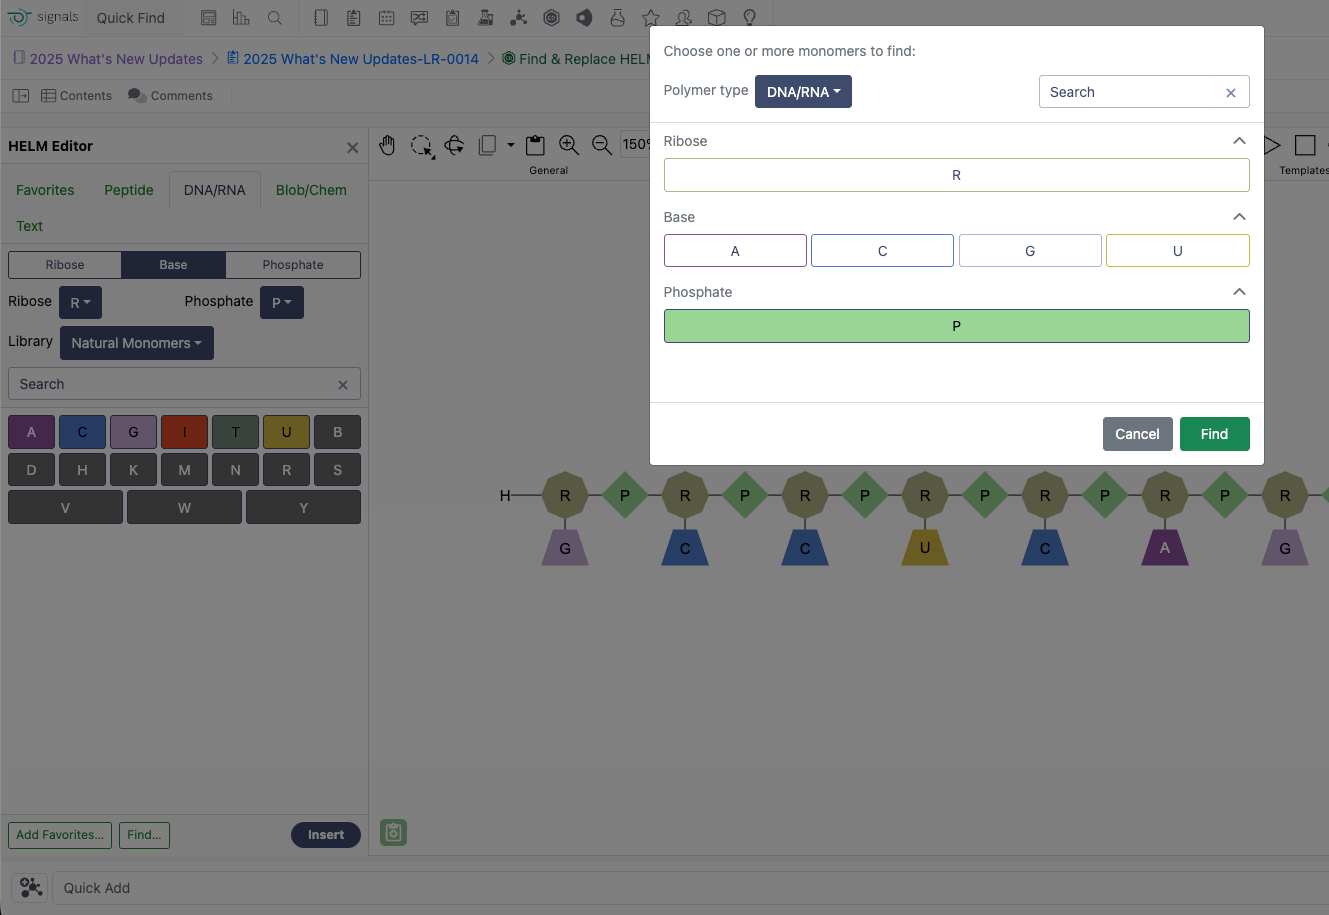
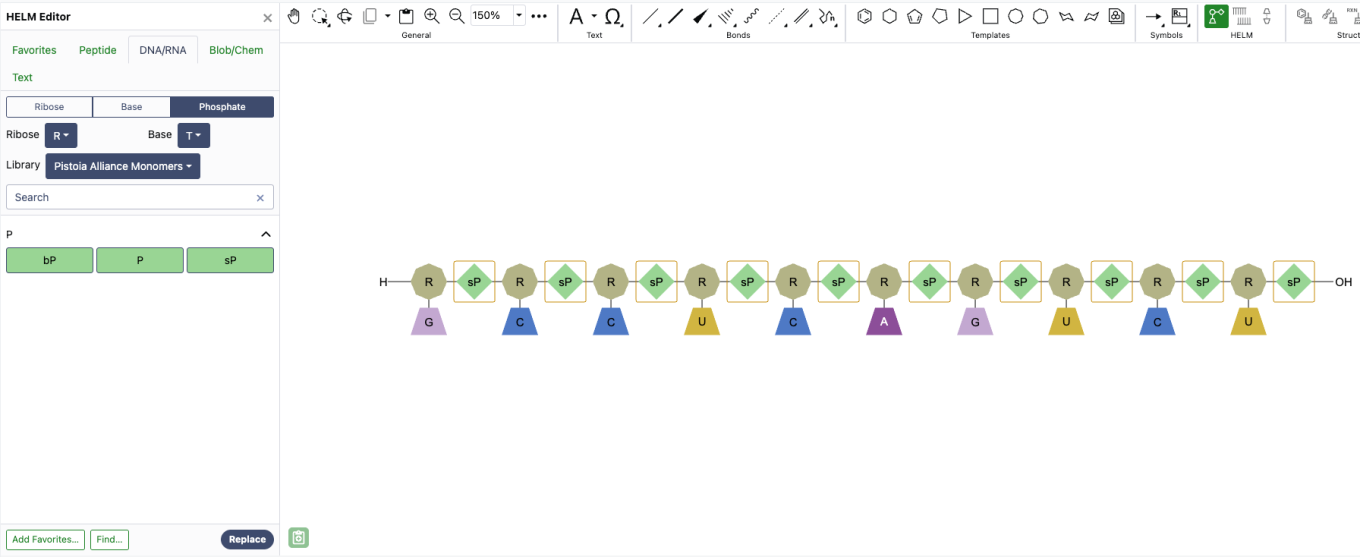
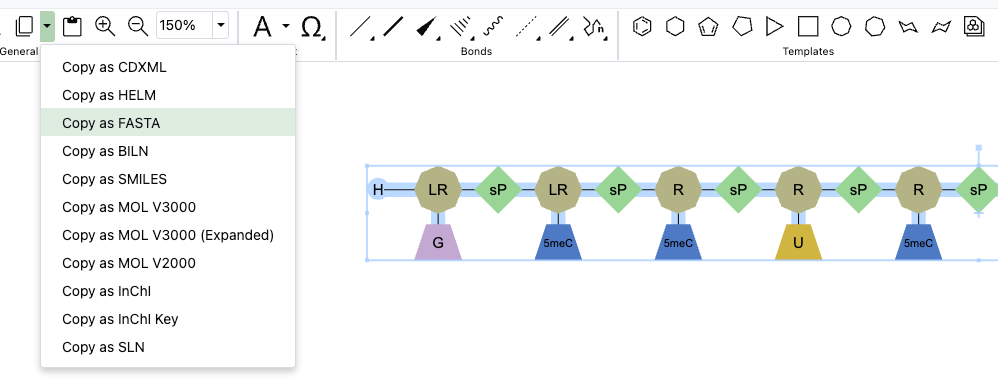
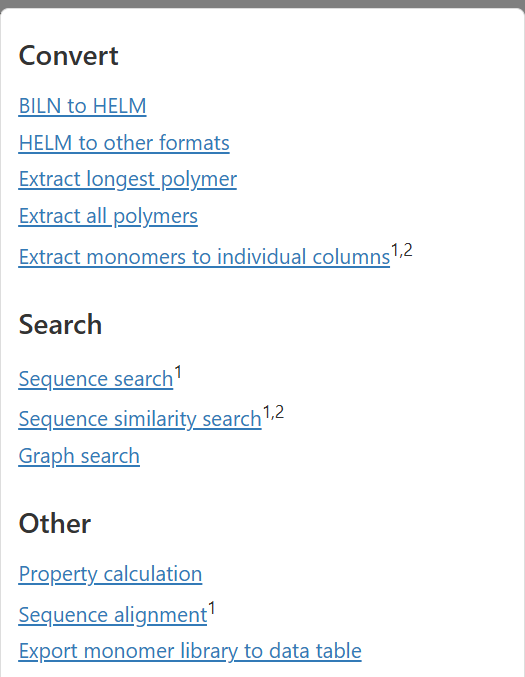
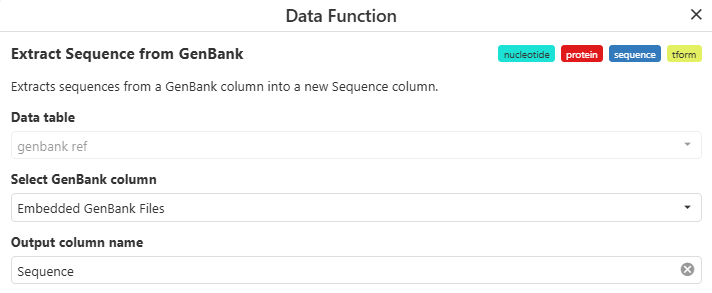
– New ChemCharts Biopolymer data functions
– ChemCharts Table usability improvements
- Synergy†
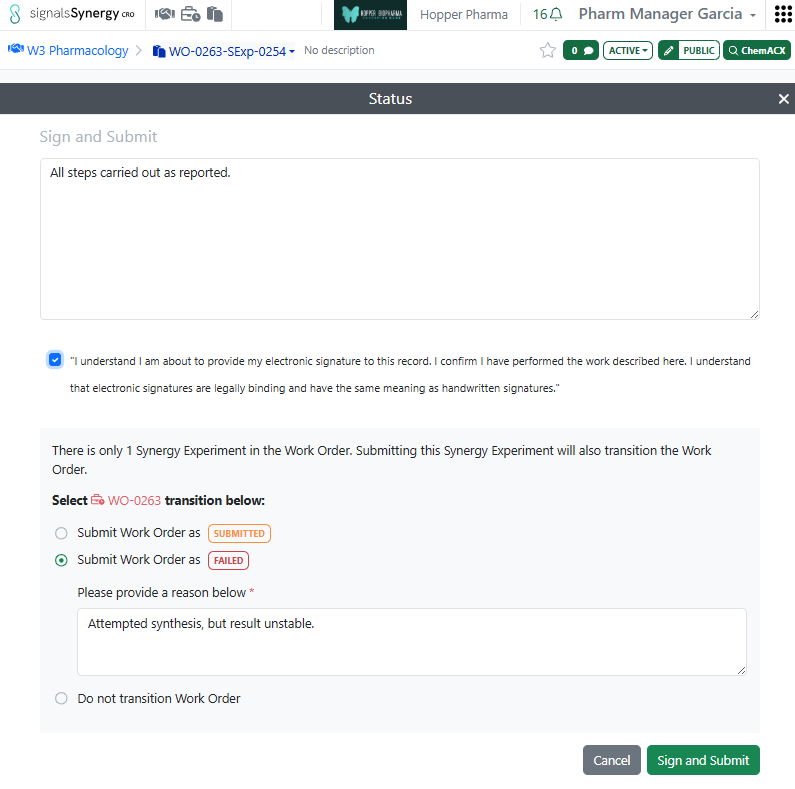
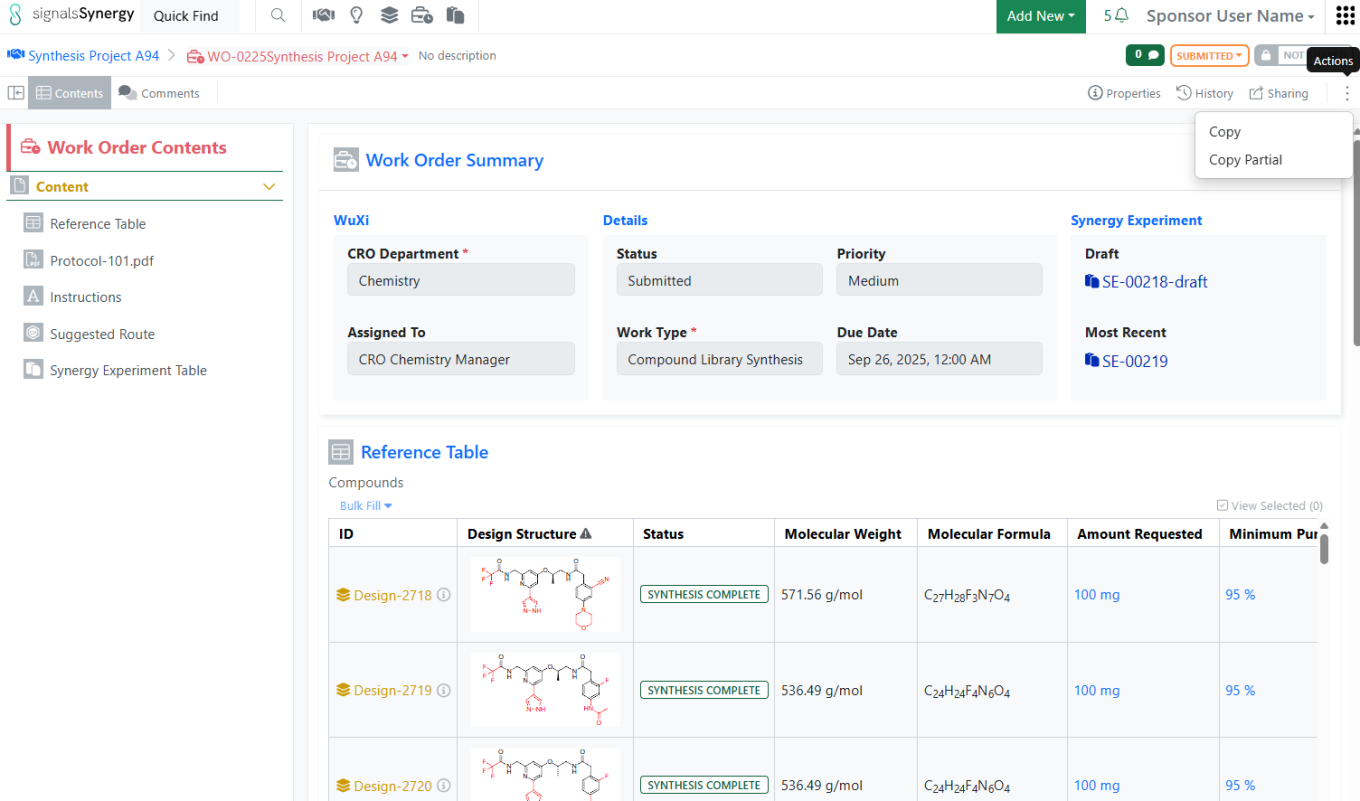
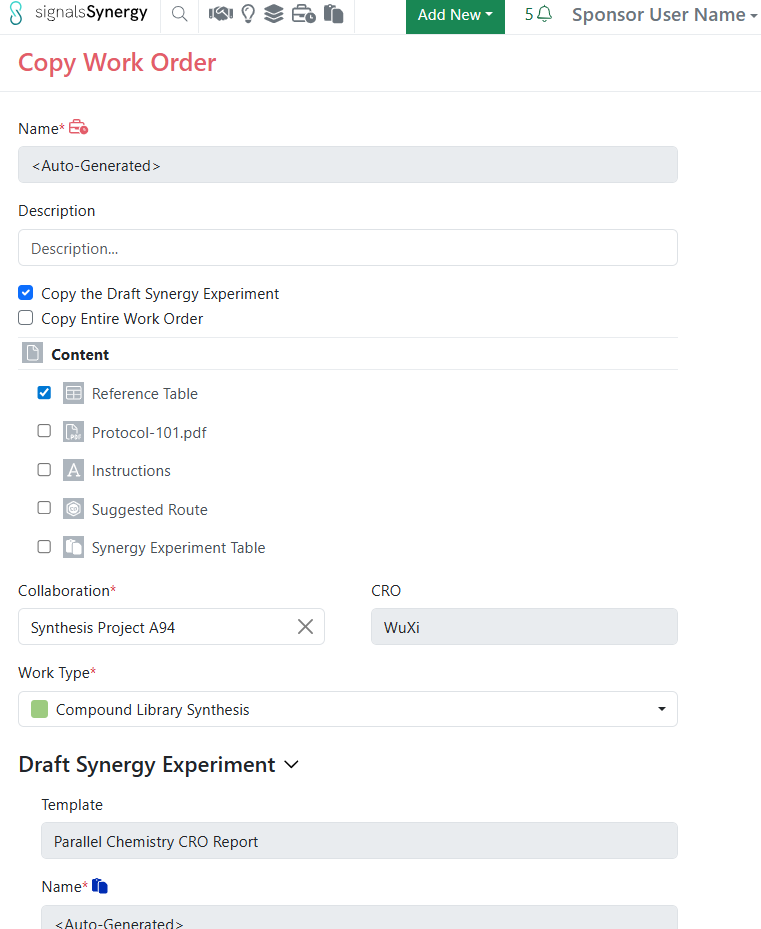
– Collaboration setting allows Sponsor admin to choose whether to use Material IDs or aliased ExIDs with CROs
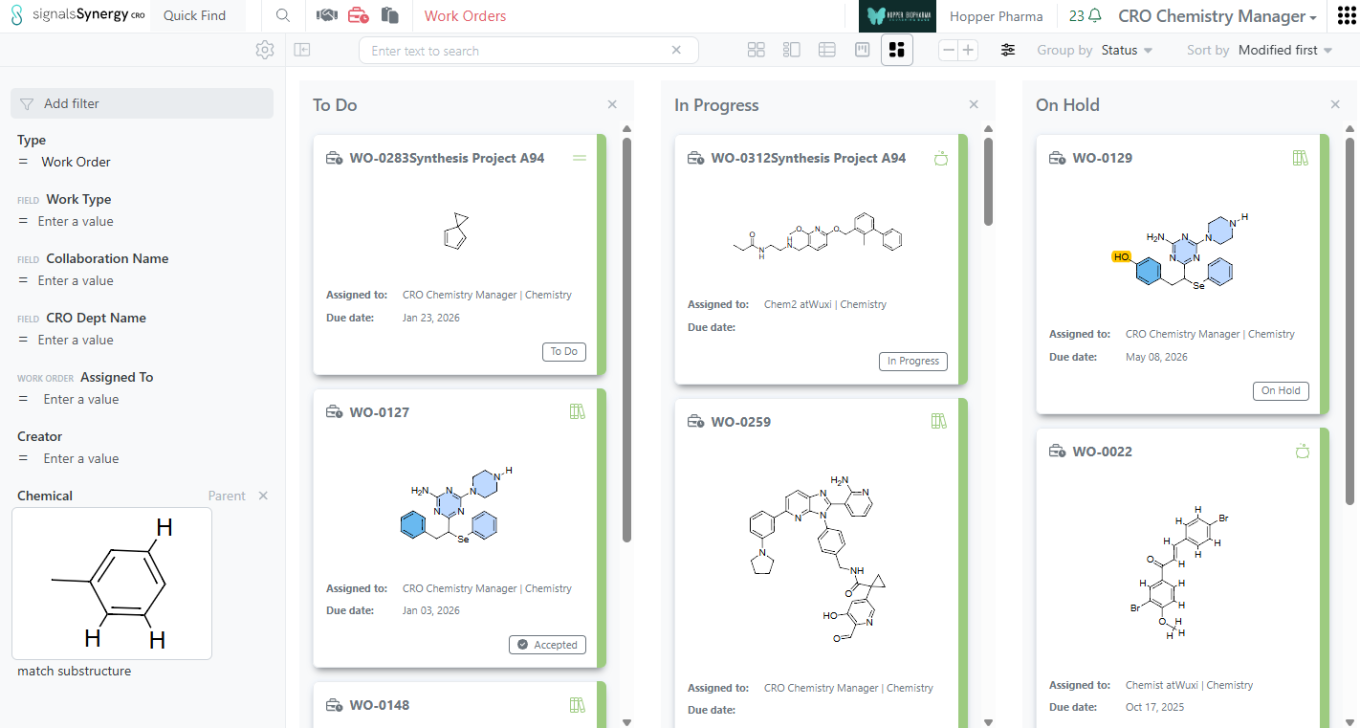
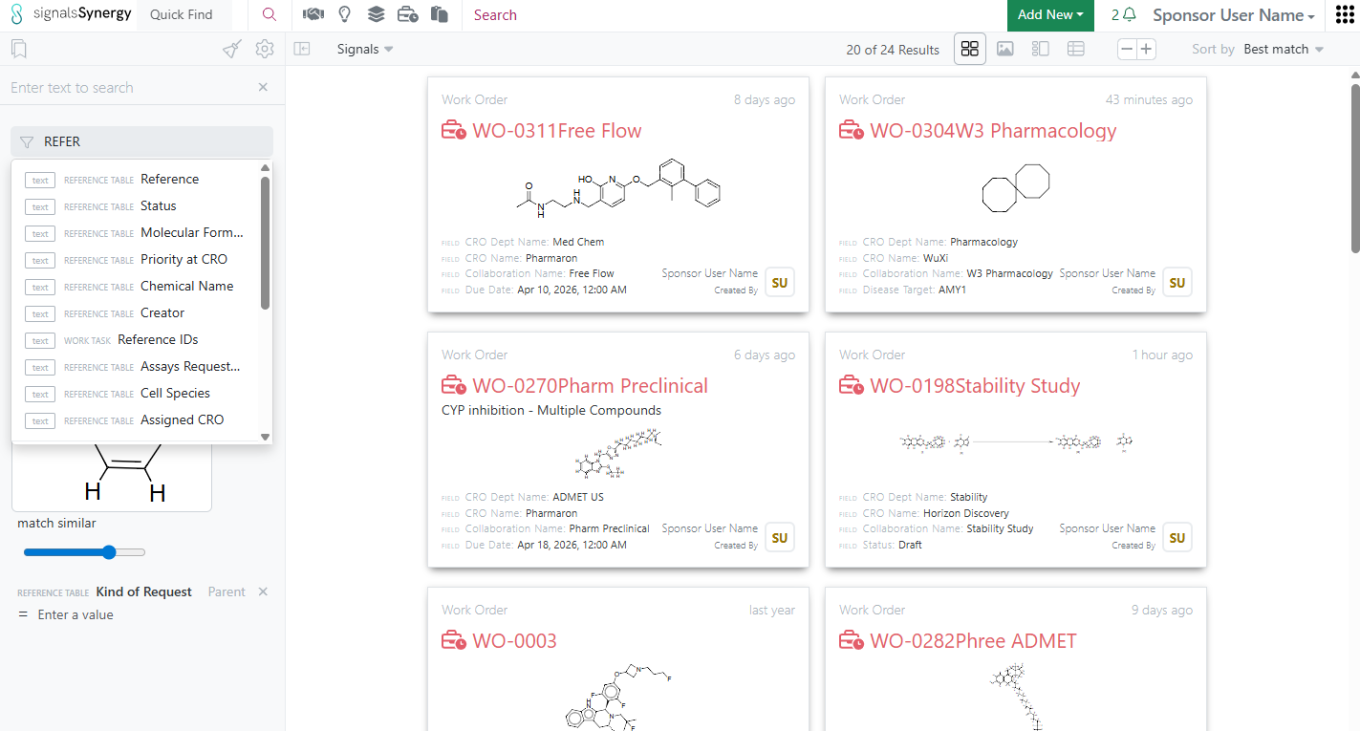
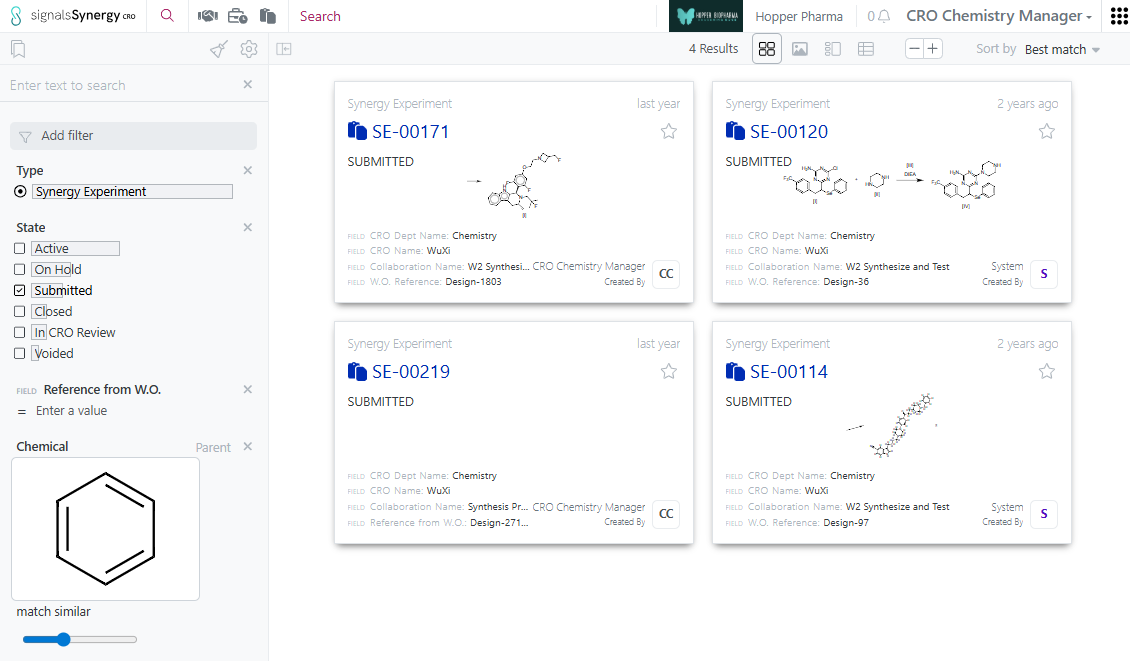
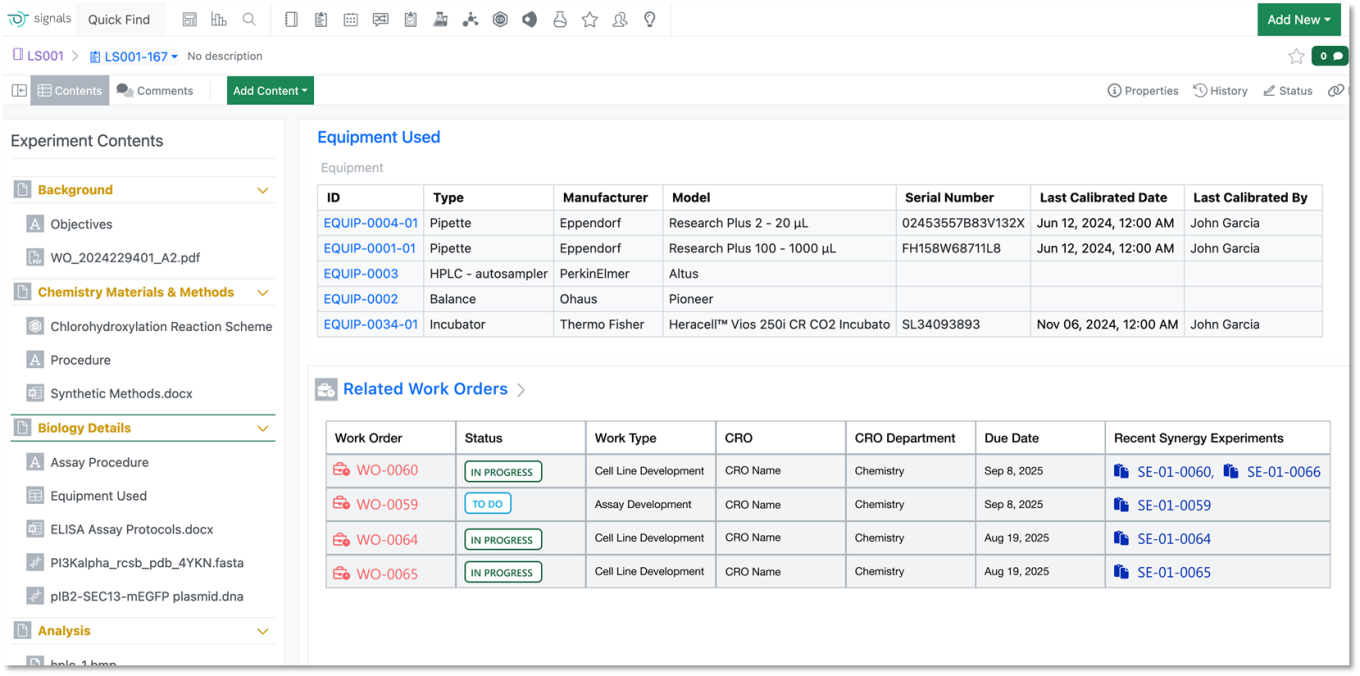
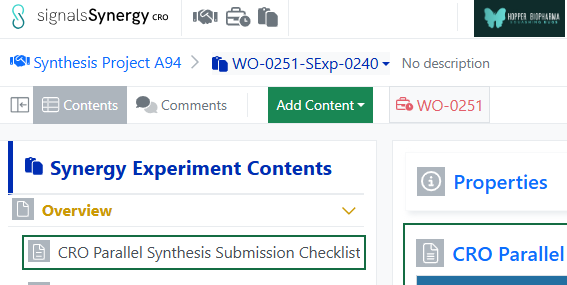
– Search for Synergy Experiments based on Work Order
– System Snippets are available for CRO users
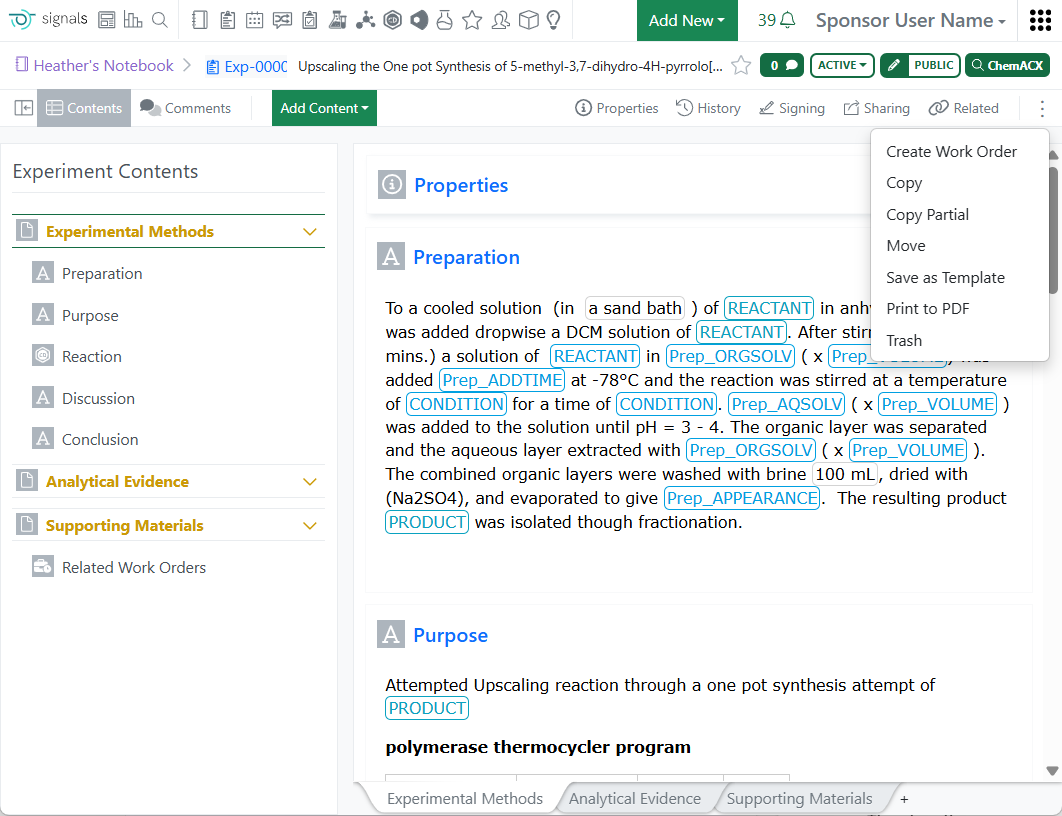
– Work Tasks in Work Orders (beta) - Chemistry
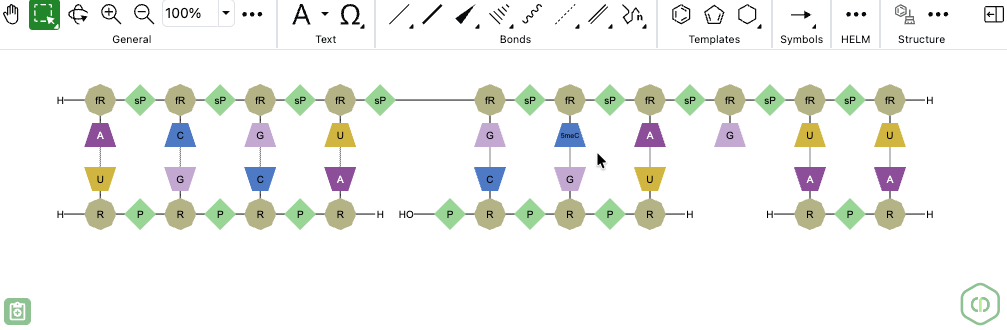
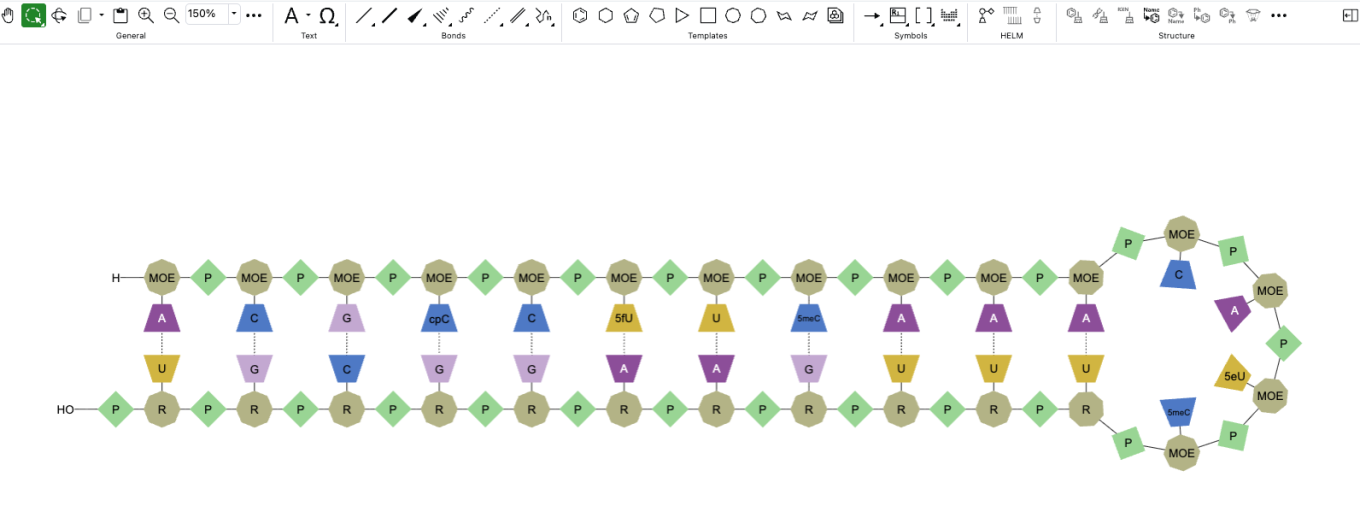
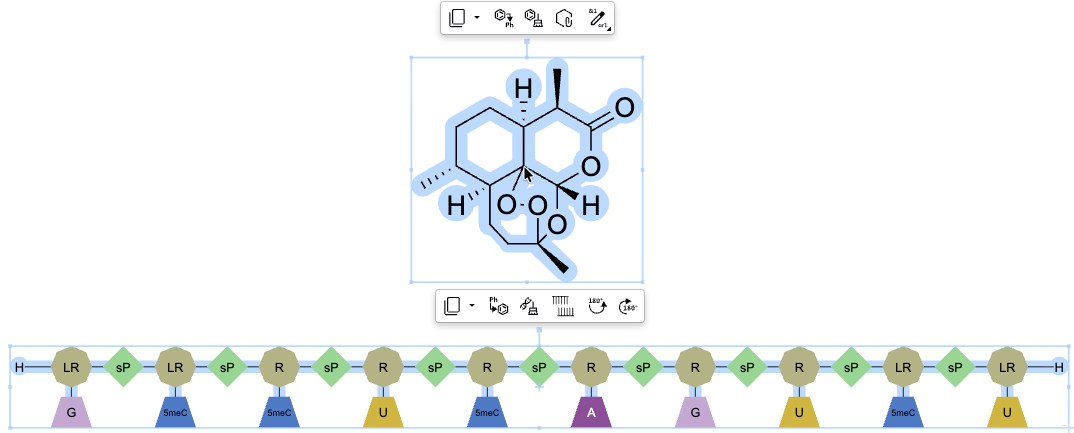
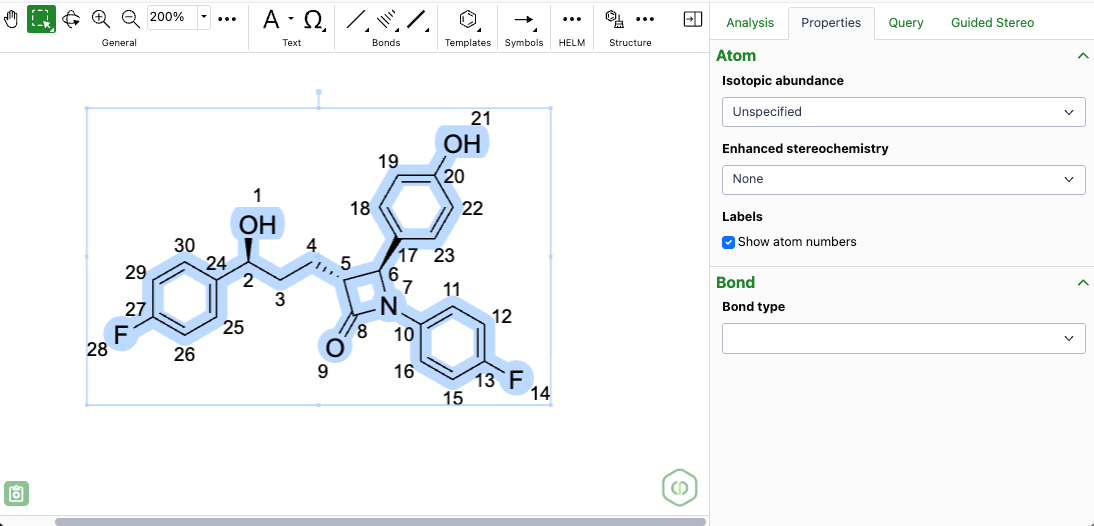
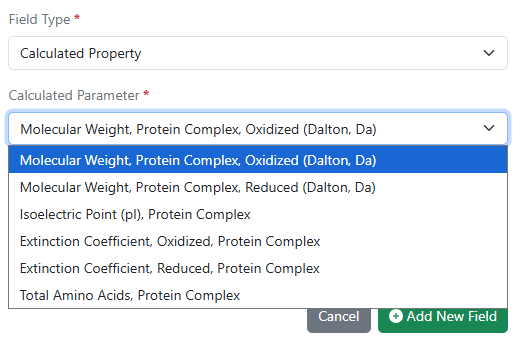
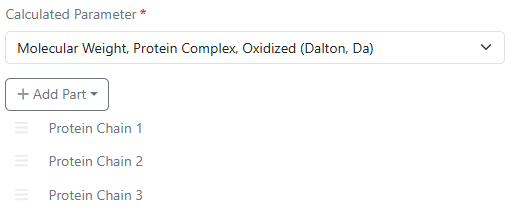
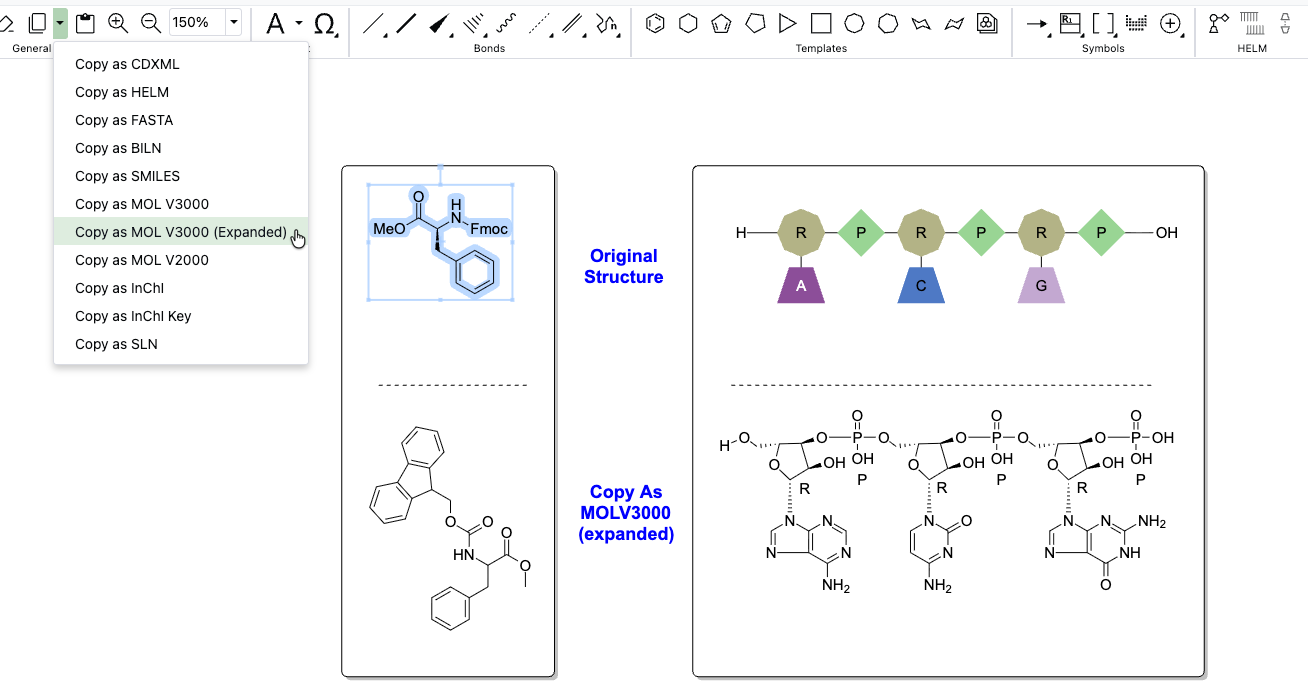
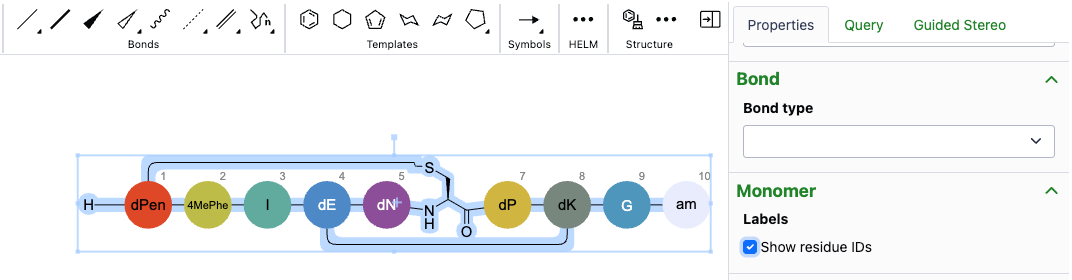
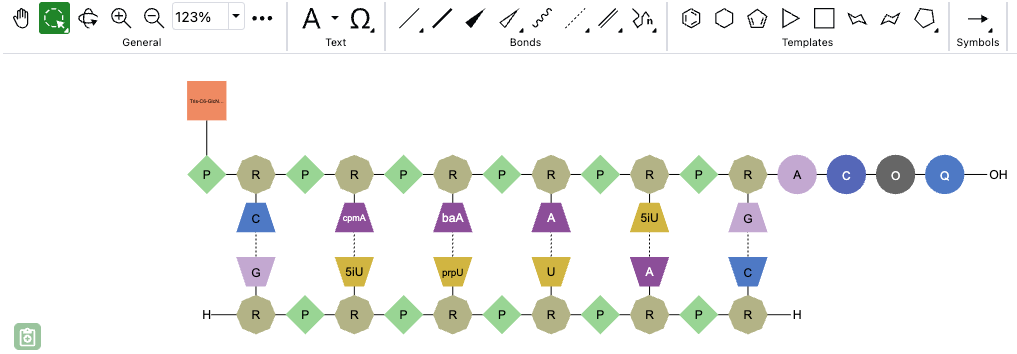
– Multi-strand and branched complex biopolymers now supported
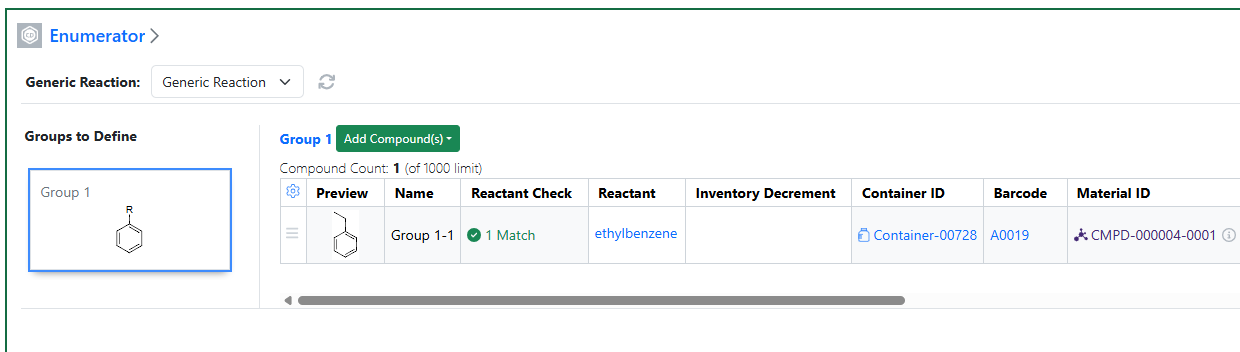
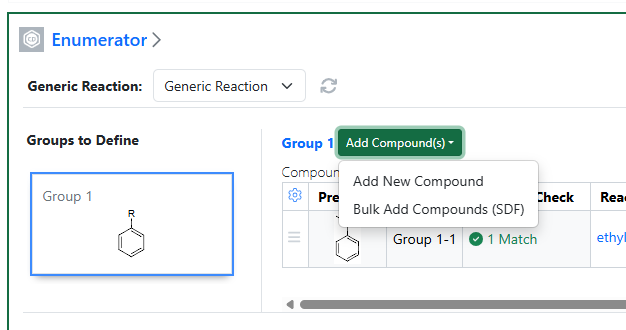
– Upload of rdf file types to External Enumerator - Tables
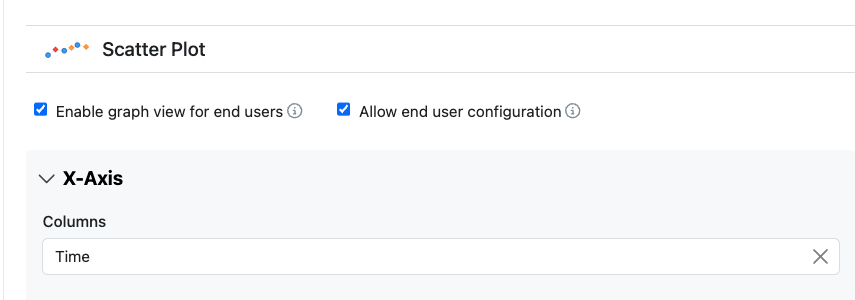
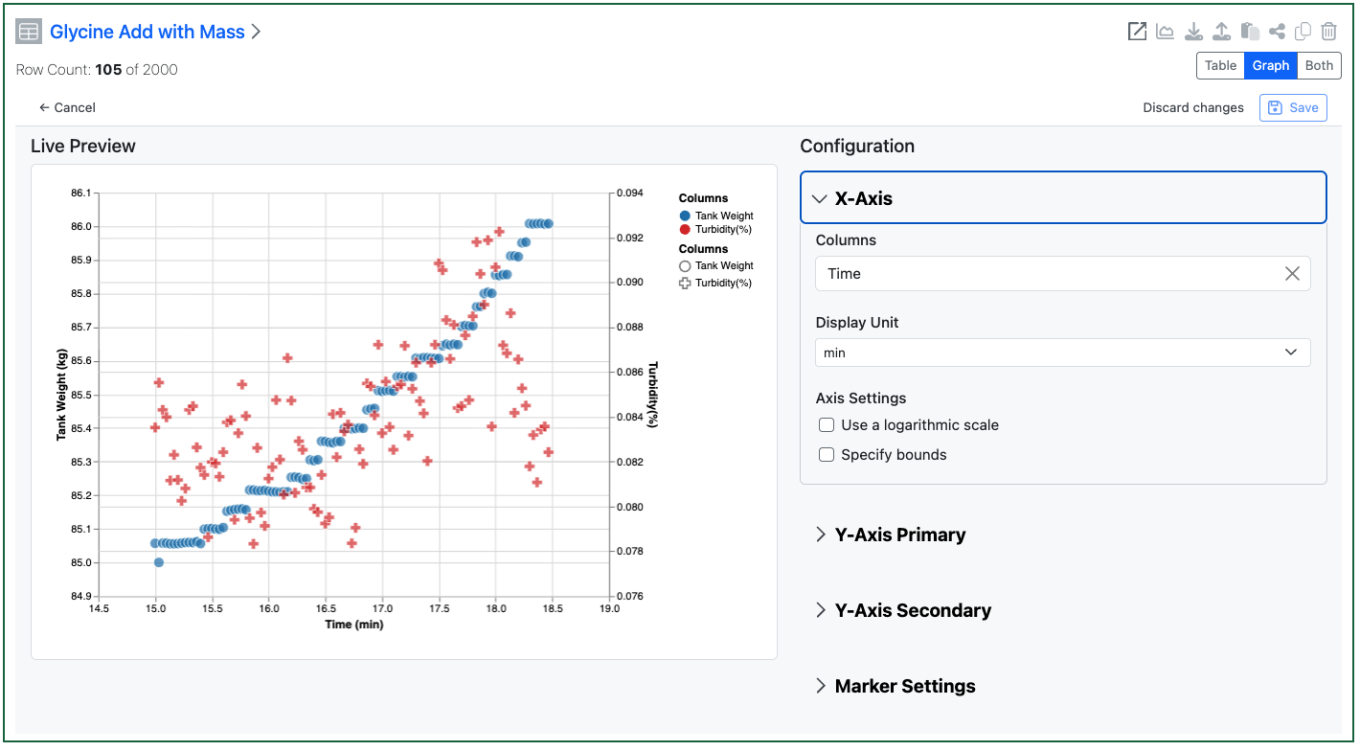
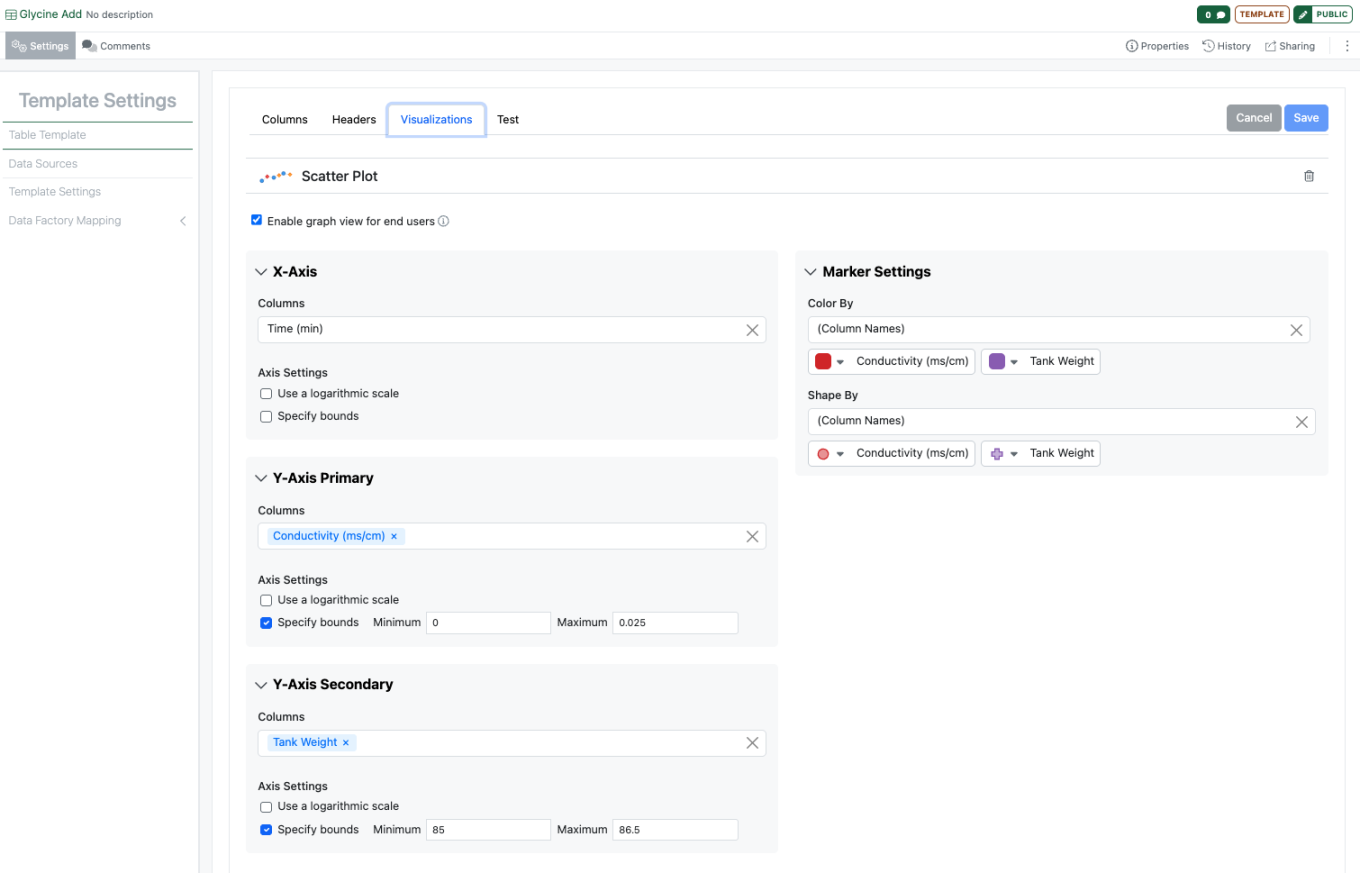
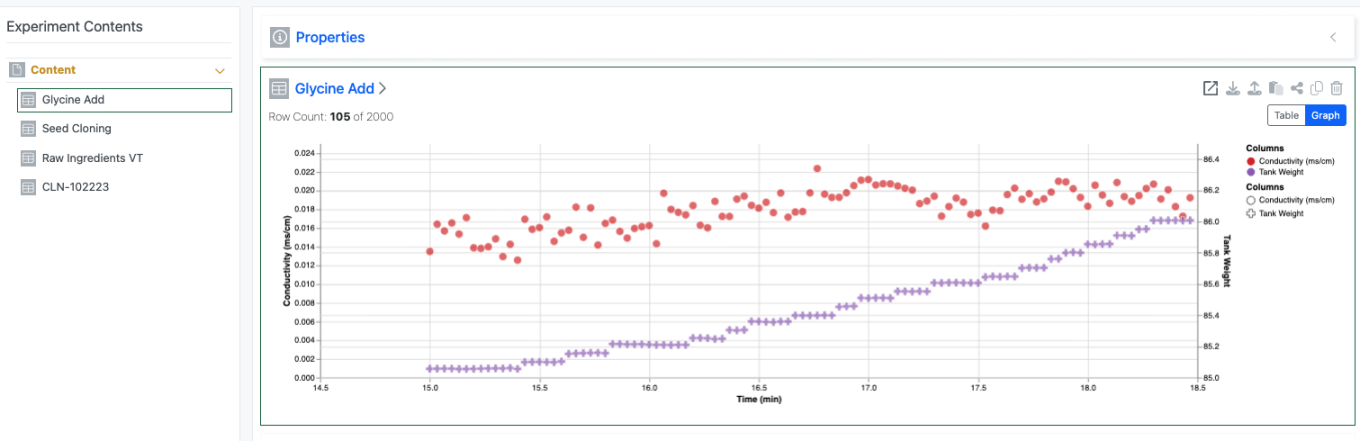
– Definition and display of Scatter Plots on Admin Defined Tables available to all systems*
– End user adjustment of Scatter Plots available to all systems*
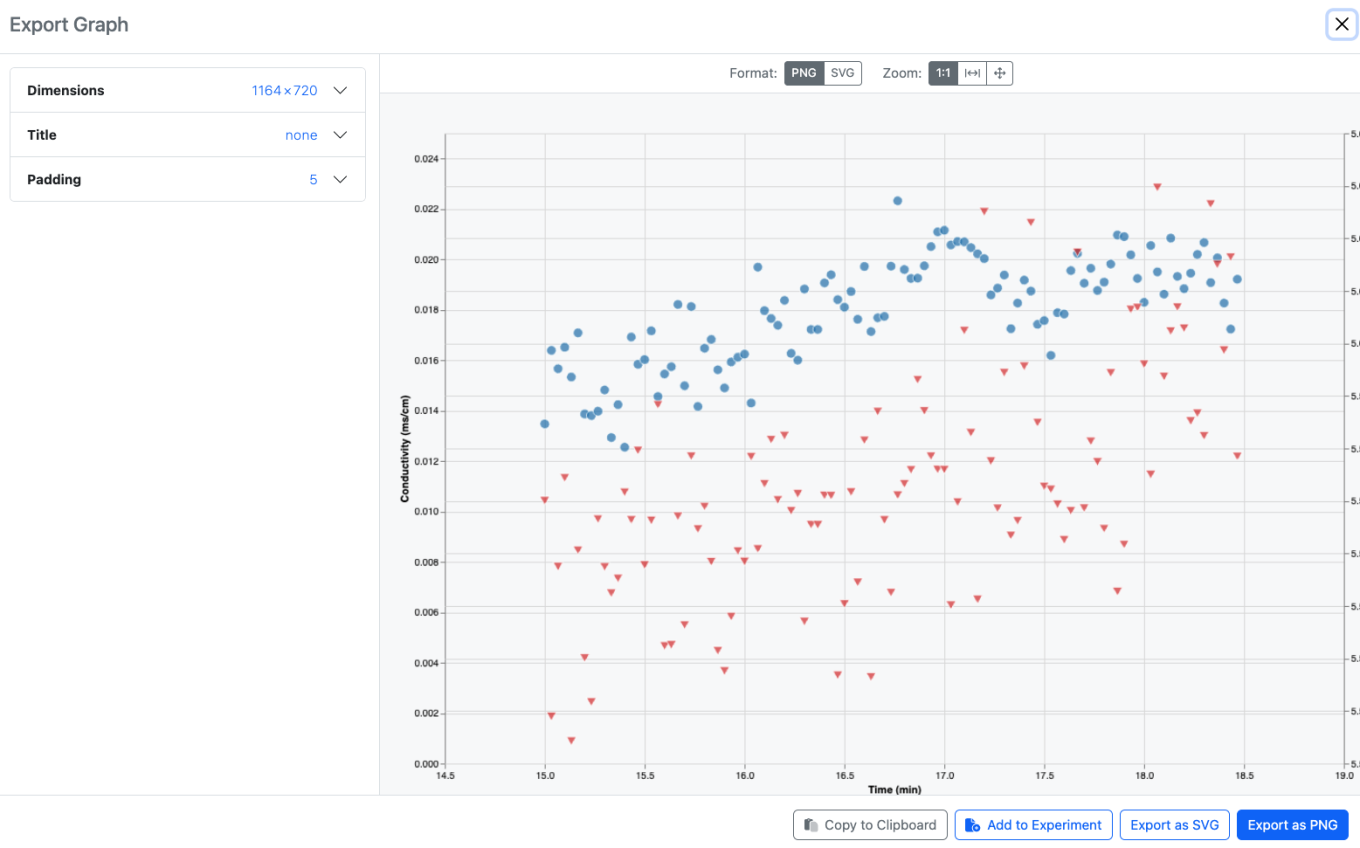
– Export of image from Scatter Plots available to all systems*
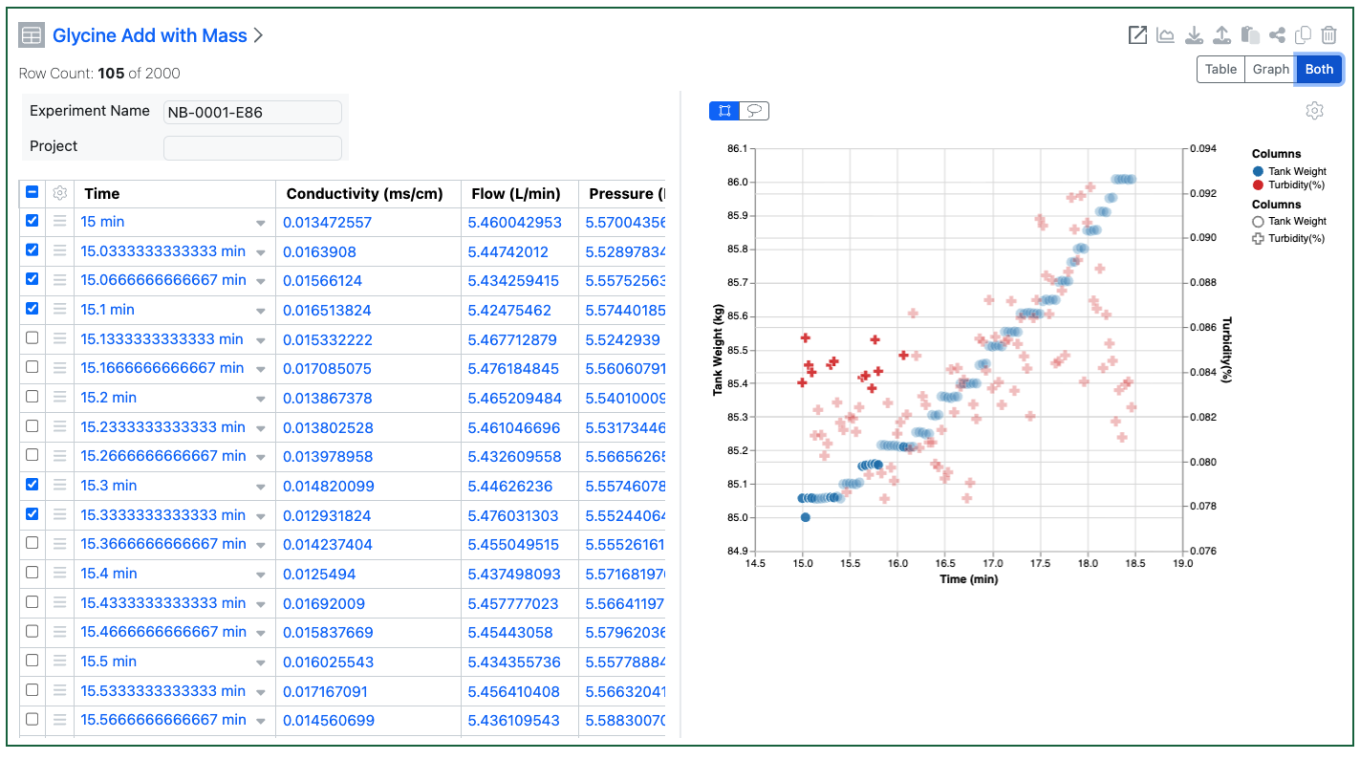
– Highlight selected rows or points in the Scatter Plot and Table available to all systems*
– Definition and display of Bar Charts on Admin Defined Tables*
– Define and display Size By and Transparency on Scatter Plot to enable Bubble Charts on Admin Defined Tables* - Inventory
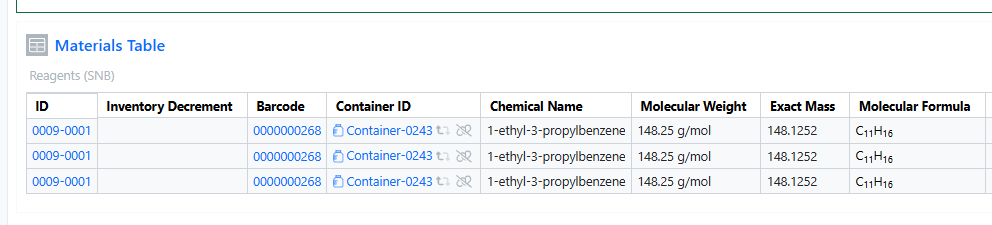
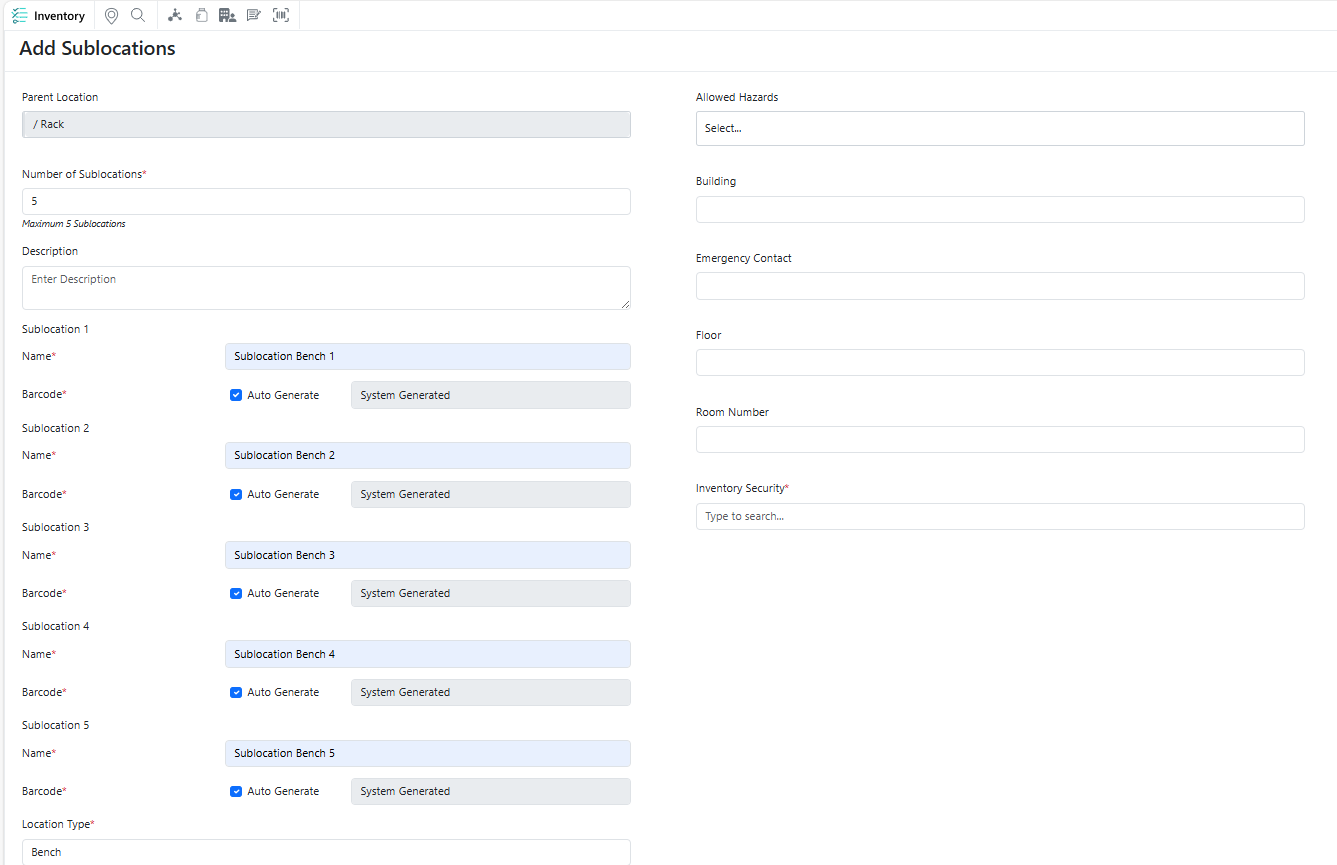
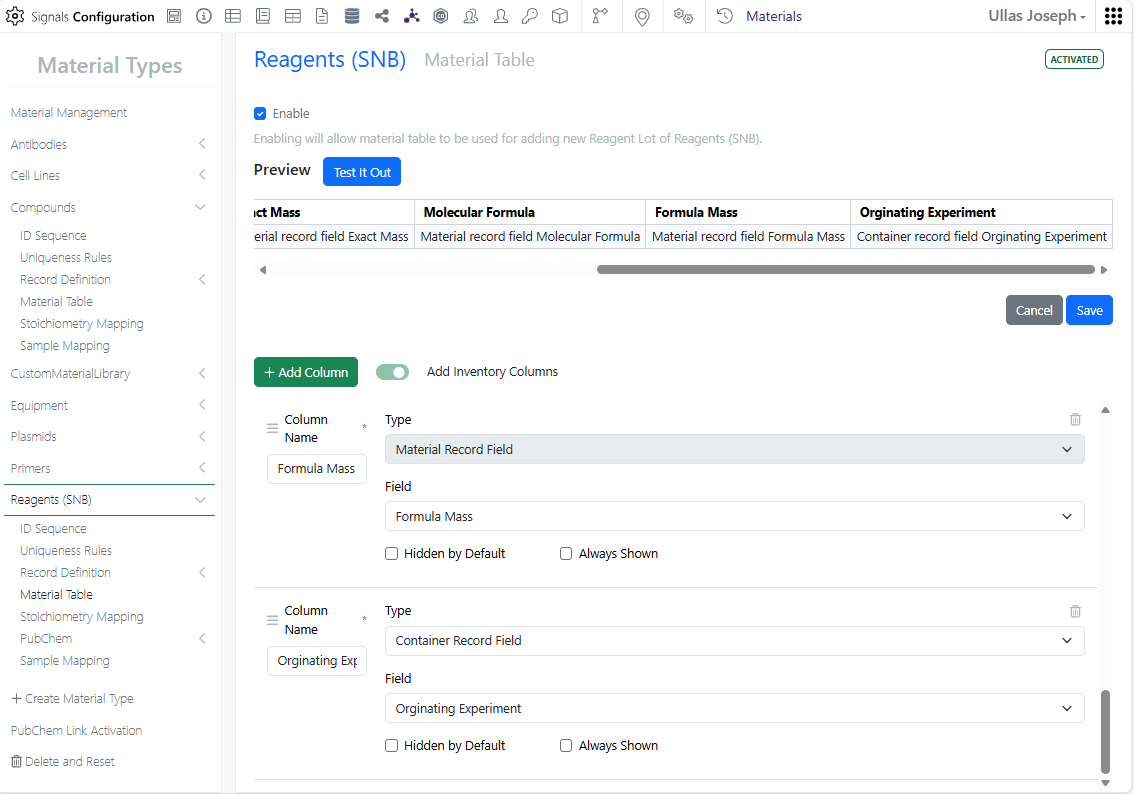
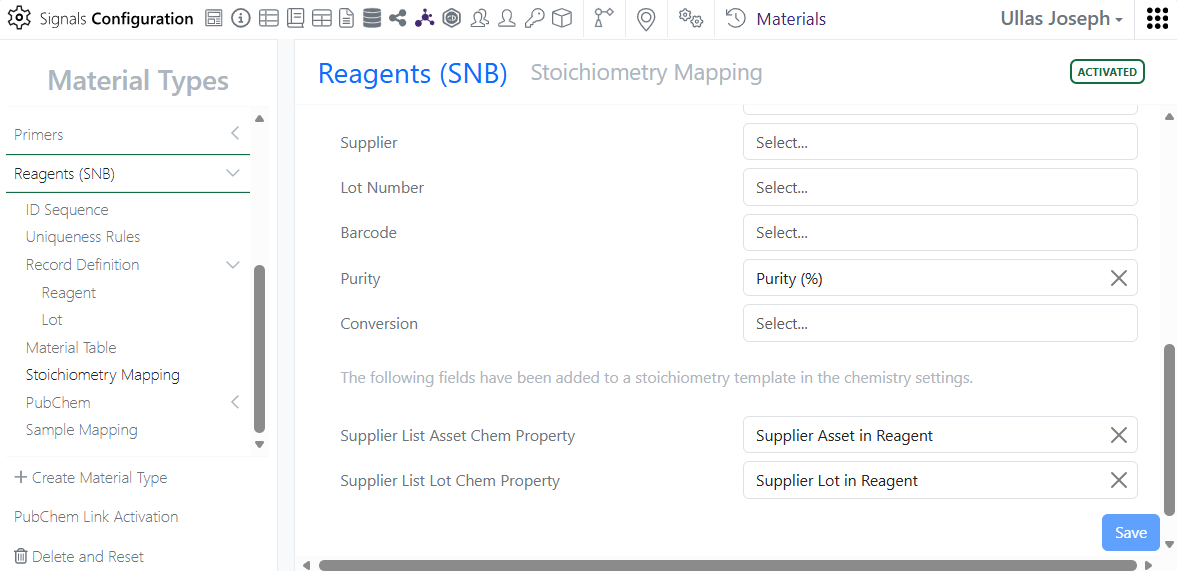
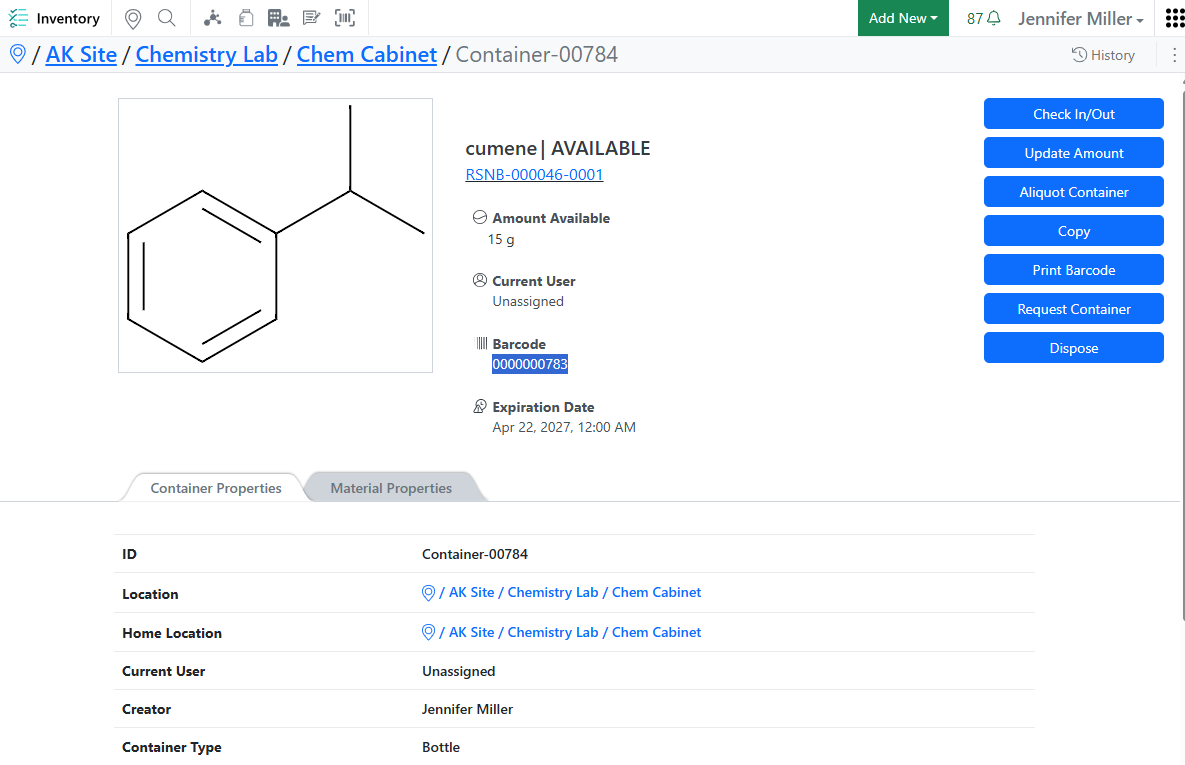
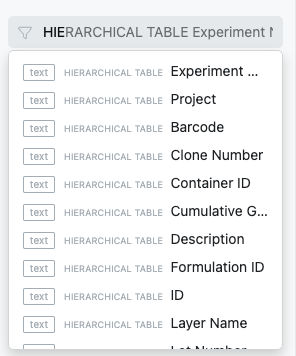
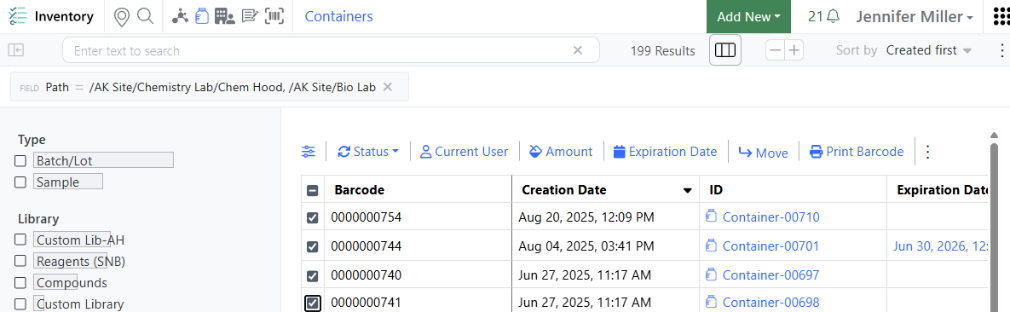
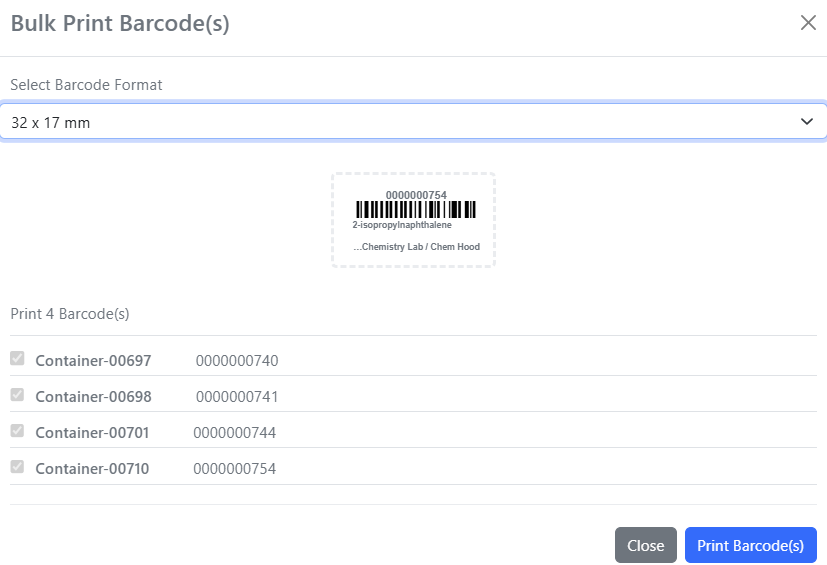
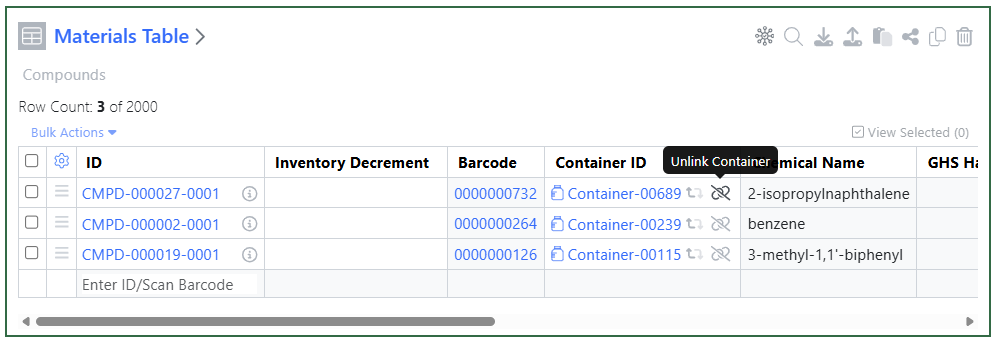
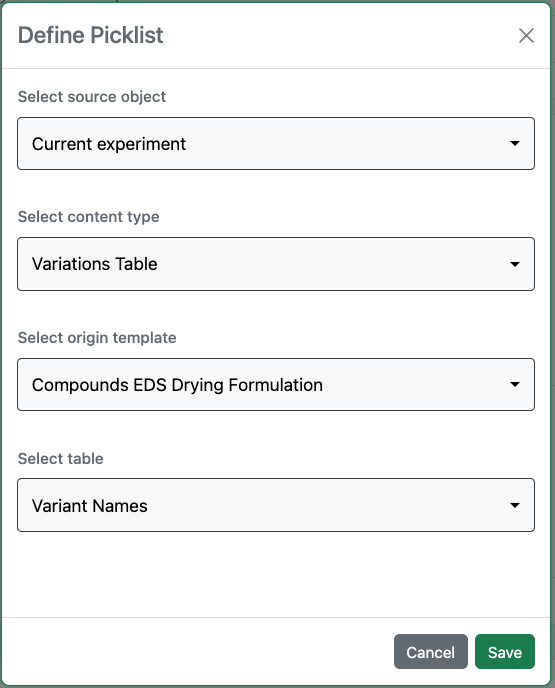
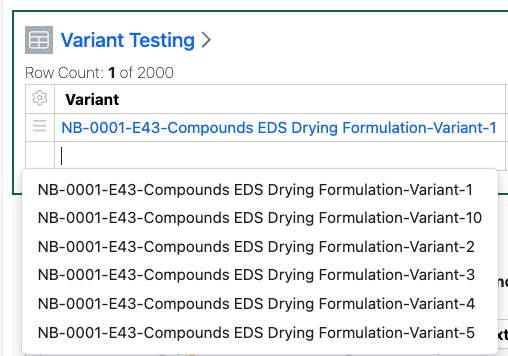
– Enable container ID and barcode selection directly within Reagent tables
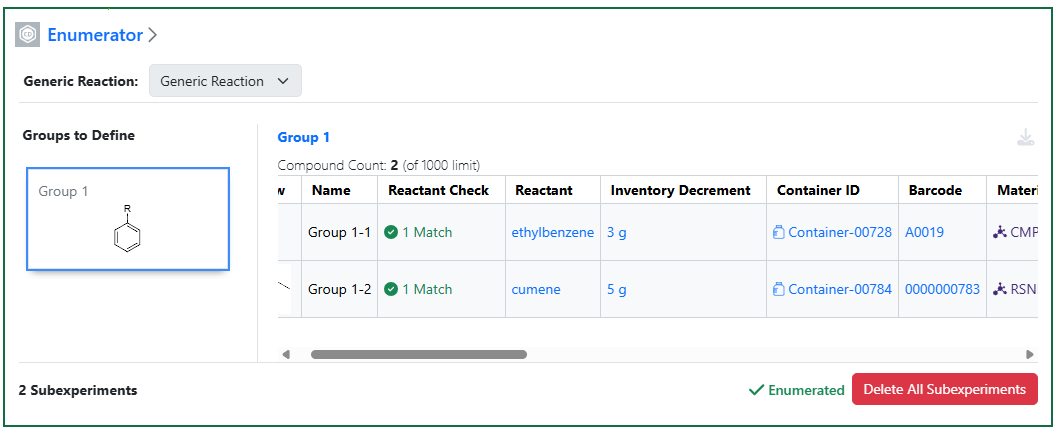
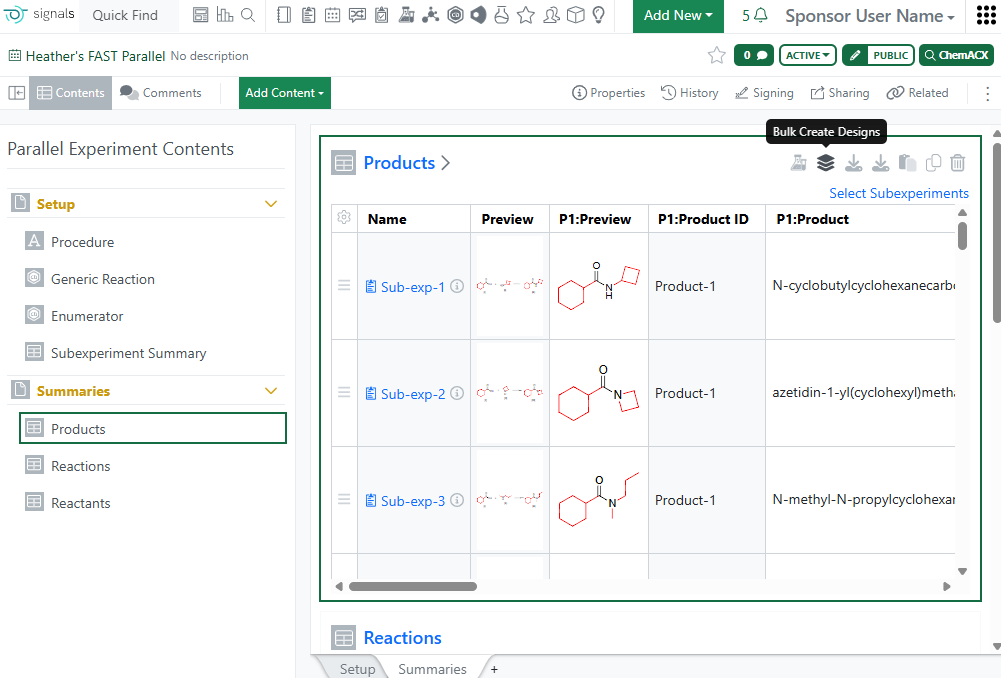
– Support Inventory Decrement at Sub‑Experiment Level in Parallel Experiments
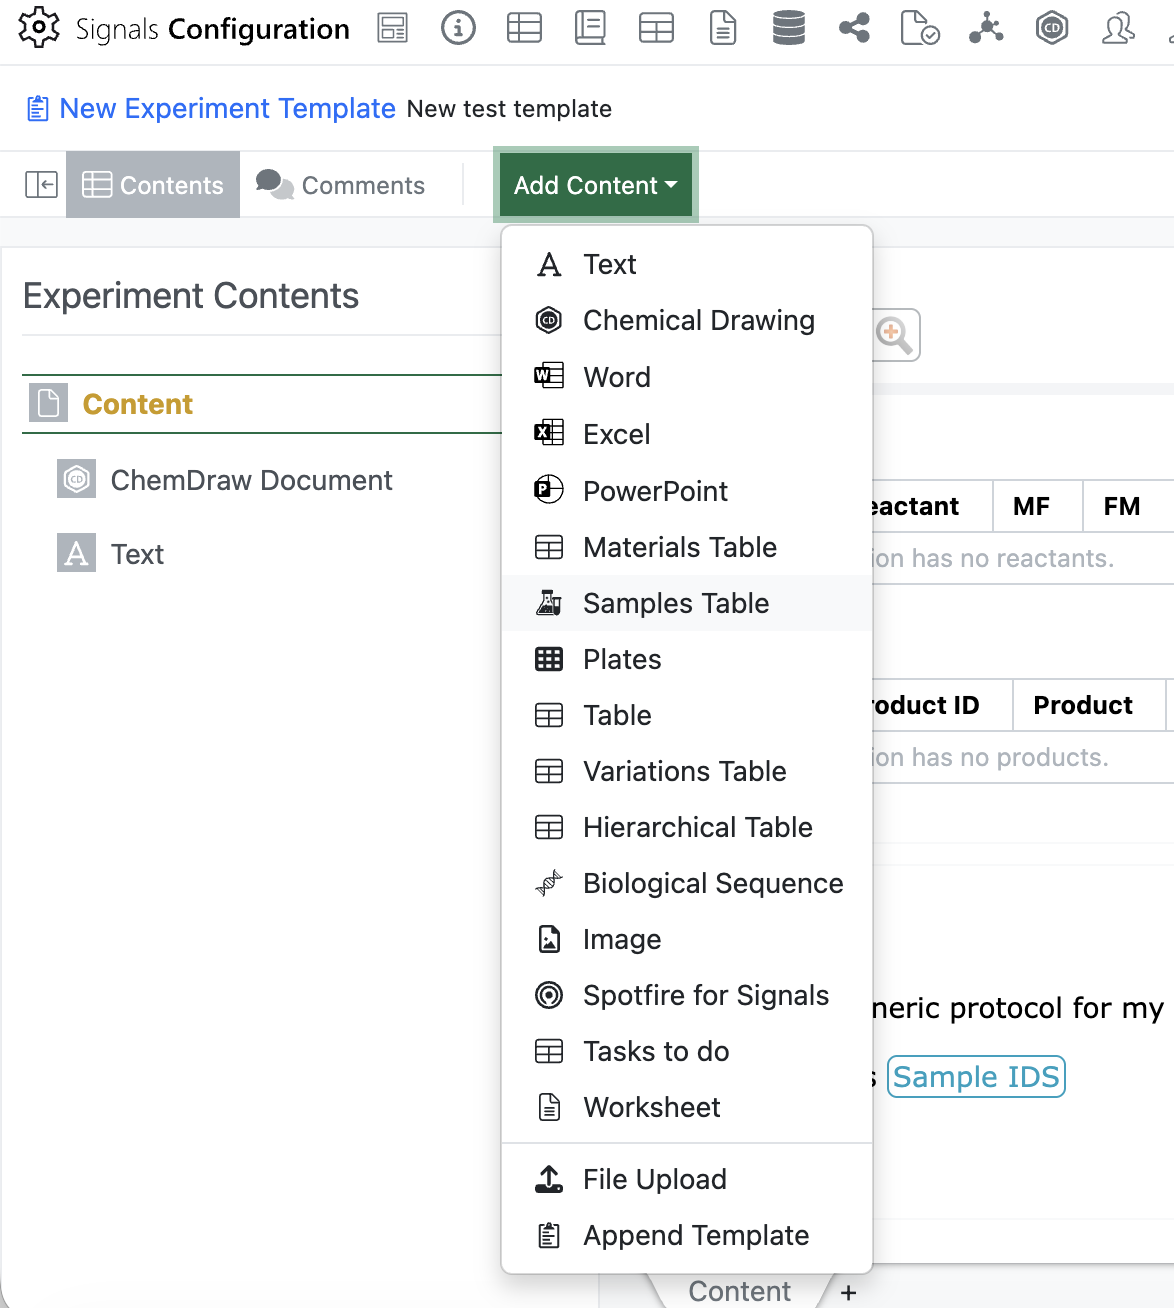
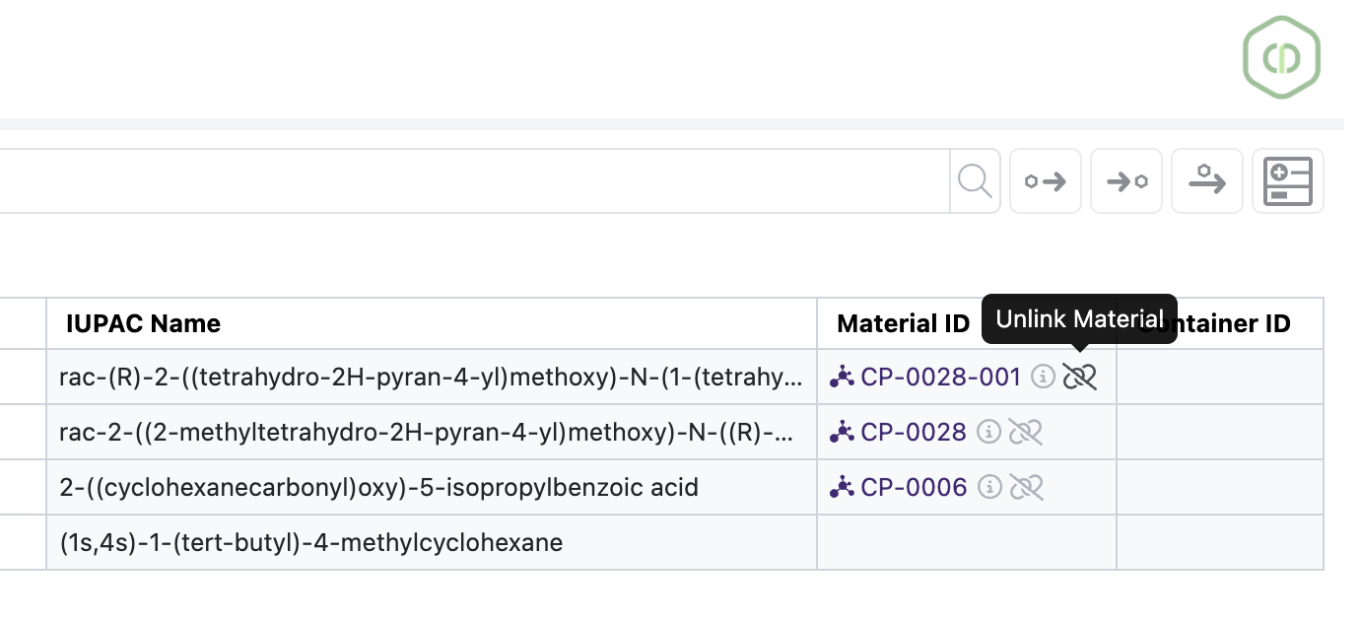
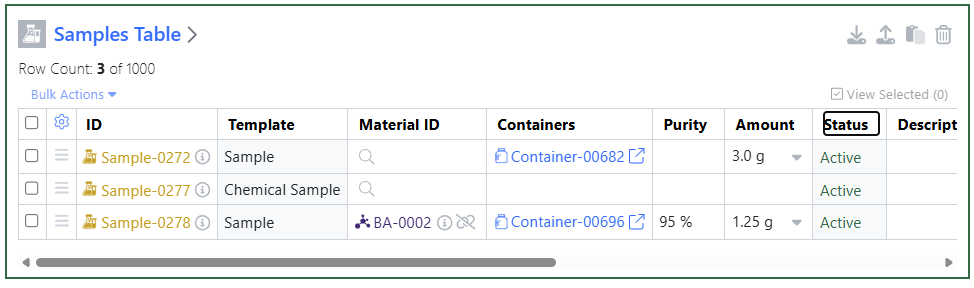
– Display container details in Samples table when Material ID is present
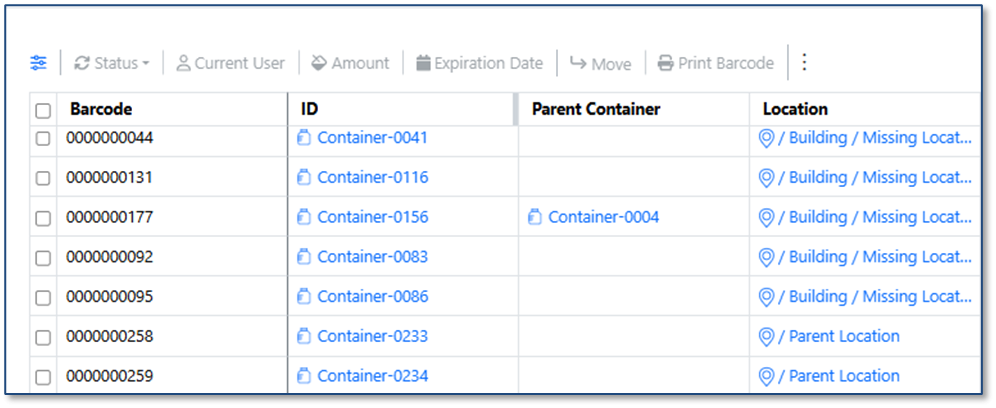
– Multi Select property display in the Container search table - InventoryGo‡
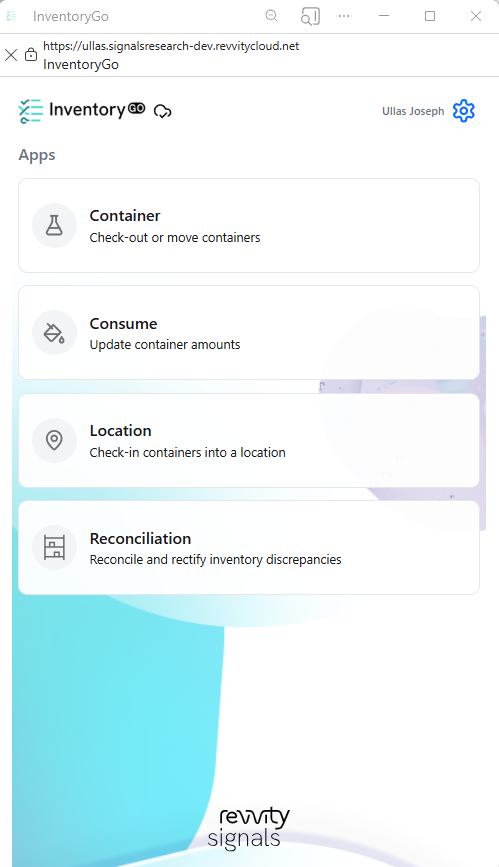
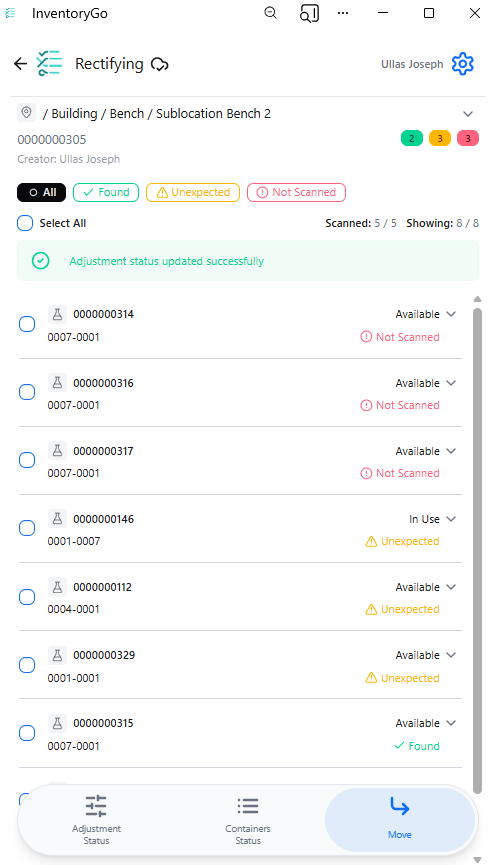
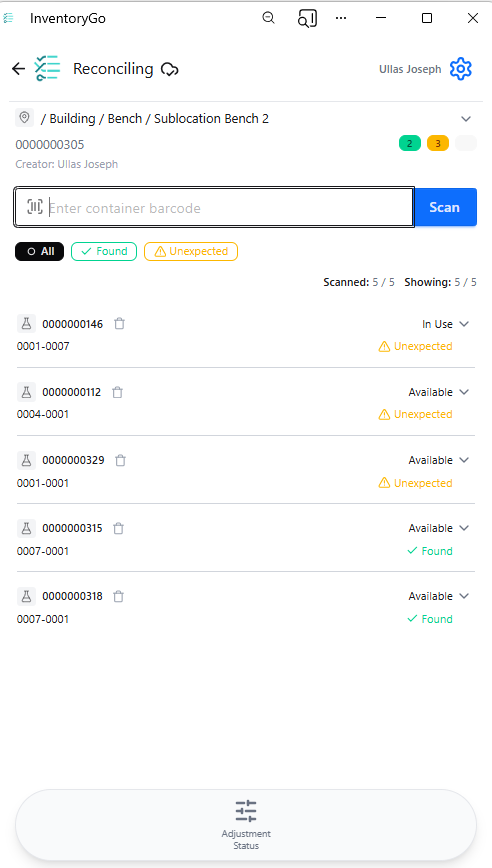
– Flexible reconciliation workflows introduced: Batch vs. Individual scanning options - Administration
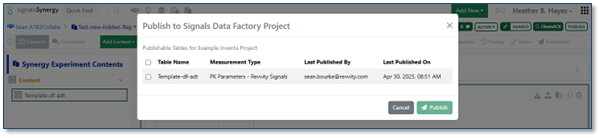
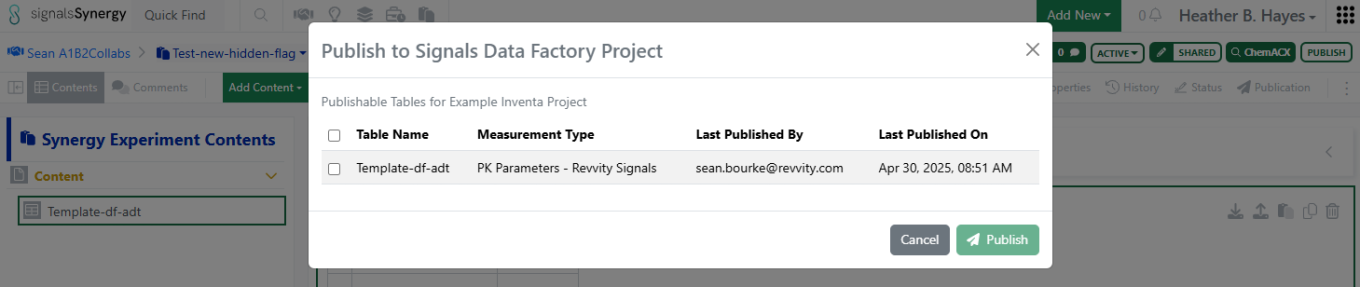
– Migration for legacy Data Factory projects
– Spotfire for Signals Online Access privilege available
– Admin Defined Dashboards
– Audit trail displays highlighted granular changes for admin-defined tables (beta) - Integrations & Interfaces
– Ontology API Support
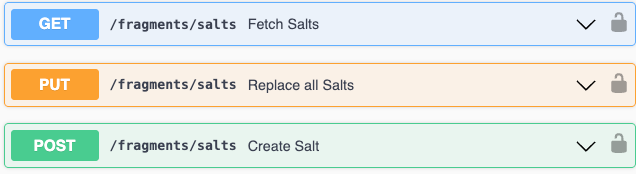
– Salt Stripping Data for Chemical Drawings fetch API
– Entity properties on Bulk Export API
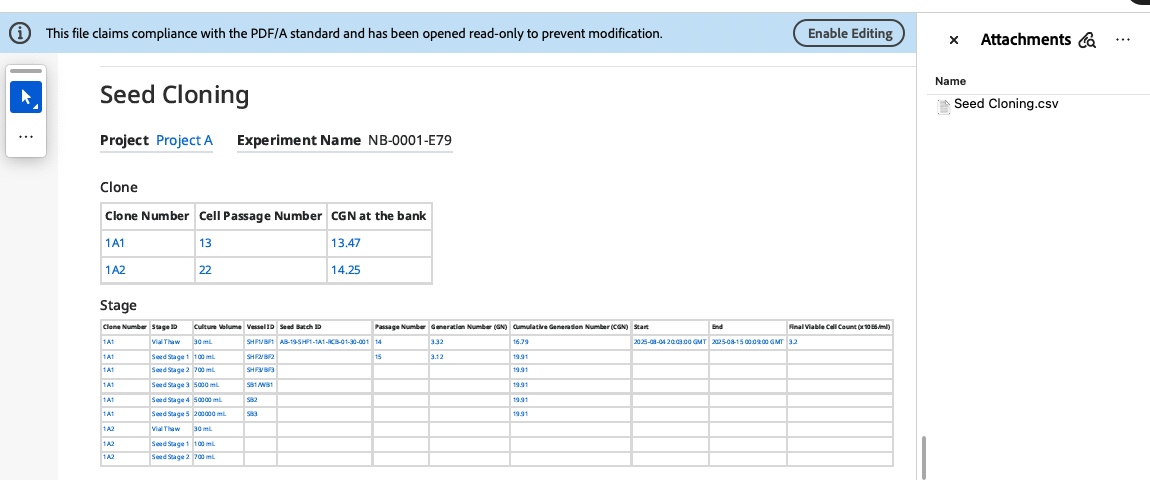
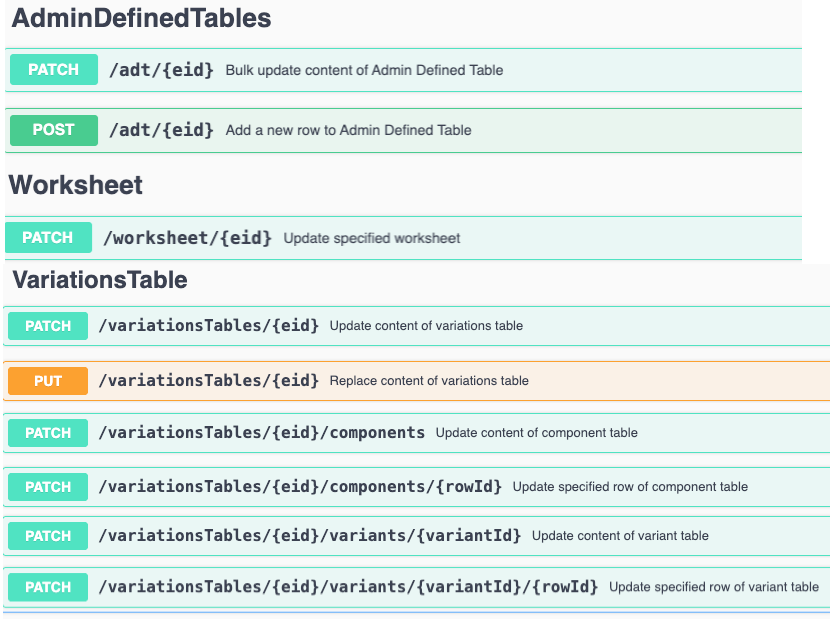
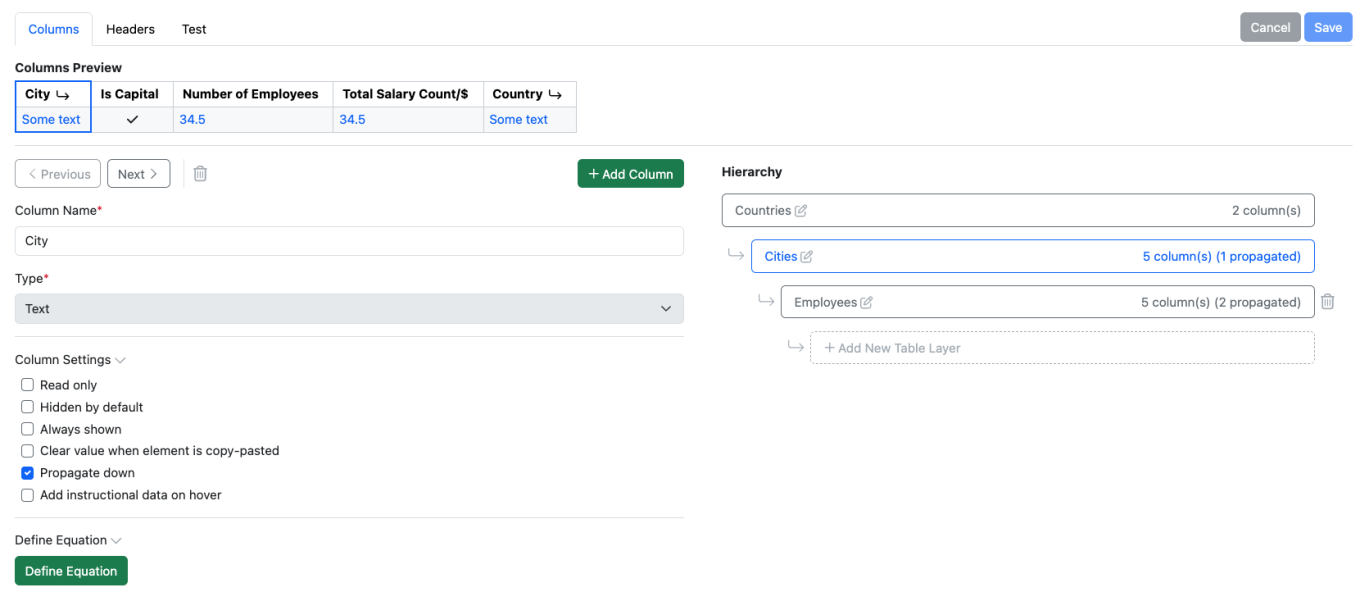
– Update Hierarchical Tables Headers API
– External Enumerator via API
– Bulk create Samples via Summary Table via API
* Requires Signals One license
† Requires Signals Synergy license
‡ Requires InventoryGo license
We also fixed several small bugs in this release. Details of the enhancements are described below.
Administrators are recommended to subscribe to the channels within our support news site found at https://support.revvitysignals.com/hc/en-us/categories/360004446171-Support-News which contains more information about releases and other pertinent product information.
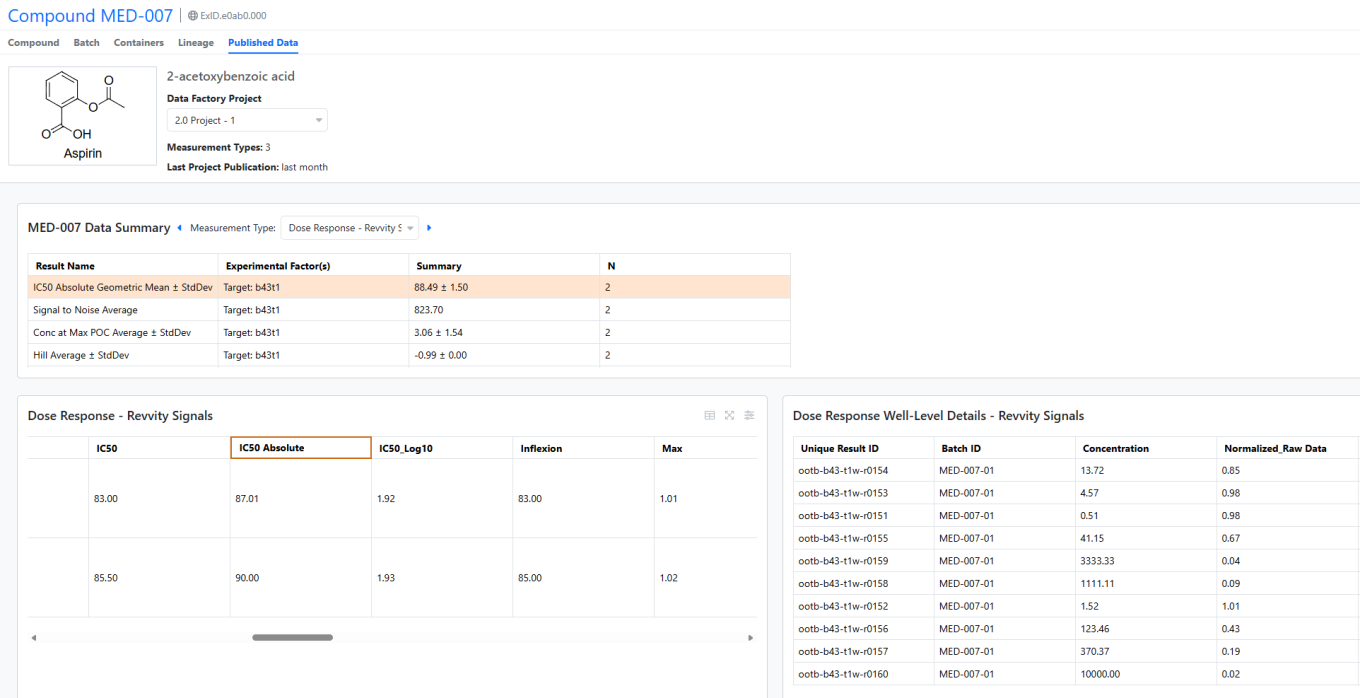
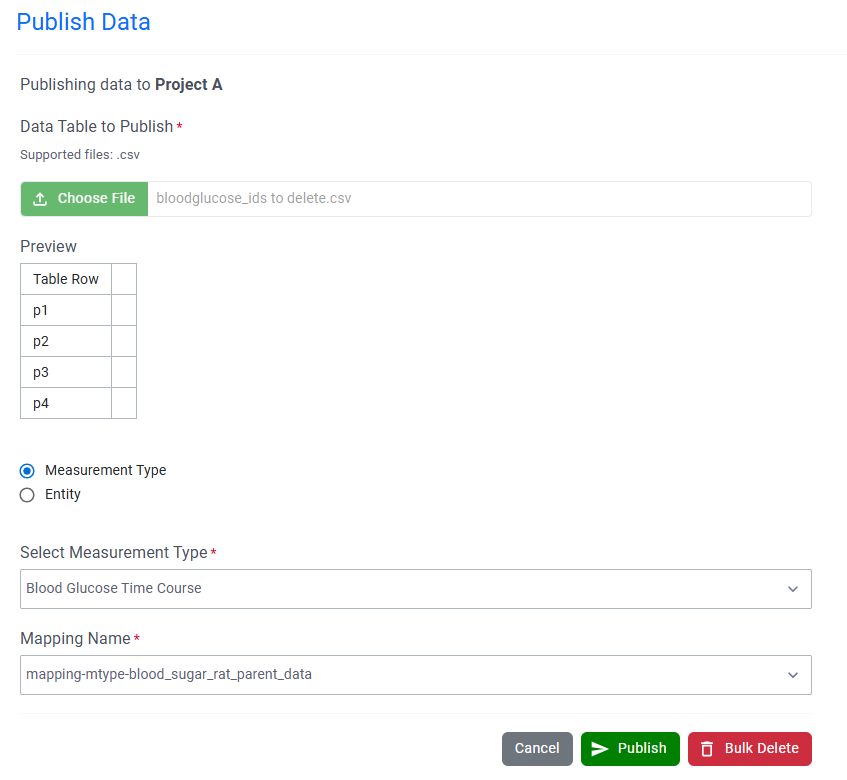
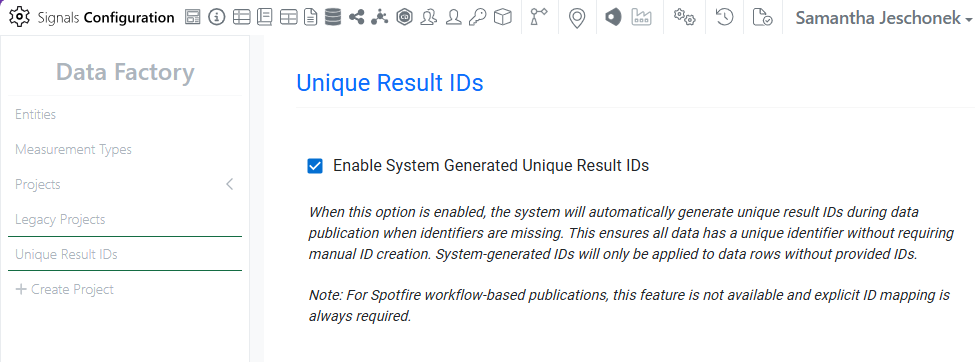
Data Factory administrators should be aware that the Bulk Delete option from the Inventa Dashboard is now available regardless of the “Enable system-generated Unique Result IDs in Spotfire workflows” setting. However, Using Bulk Delete still requires explicit mapping of a Unique Result ID.
Data Factory Administrators should note that legacy Data Factory projects will be fully deprecated in a future release. A straightforward migration path is now available to support this transition. A specific deadline has not yet been scheduled.
Data Factory administrators should also note that the Advanced Security policies in Inventa apply an “AND” logic across all user groups, restricting access if any groups lack permissions. This behavior differs from the standard Signals security model and will be fixed to align with the standard in a future release.
This content is anticipated for release on our Production E3 environments, and for Private Cloud customers on our deferred release schedule, in November 2026.
Further Details
The following improvements are available for users, administrators and developers on the Signals platform. Certain features may only be available with appropriate licensing and/or with enablement by an administrator.
Fundamentals
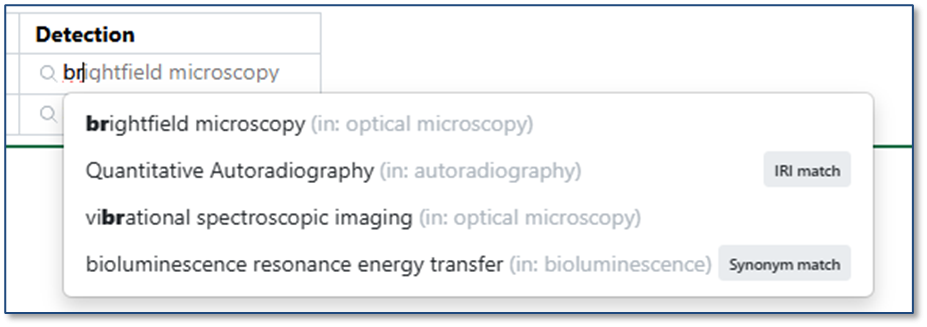
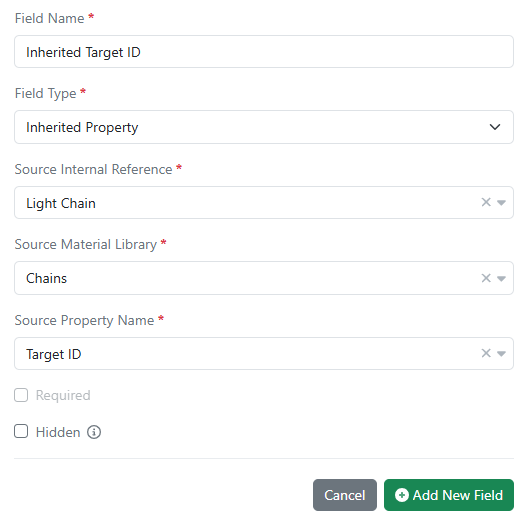
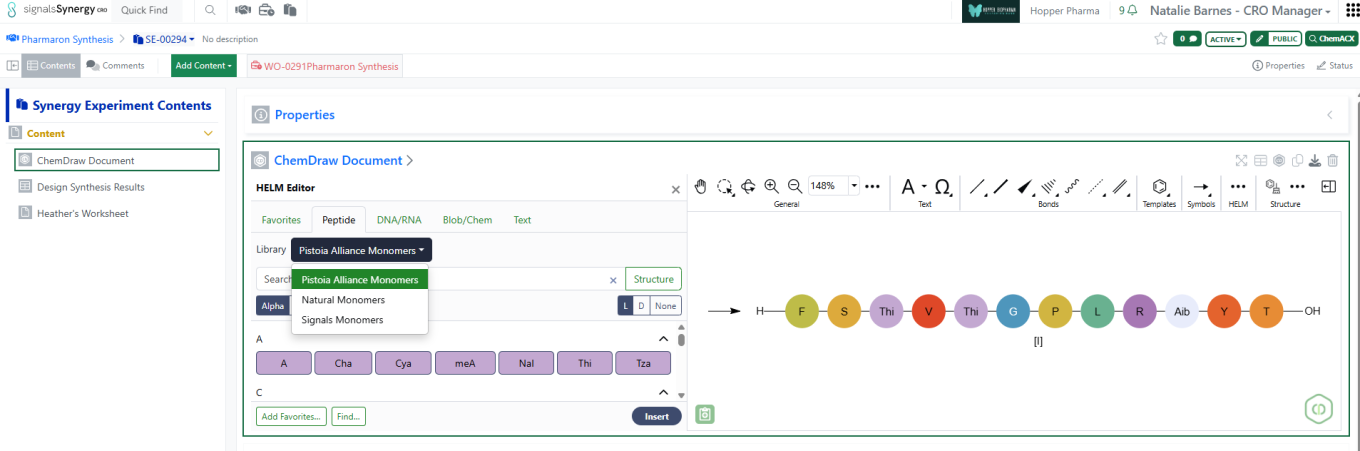
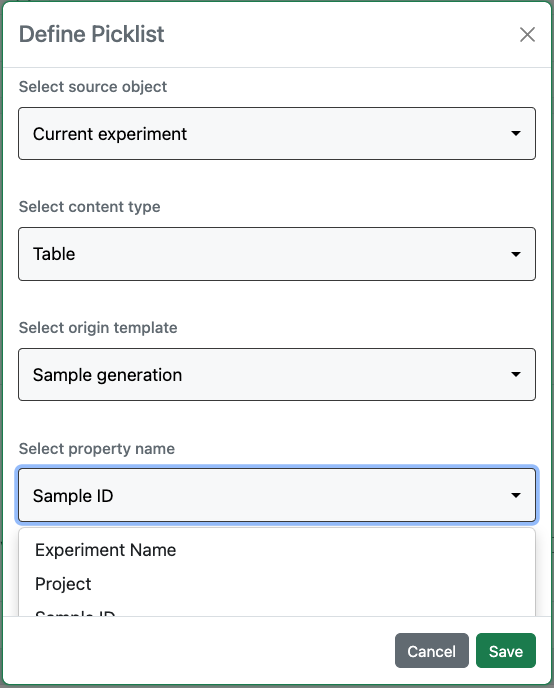
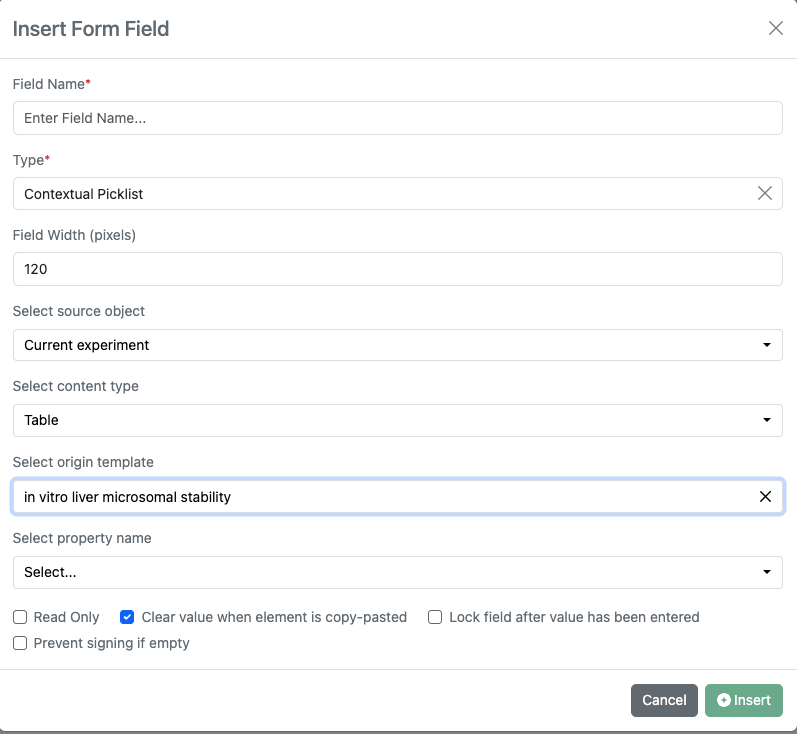
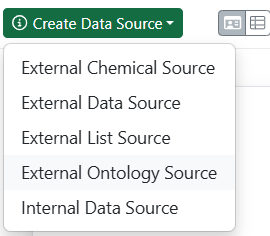
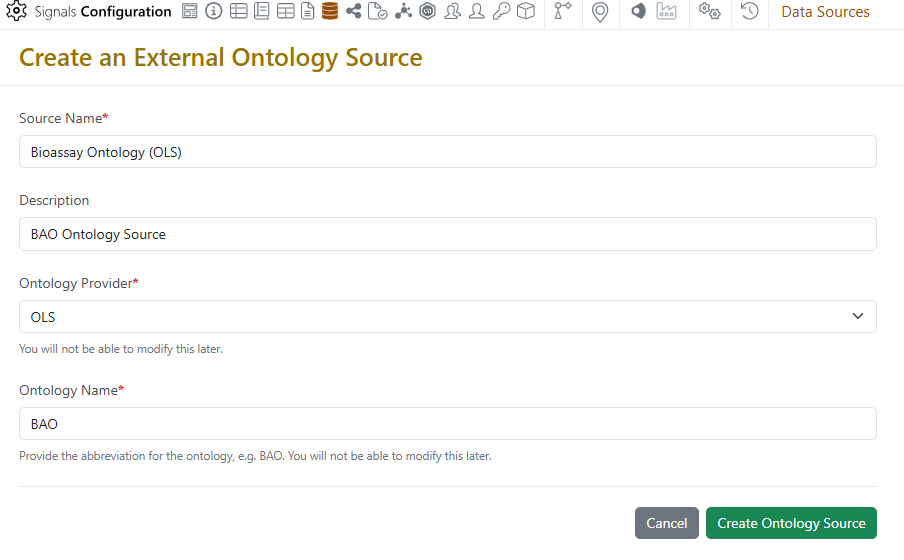
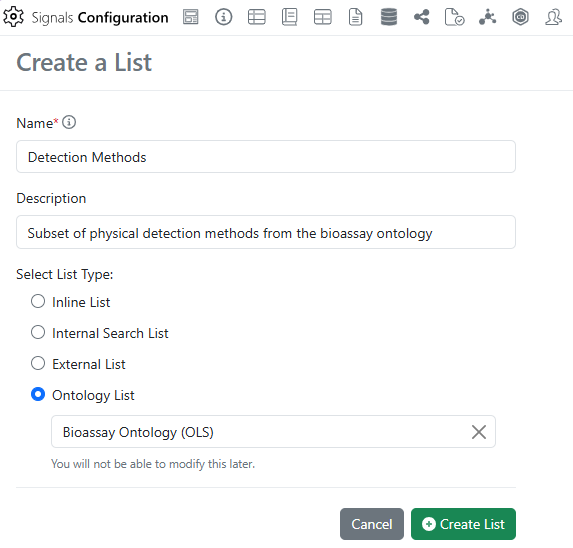
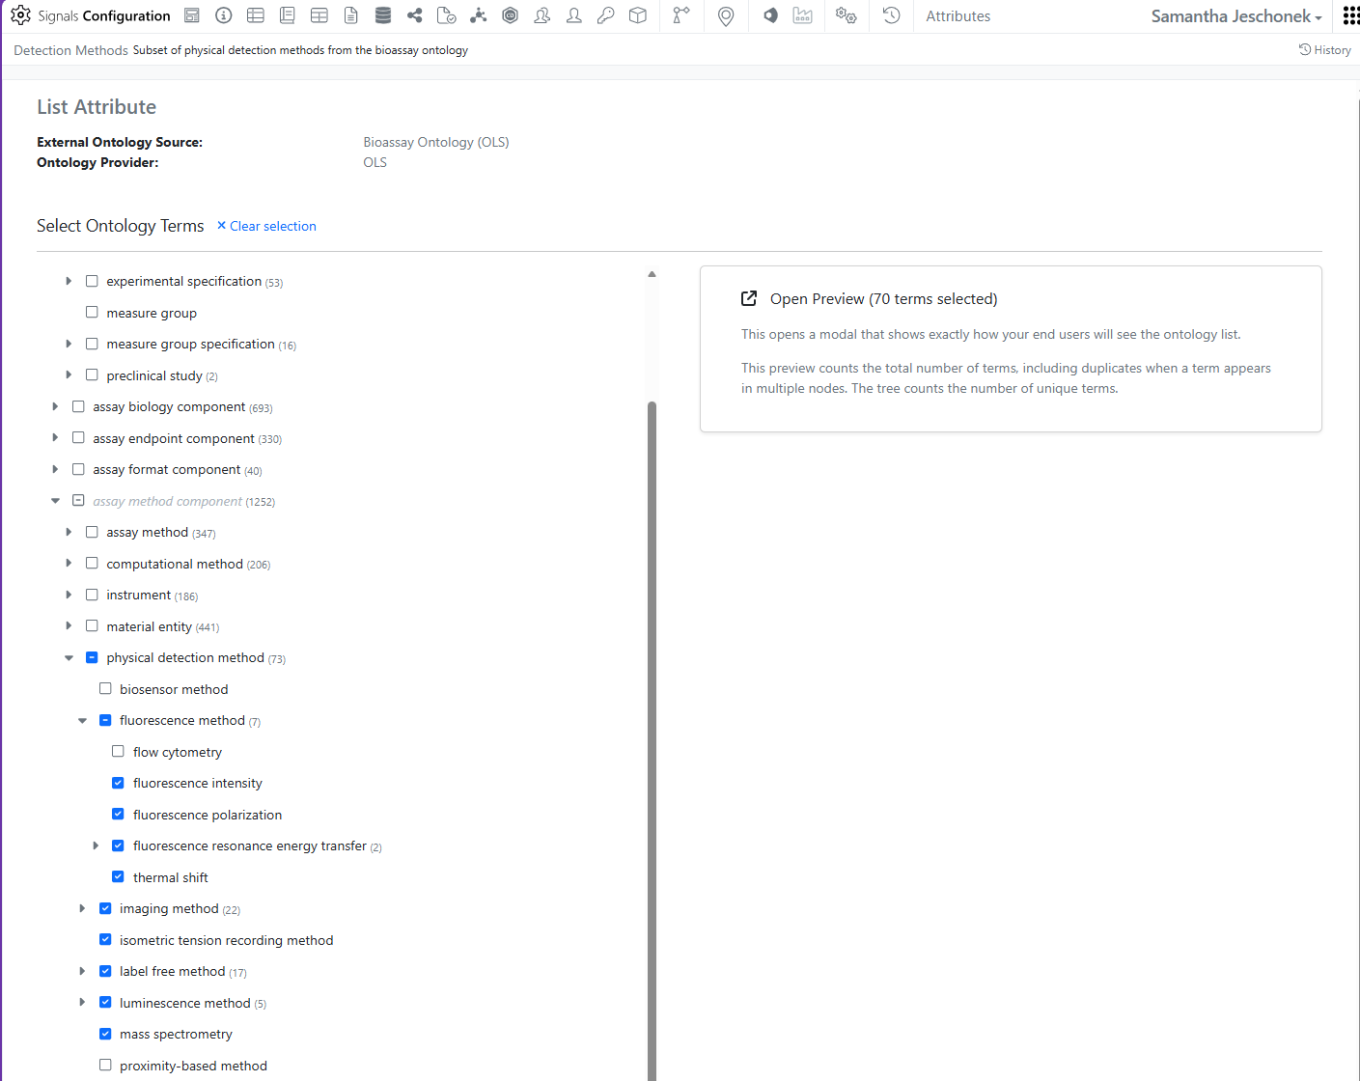
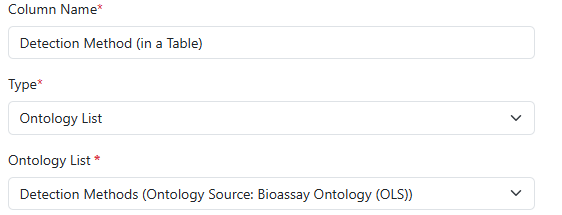
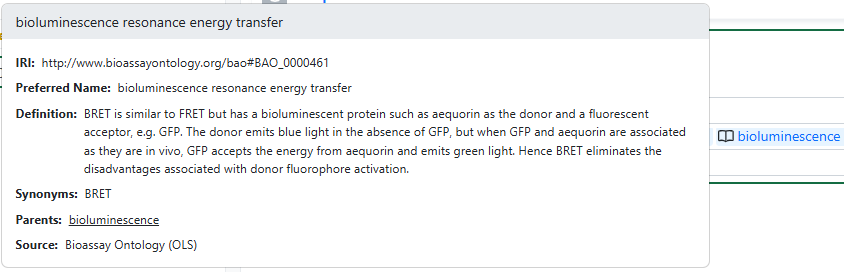
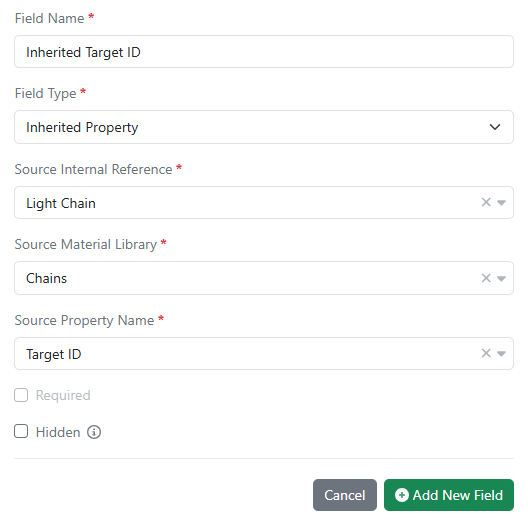
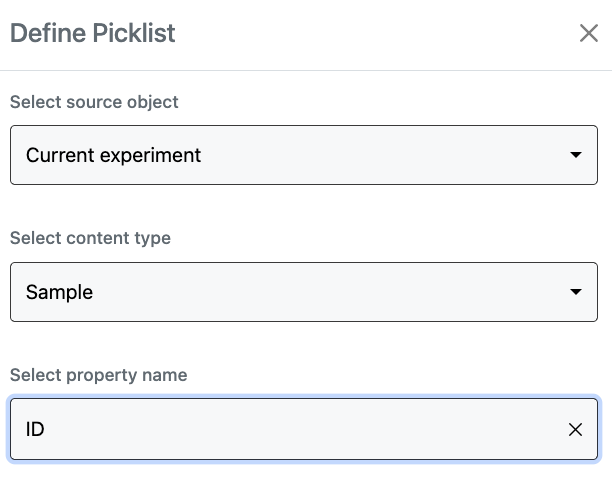
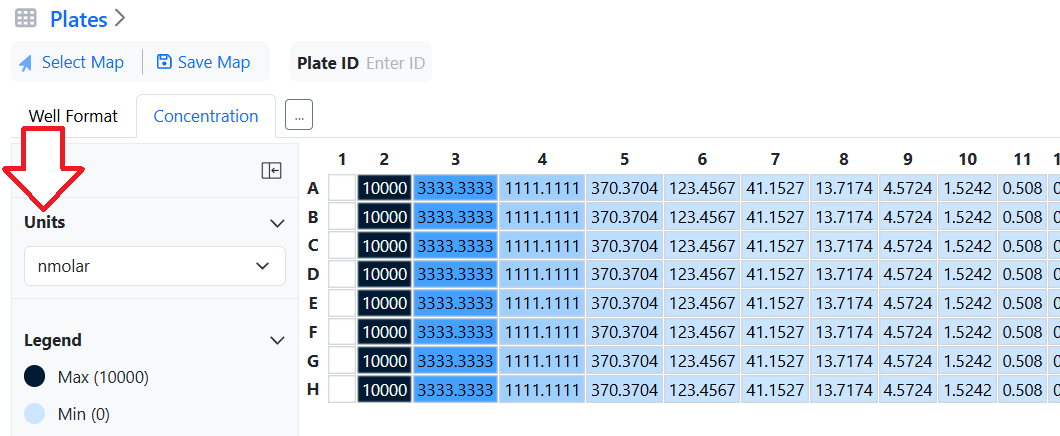
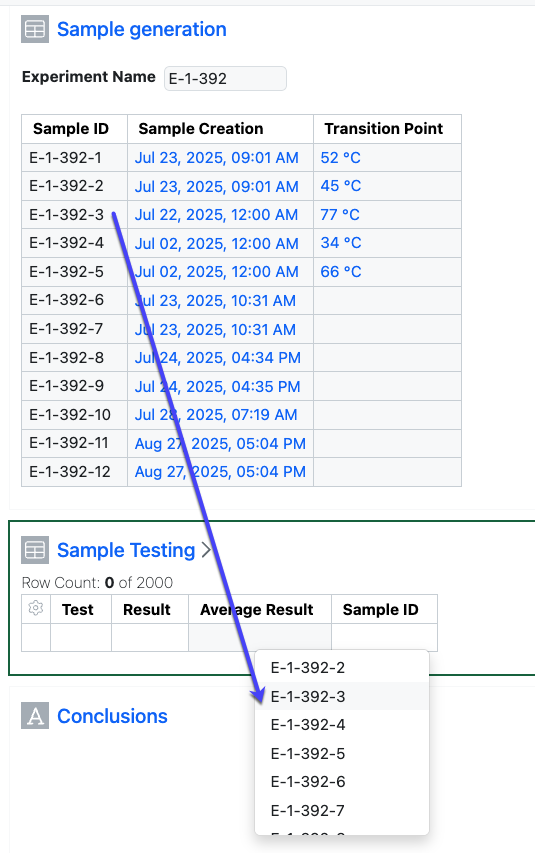
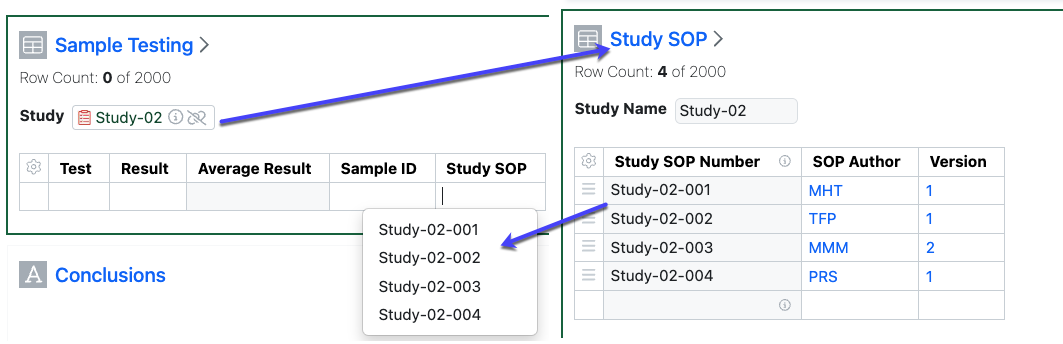
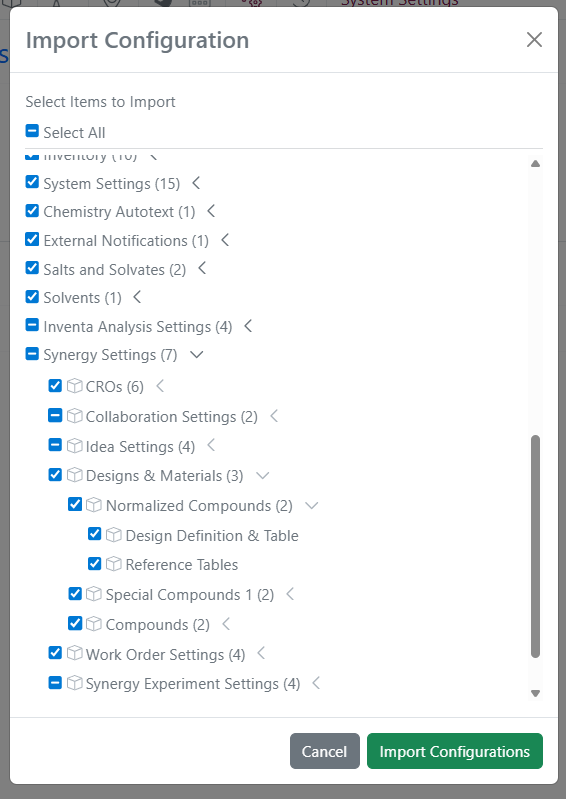
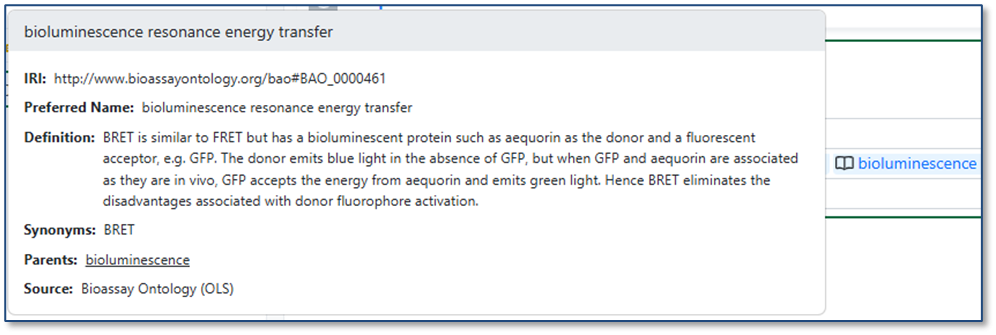
Ontology support is now available for all systems. Administrators may connect to a ontology provider (BioPortal, OLS, or SciBite CENtree) as an External Ontology. Once a specific ontology from that source is connected, Administrators can create a new type of Attribute, Ontology Lists, which contain a subset of terms from the ontology. This Ontology List can be used in templates and properties across signals, including Experiments, Materials, Tables, Samples, Admin Defined Objects, Plates, Inventa Analyses (for Signals One), Synergy Experiments and Design/Reference Tables, and more.
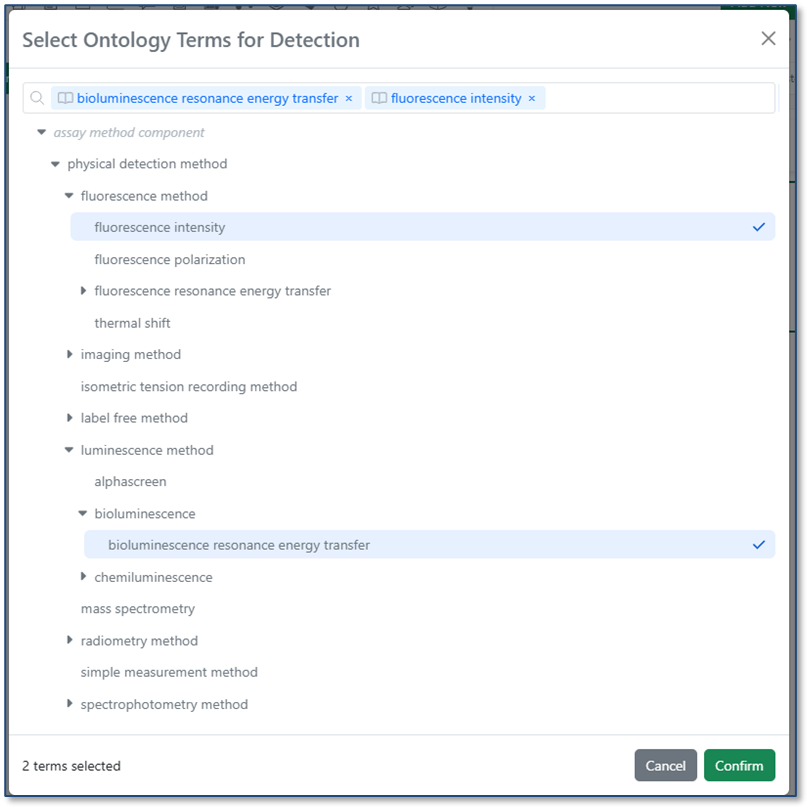

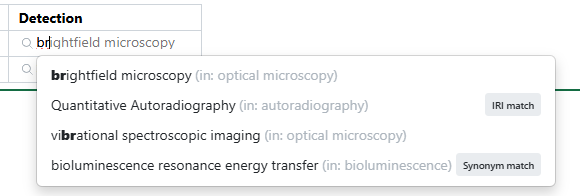
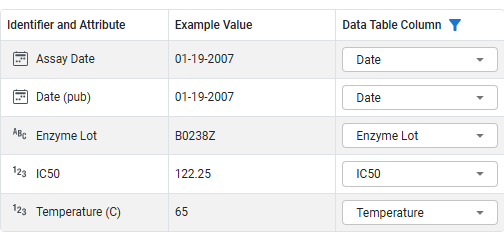
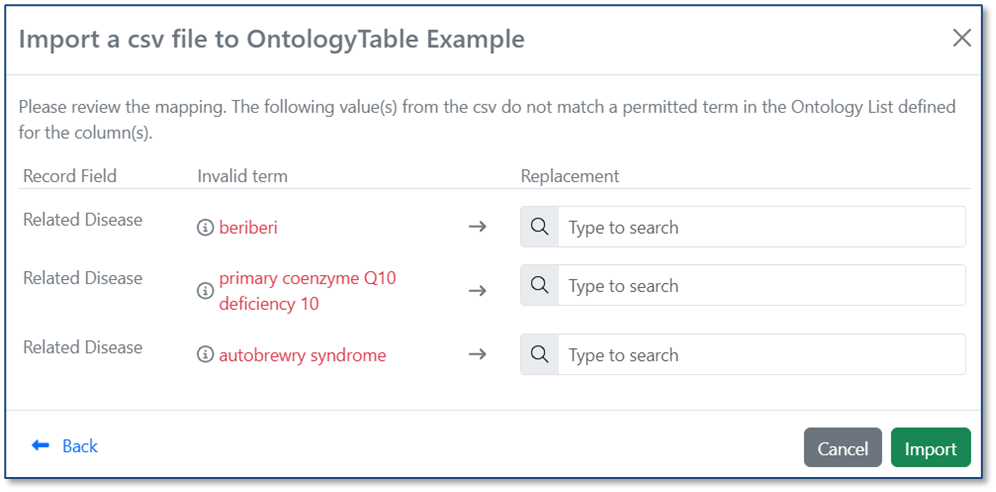
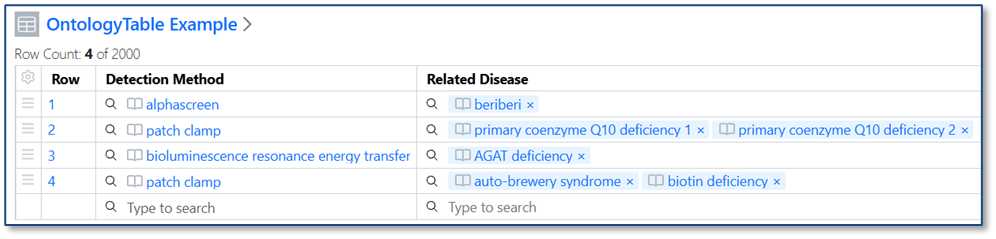
When you import a CSV into a table, ontology values are now validated against the Ontology List for that field. If a value in the CSV matches a term’s preferred name or any synonym, it is automatically mapped to the correct ontology term. If no matching term is found, users can resolve the value during import by selecting the appropriate term from the Ontology List.
Data Workflows & Analytics
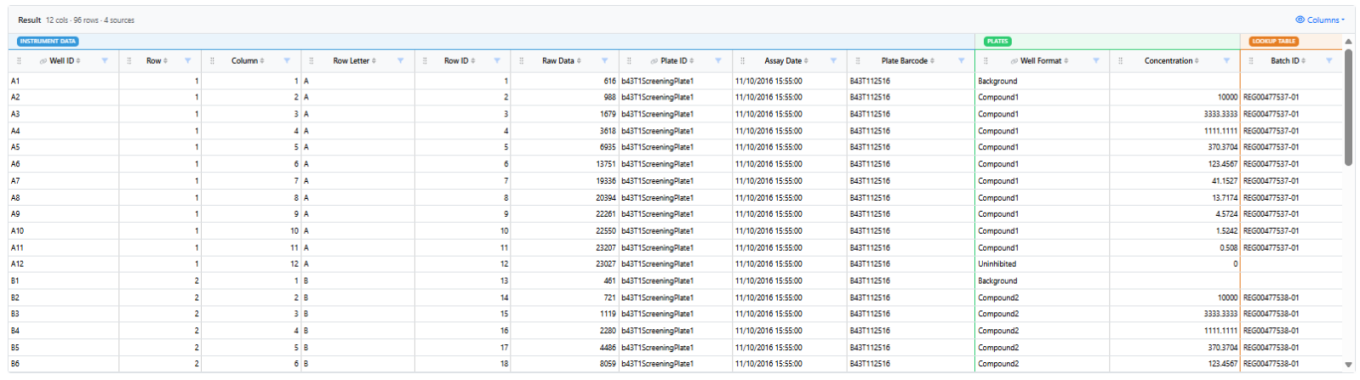
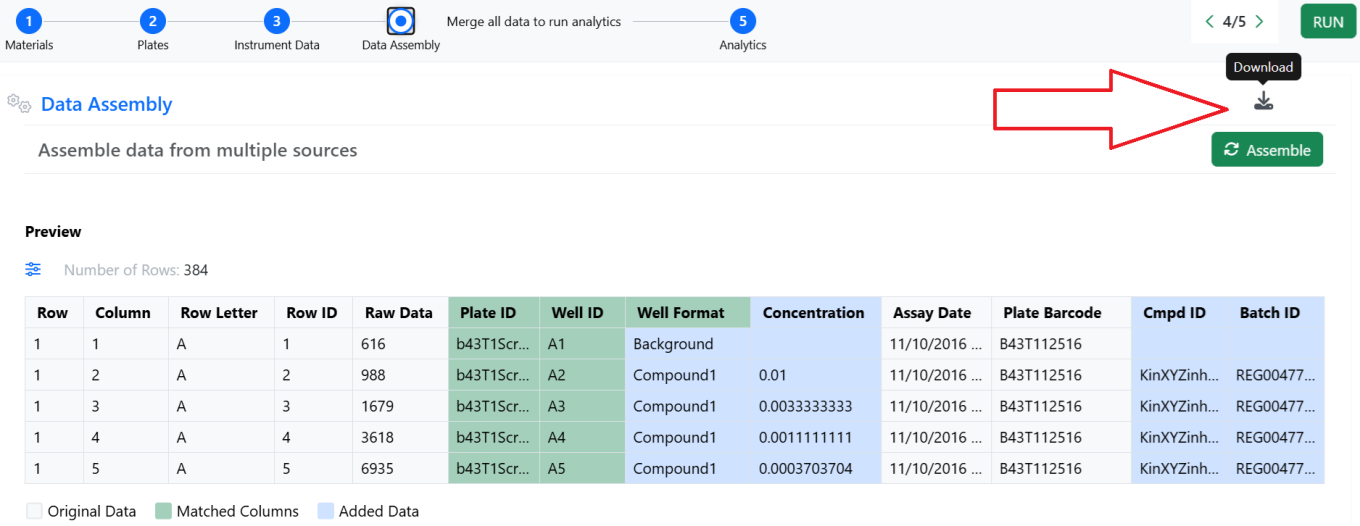
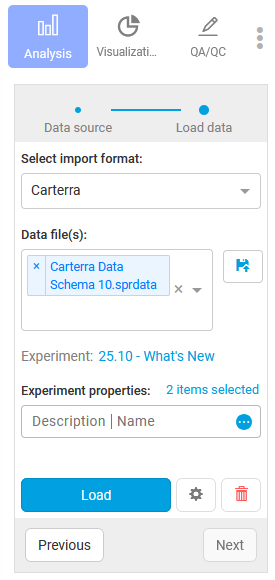
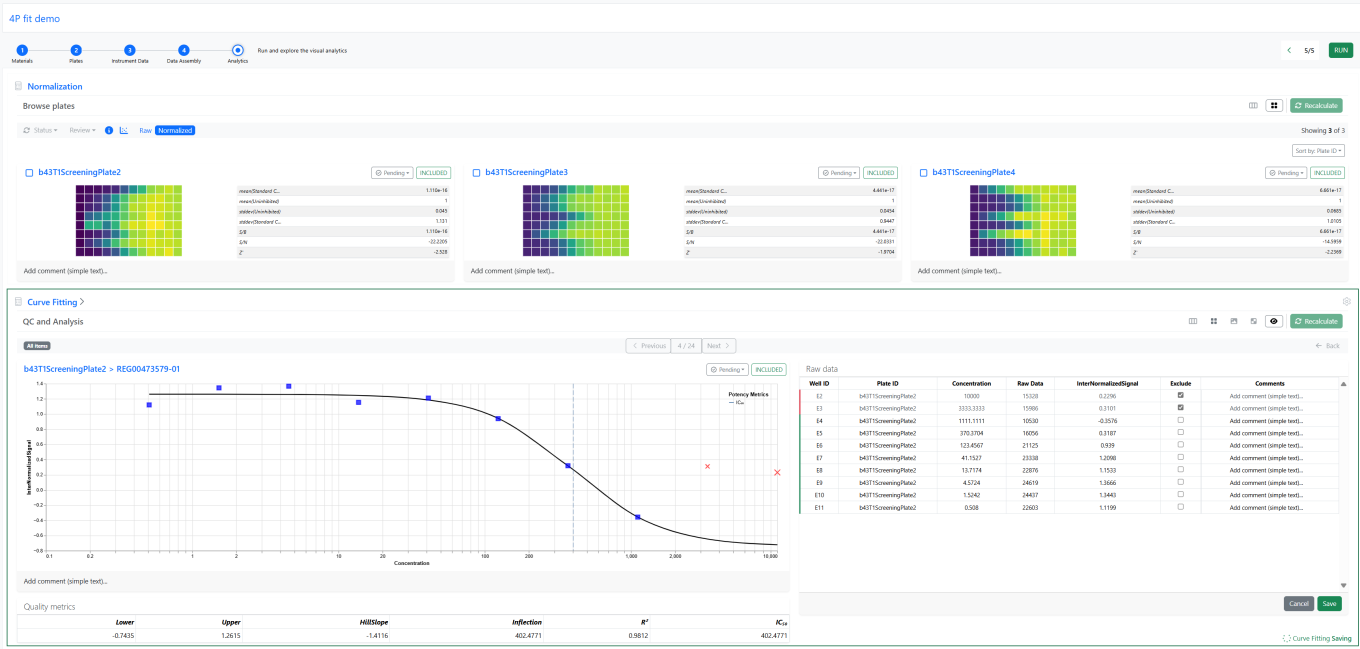
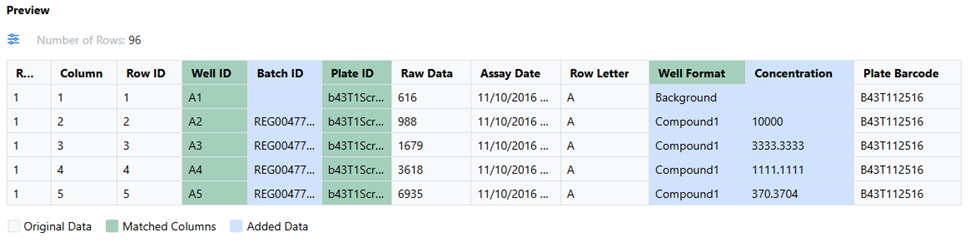
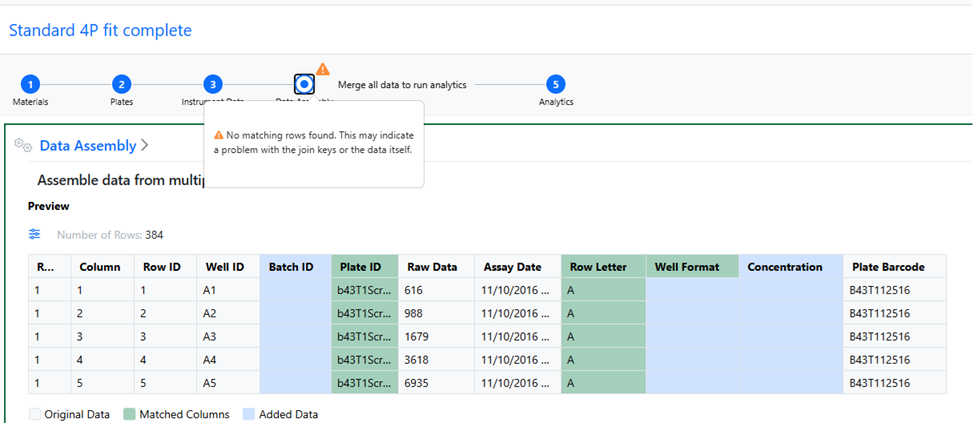
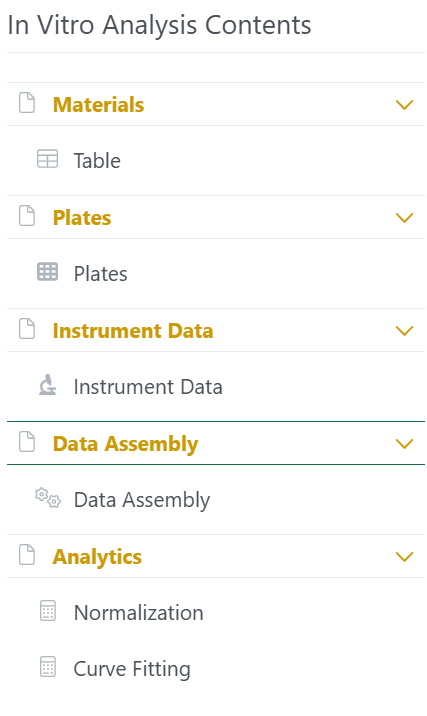
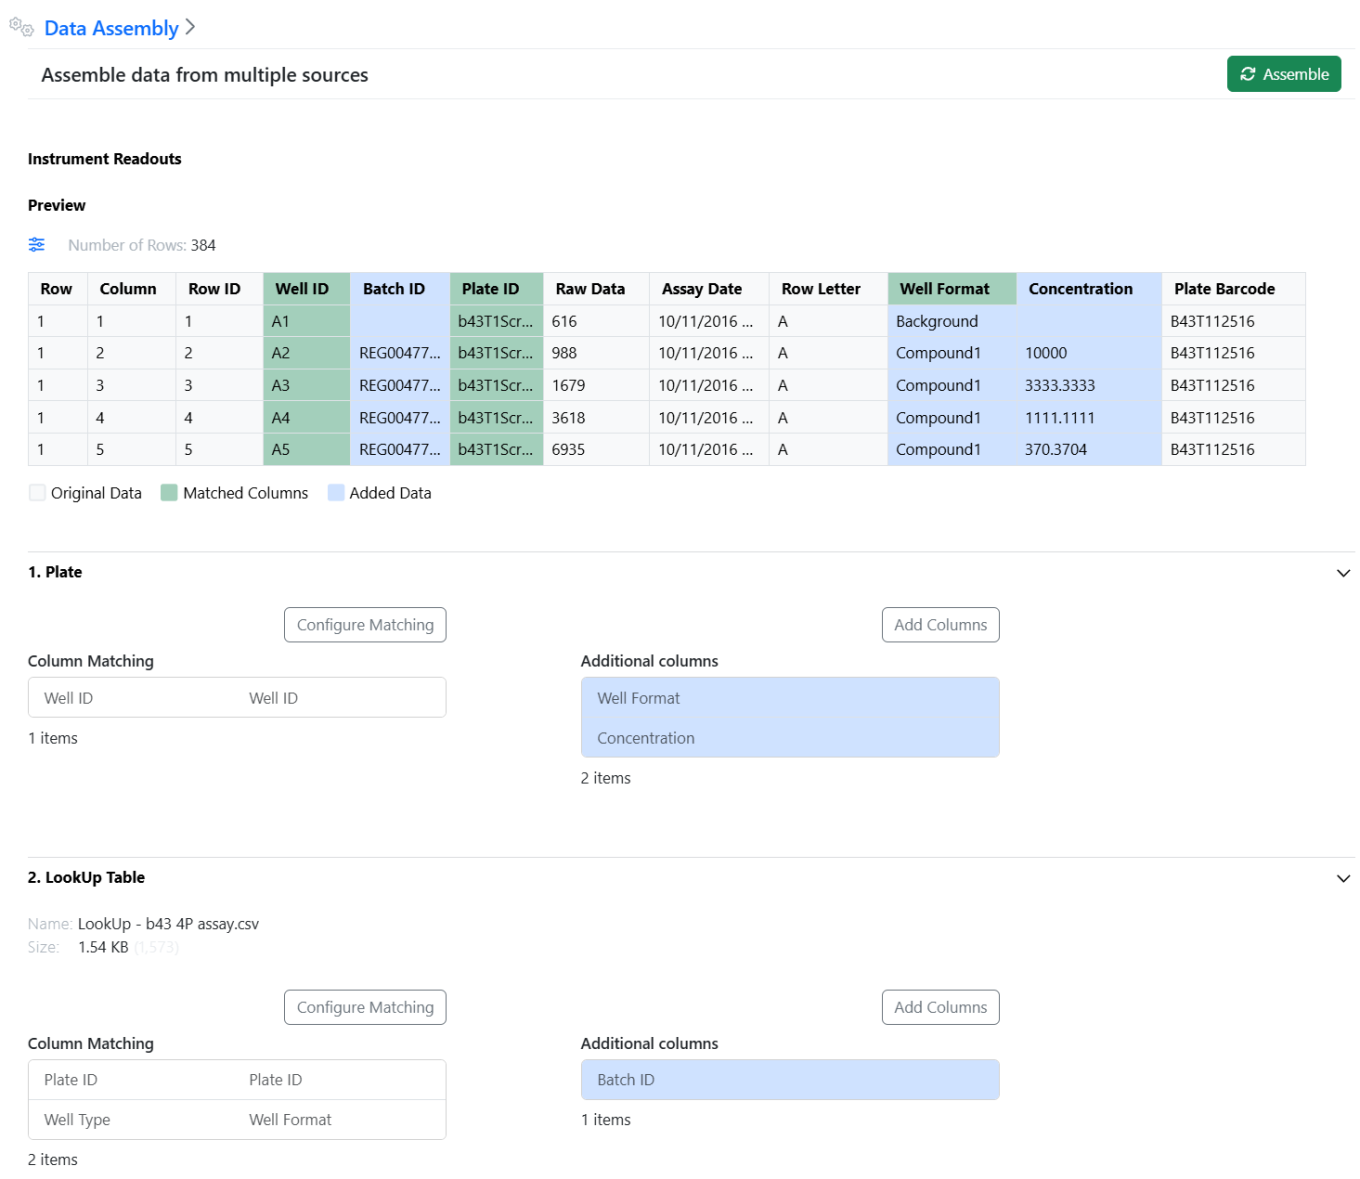
In Signals One, all In Vitro Analysis users will discover that in the Data Assembly step, the 5-rows static preview has been replaced by an interactive viewer with continuous scroll. Numerical and categorical columns can now be filtered, sorted, reordered and hidden to flexibly slice and dice the data that will be used in the Analytics steps. Visual cues indicate the source data of the columns, and which columns were used during the matching process.
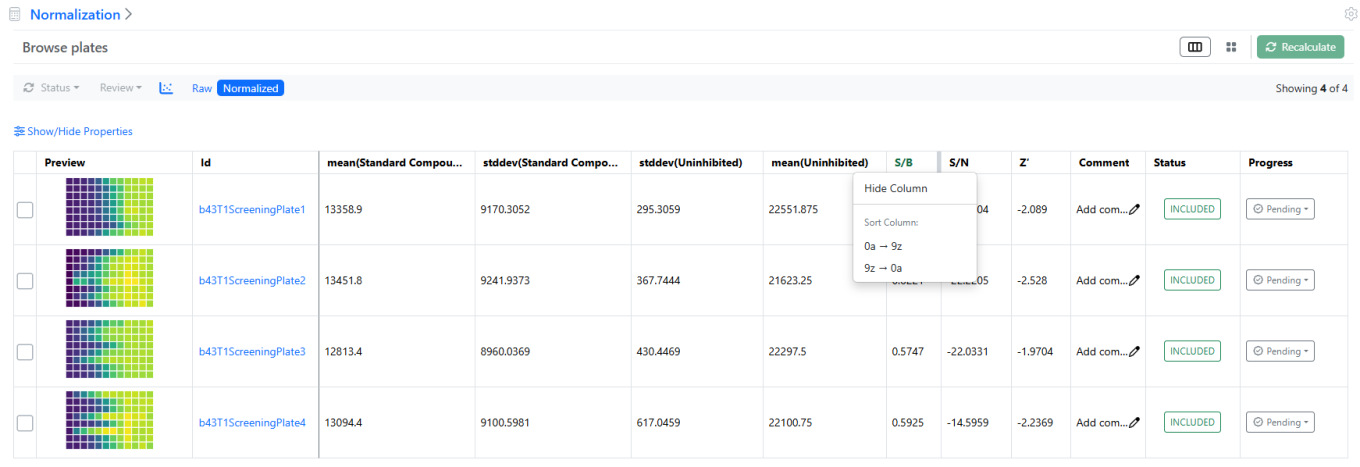
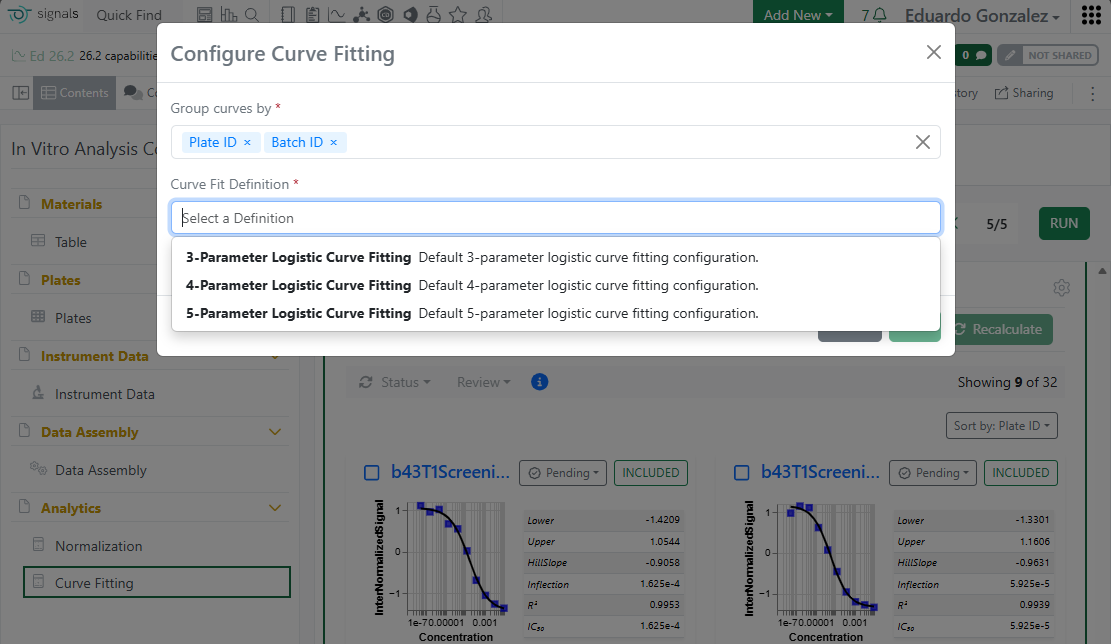
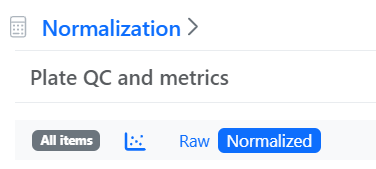
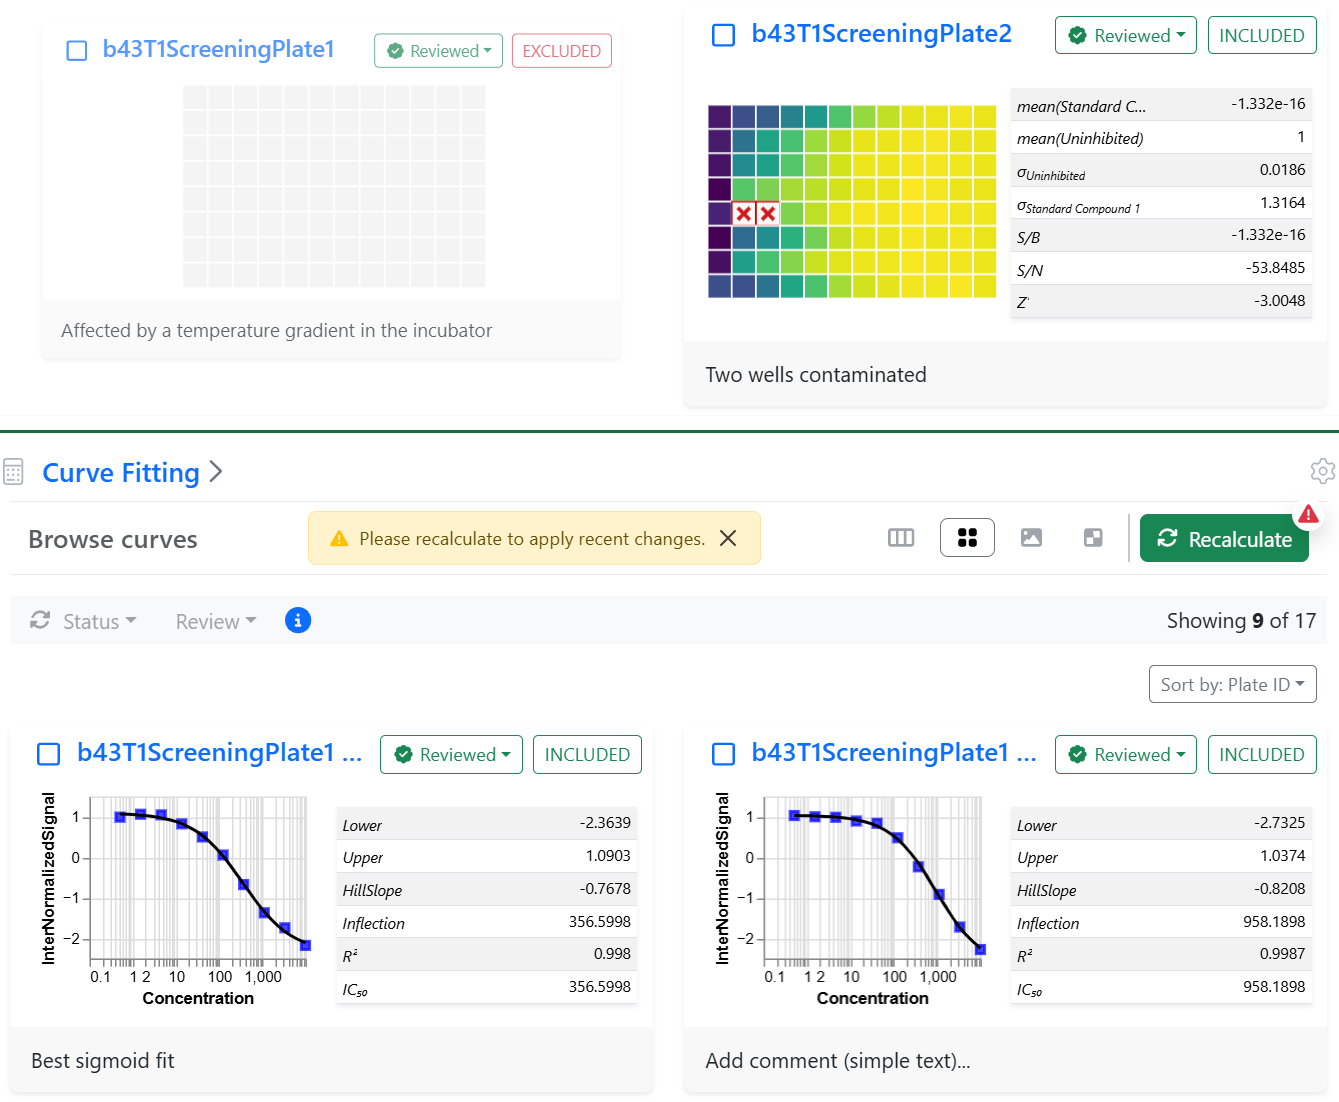
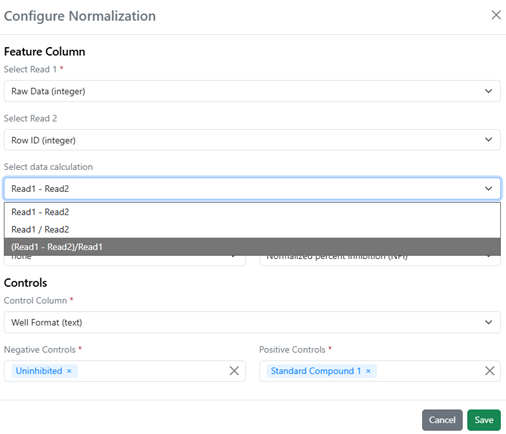
In the Analytics steps of the In Vitro Analysis, a couple of new normalization methods, using the median instead of the average, can now be found in the Inter Plate Method menu, both with the “Robust” prefix.
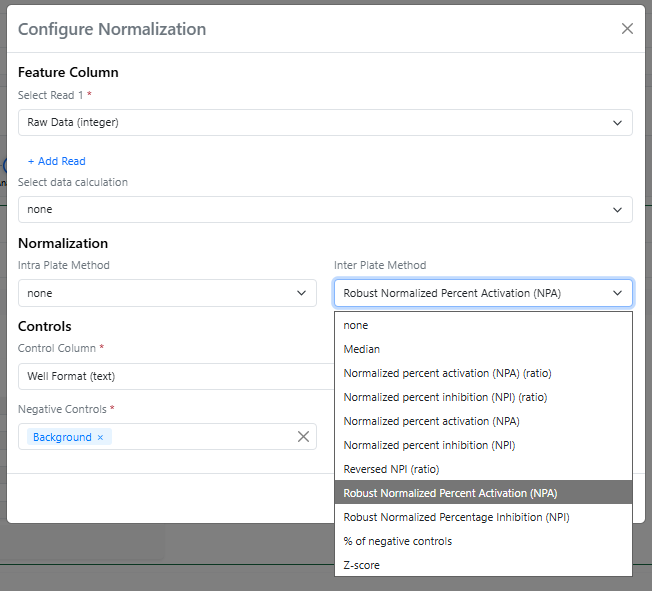
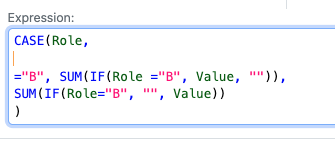
The Robust Normalized Percent Activation is calculated using the expression: “(value - median(n)) / (median(p) - median(n)) * 100” while the Robust Normalized Percent Inhibition is calculated using the expression: “(median(p) – value) / (median(p) - median(n)) * 100” (where p and n are the values for positive and negative controls). Median-based normalizations are called "Robust" because they are not heavily influenced by extreme outliers.
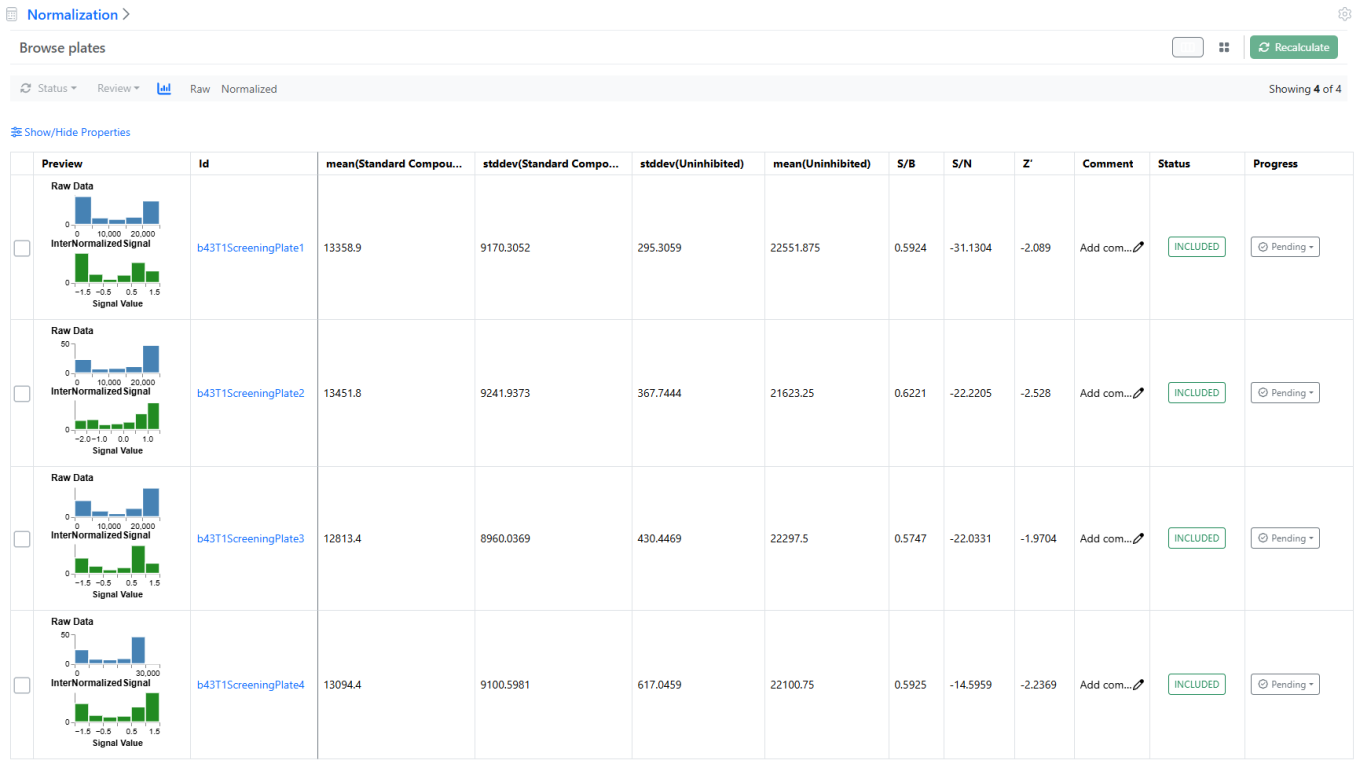
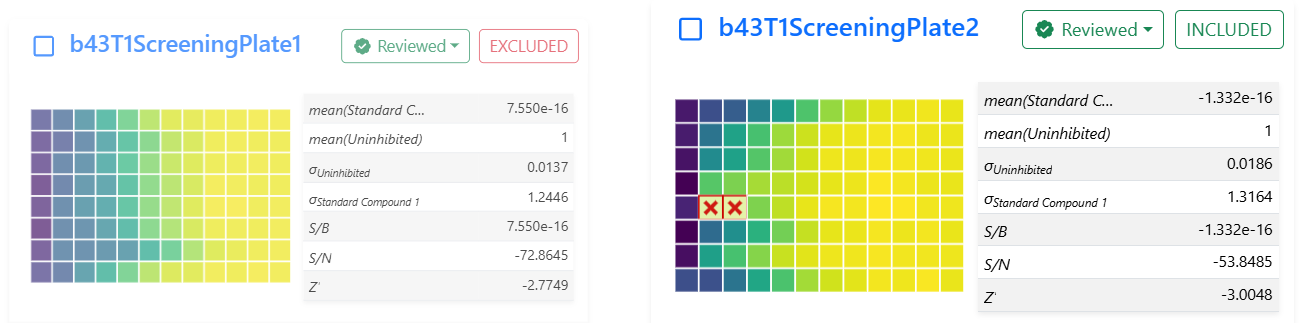
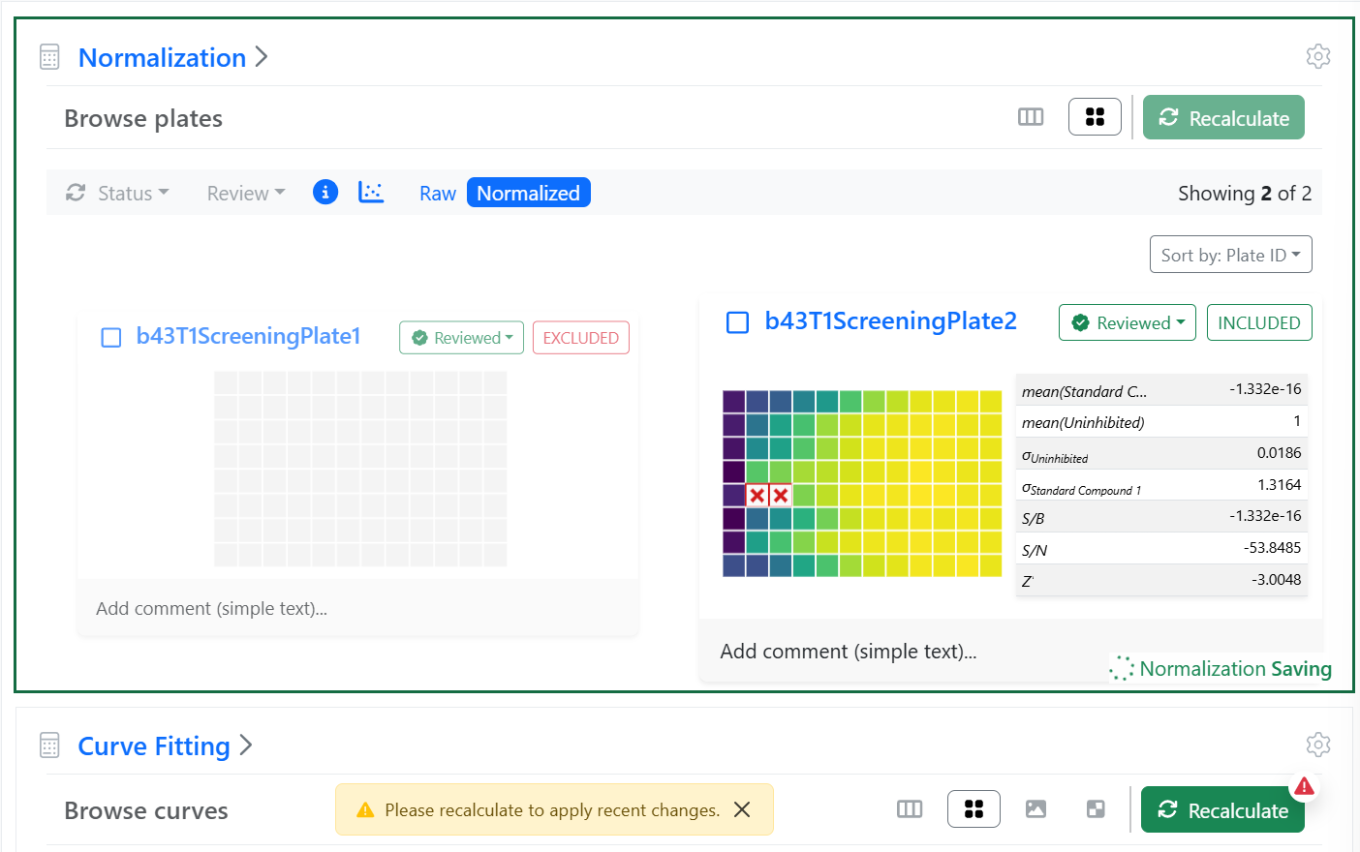
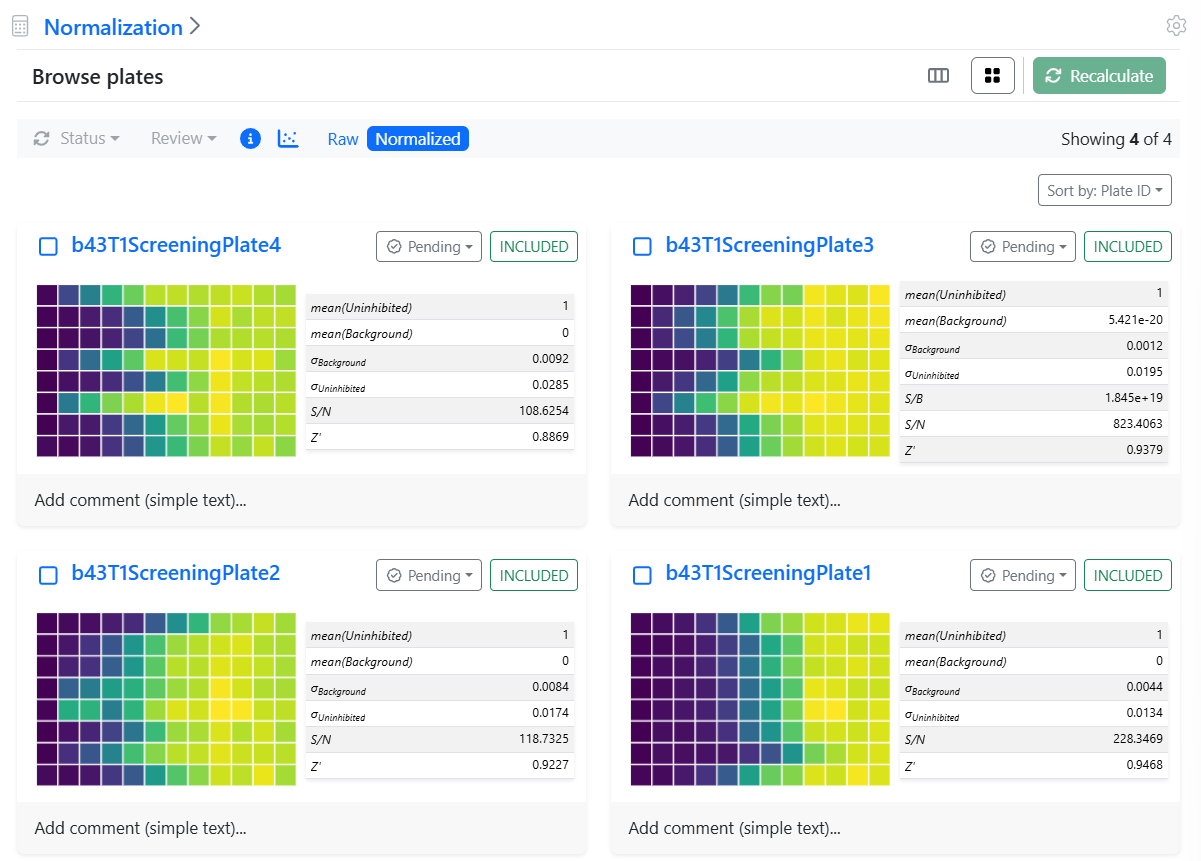
Finally, the mean and standard deviation of both positive and negative controls are calculated and added to the Normalization results.
SAR & Decisioning
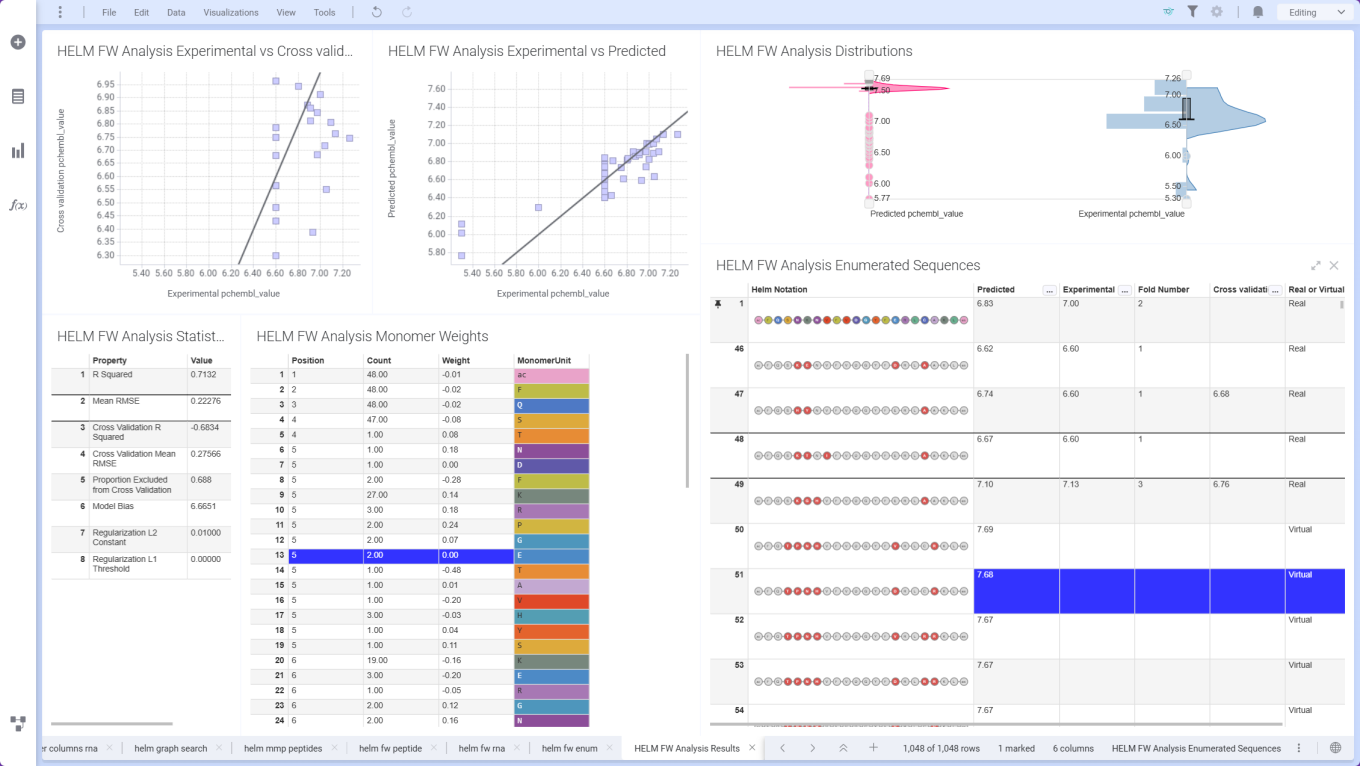
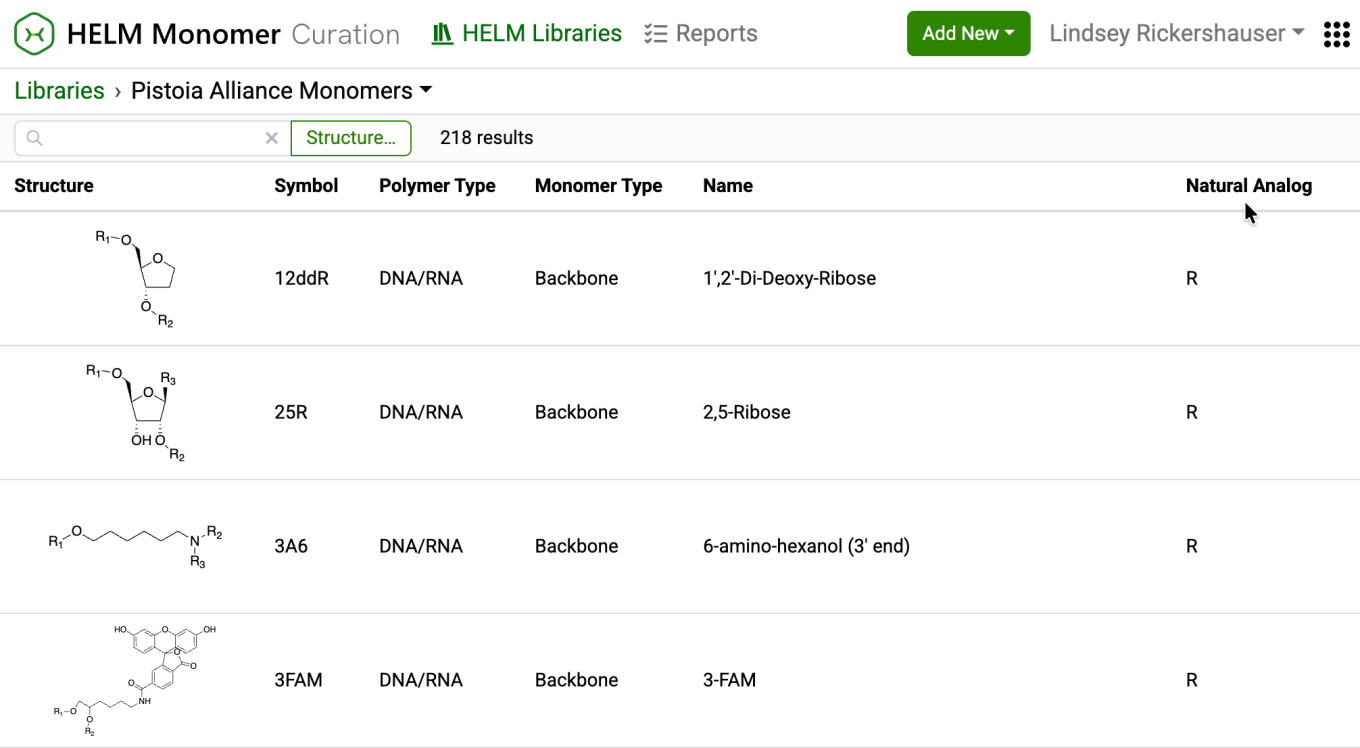
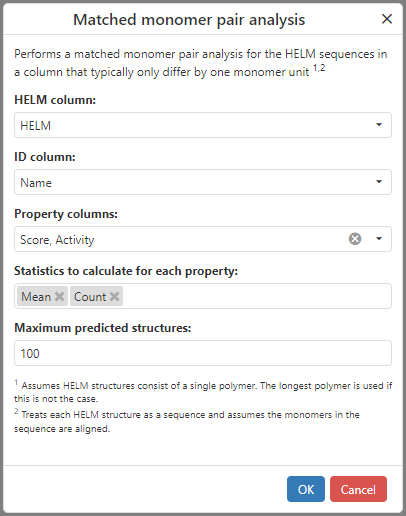
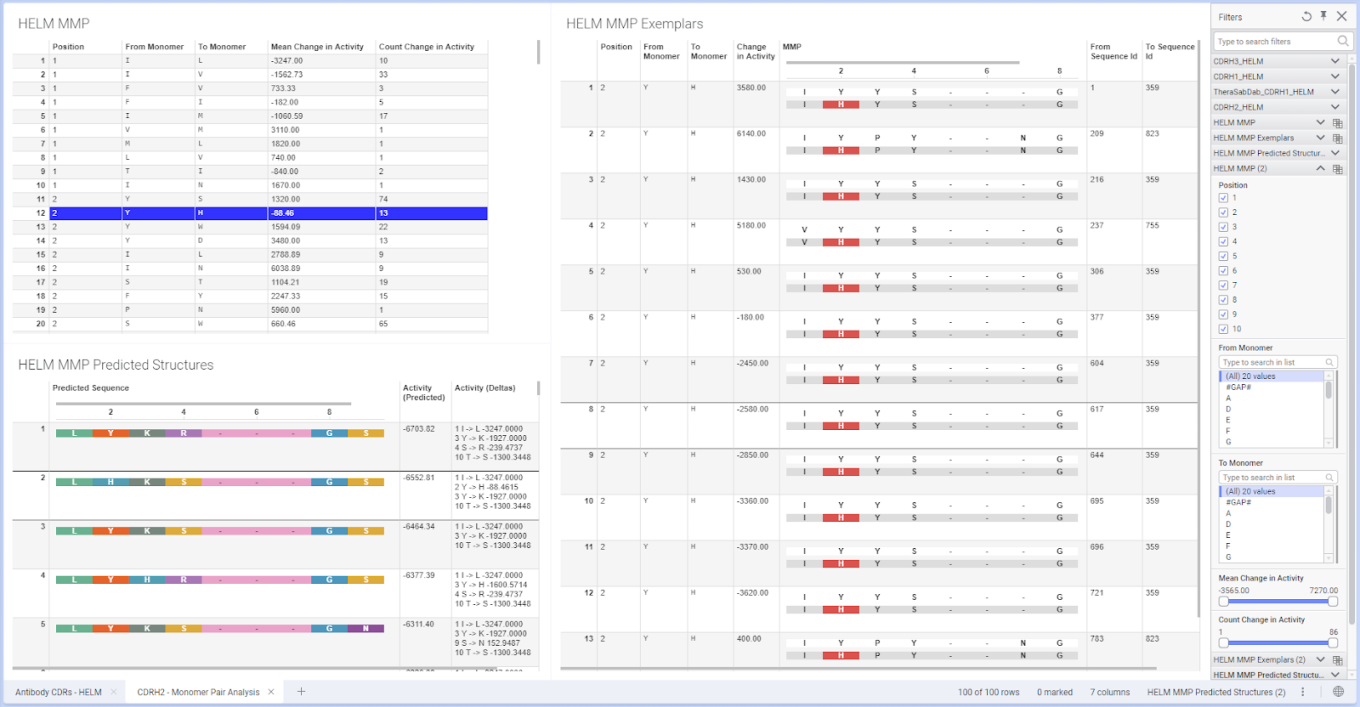
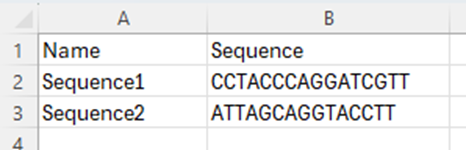
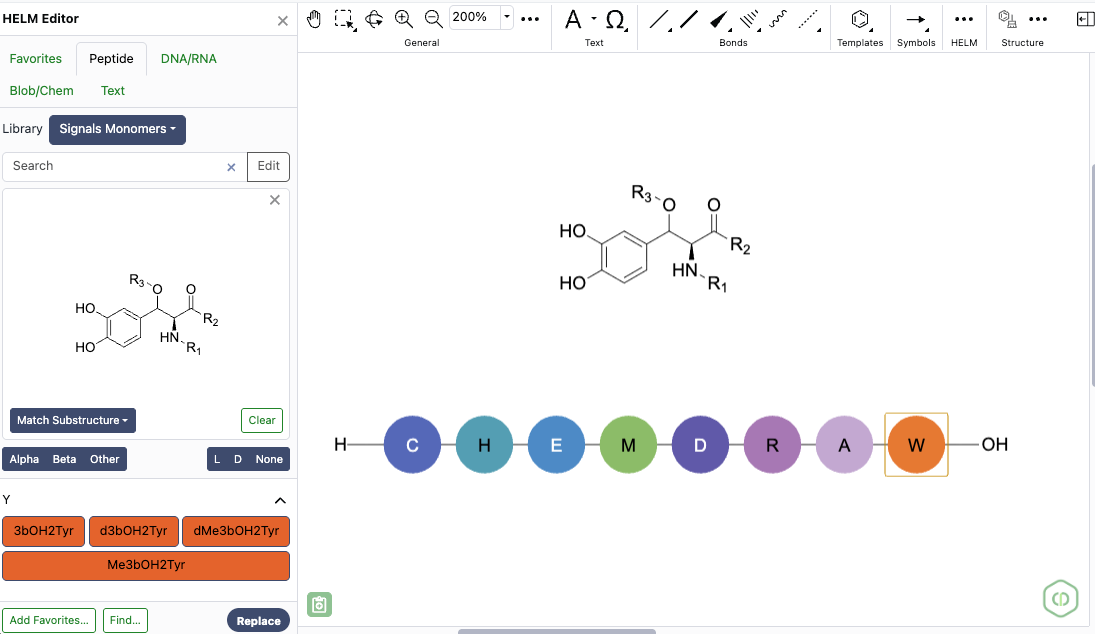
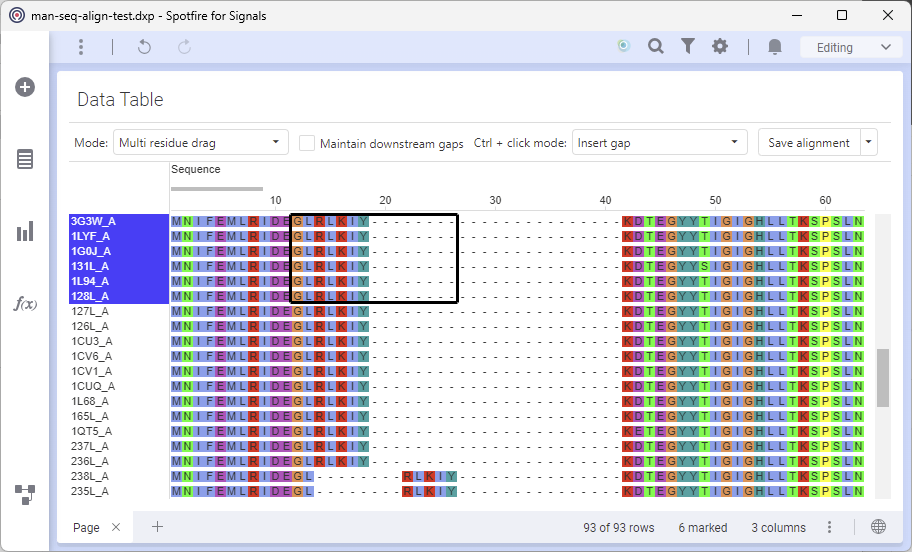
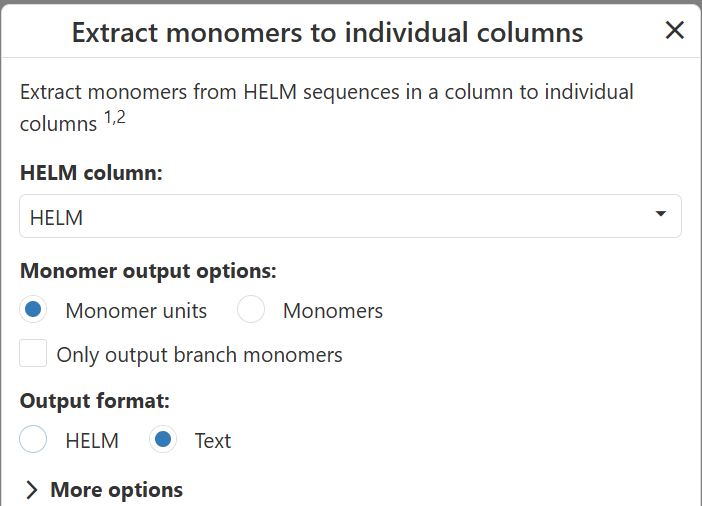
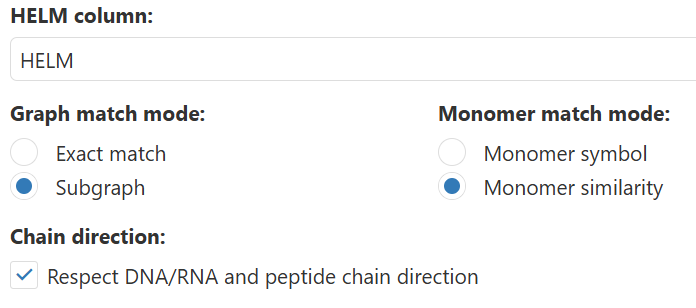
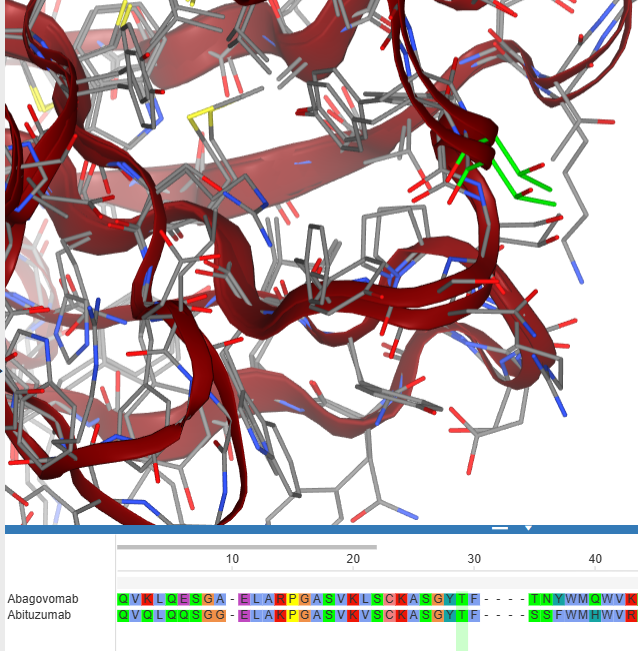
ChemCharts Data Functions introduce Free‑Wilson analysis for HELM sequences, using aligned sequence and property data to quantify position‑specific monomer contributions. Combined with the Free‑Wilson Enumerator, users can design and prioritize novel HELM sequences based on predicted performance.
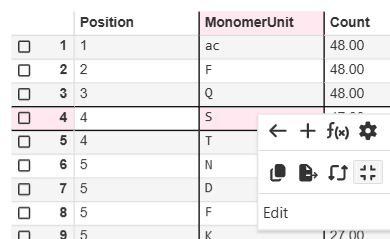
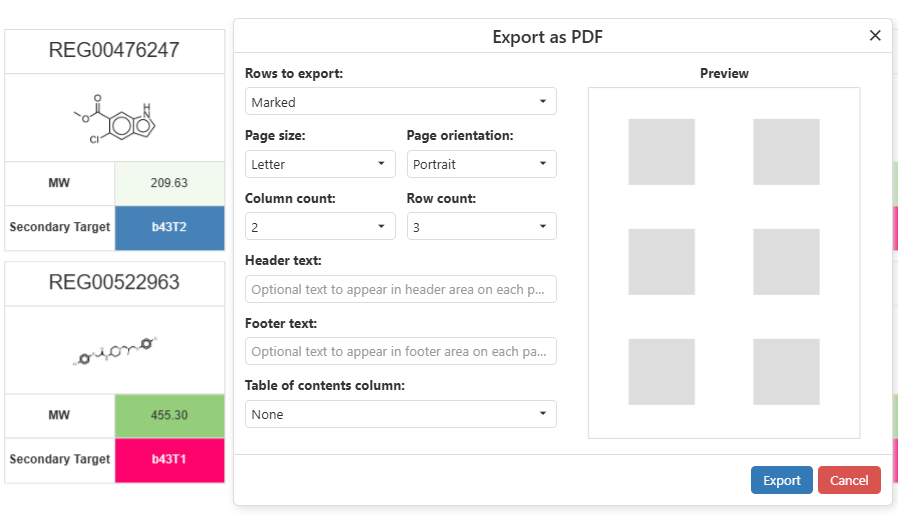
ChemCharts Table Visualizations now support a crosshair, which once activated highlights the cell, row number, and column header when moving the mouse.
Synergy
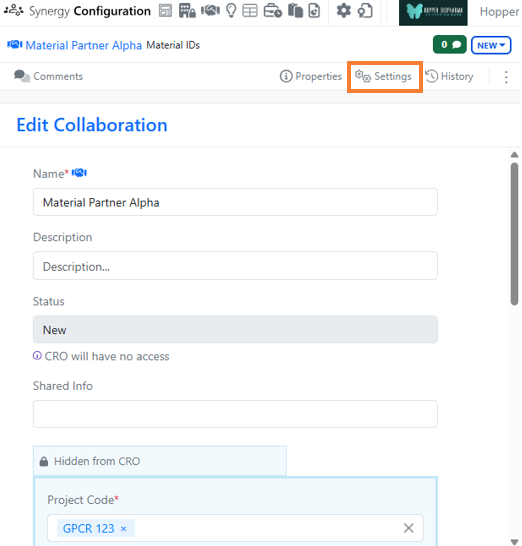
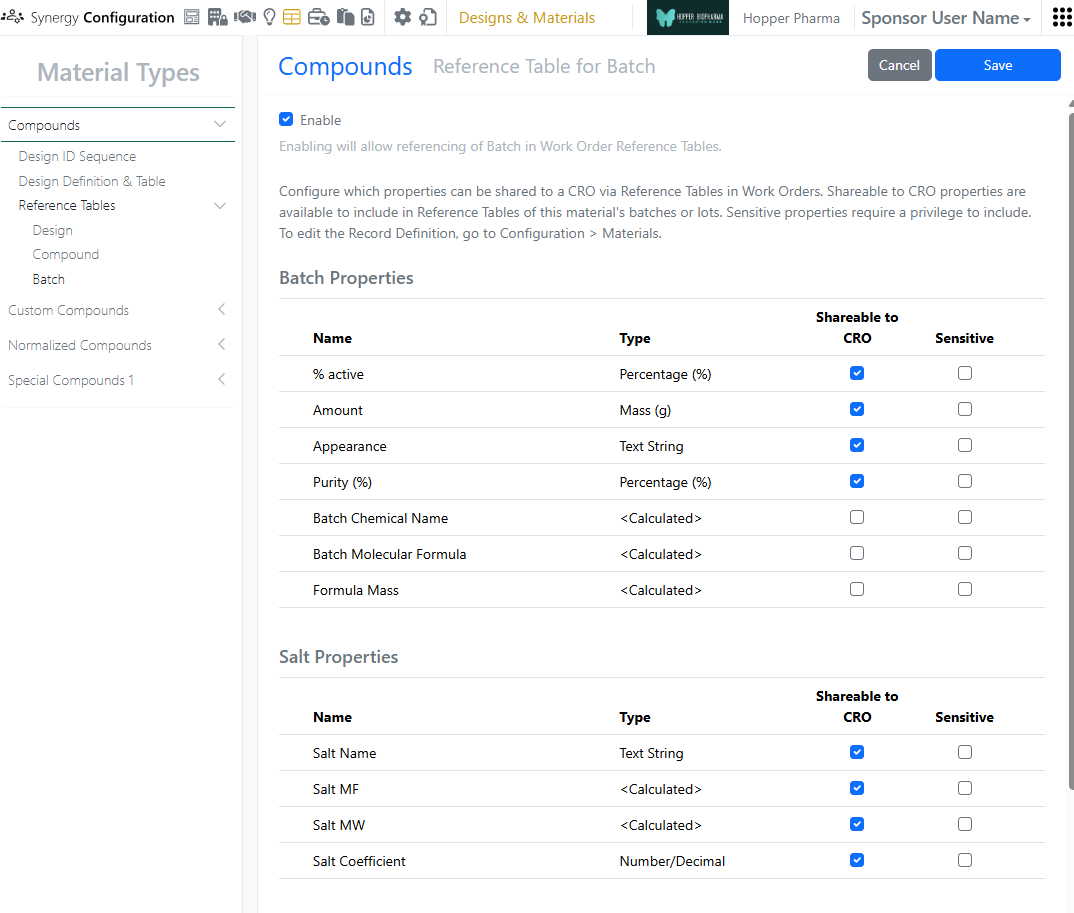
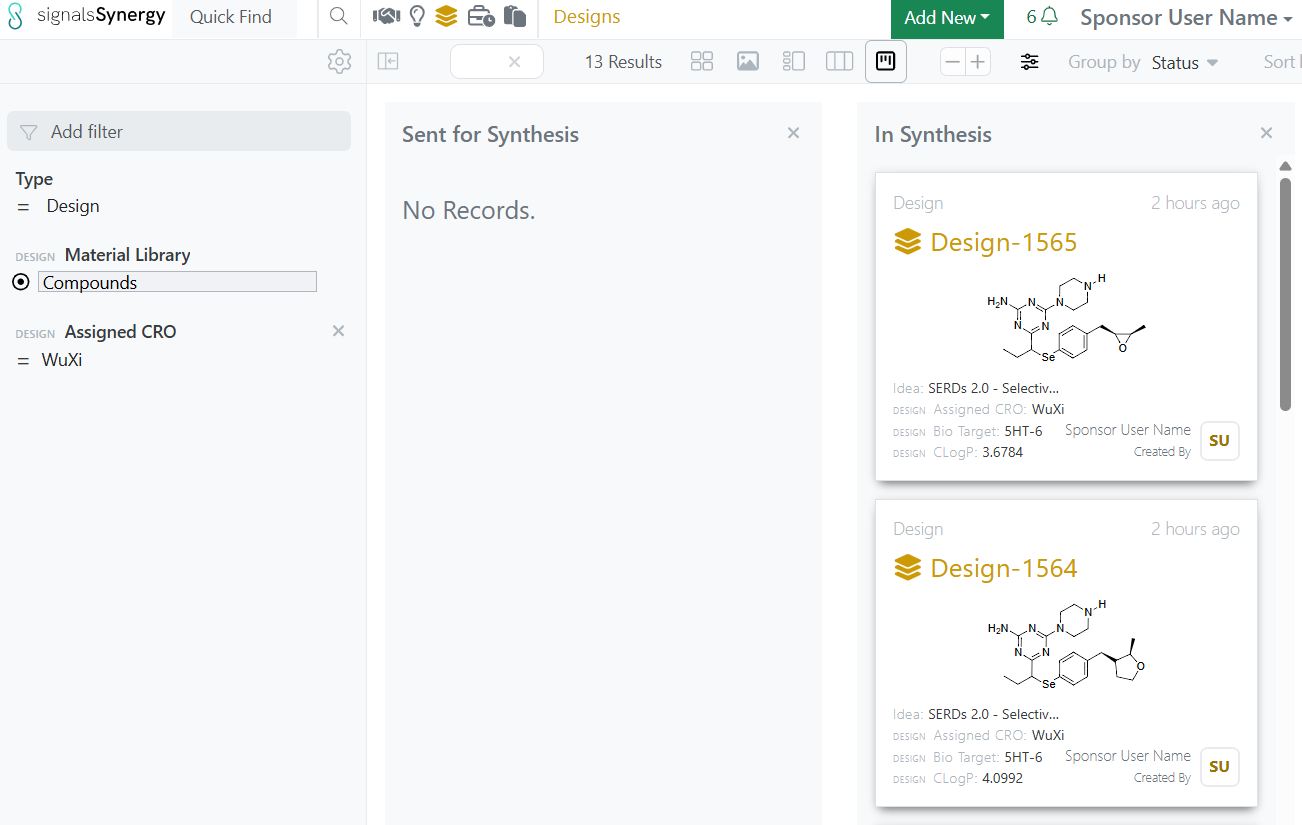
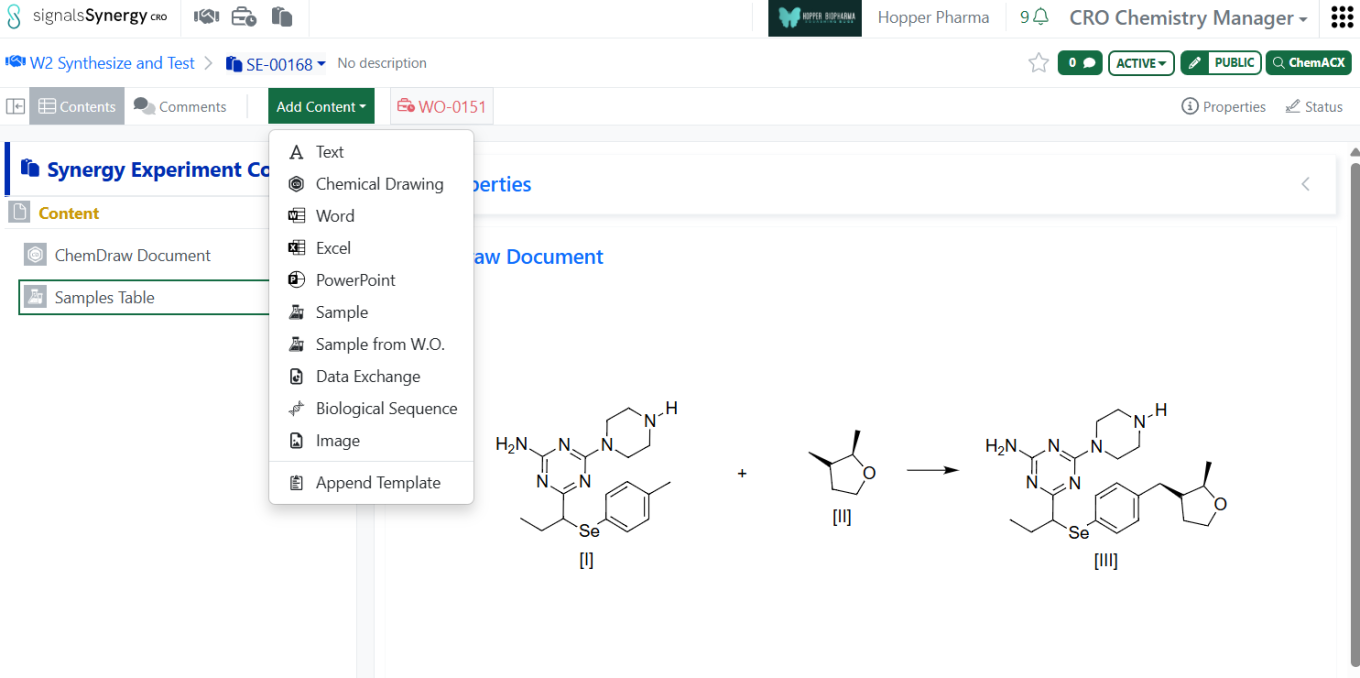
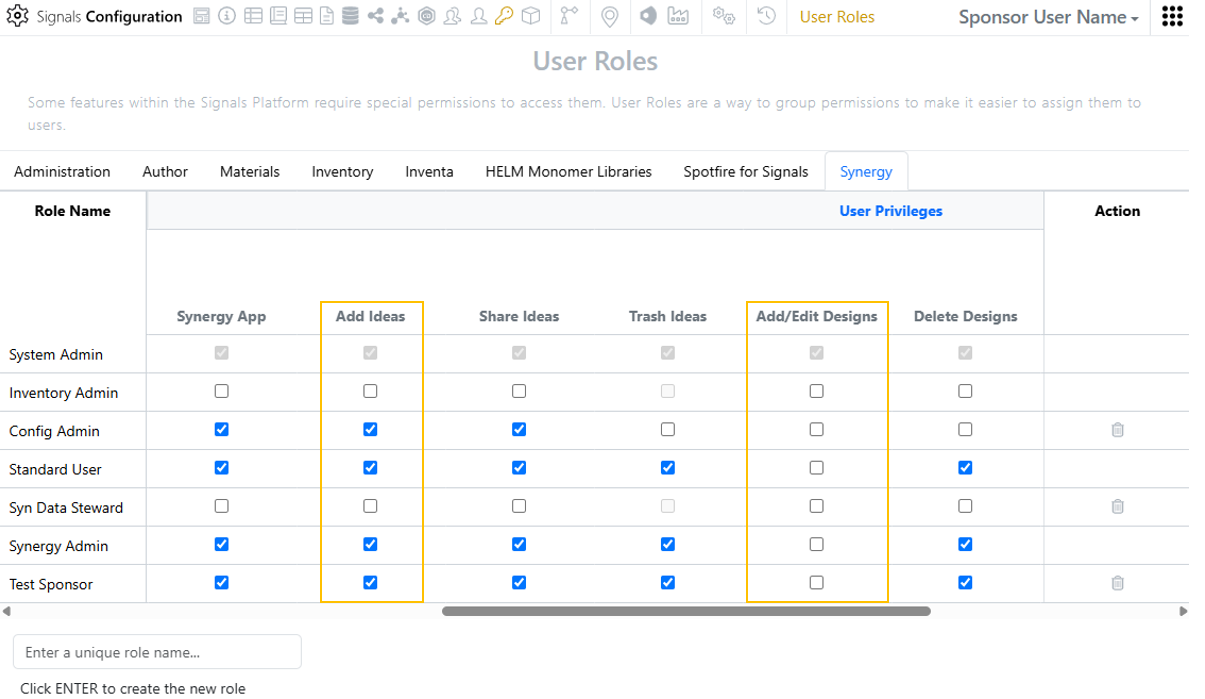
Synergy now allows the administrator to choose whether to use aliased ExIDs or Material IDs with a CRO on a Collaboration-by-Collaboration basis. An administrator with the privilege Manage Collaborations has access to a new Collaborations Settings menu on a Collaboration where the administrator can choose between aliased ExIDs or Material IDs. The default is ExIDs to support the current behavior. This setting can only be changed while the Collaboration is New (before being sent to the CRO) and no child Work Orders are yet created.
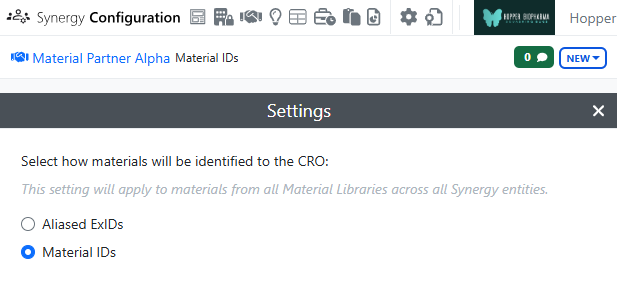
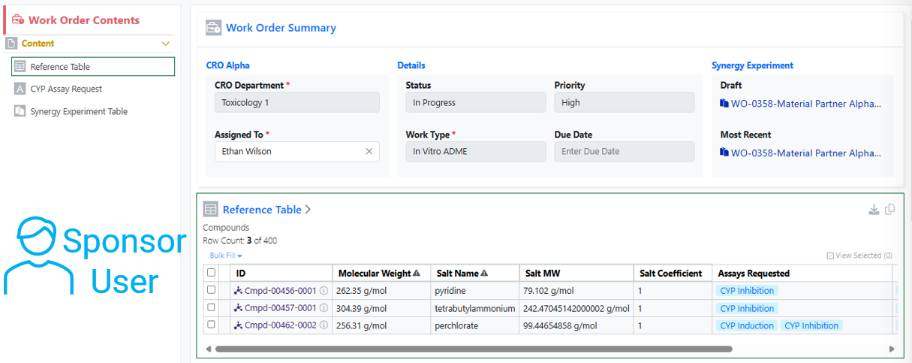
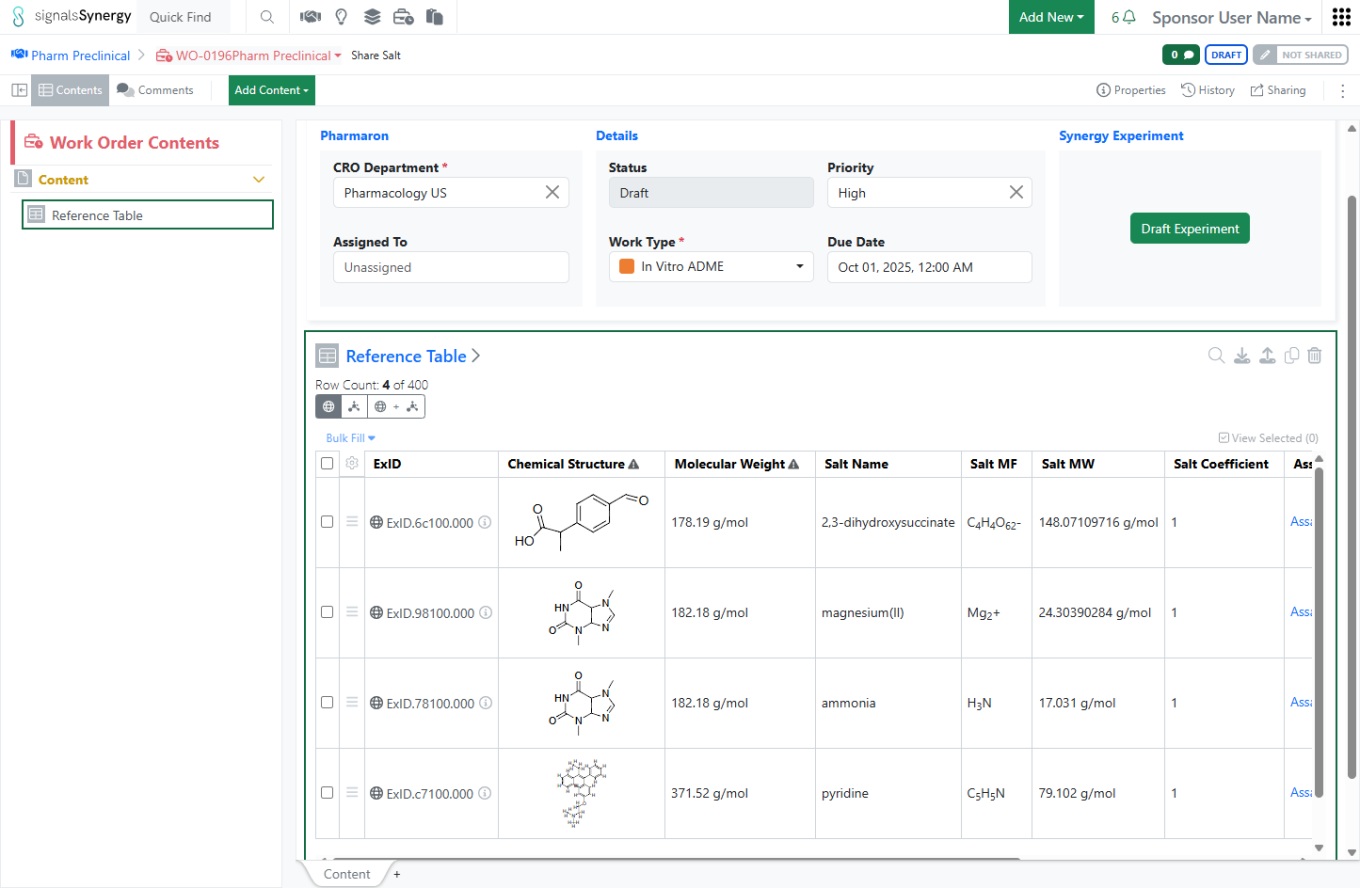
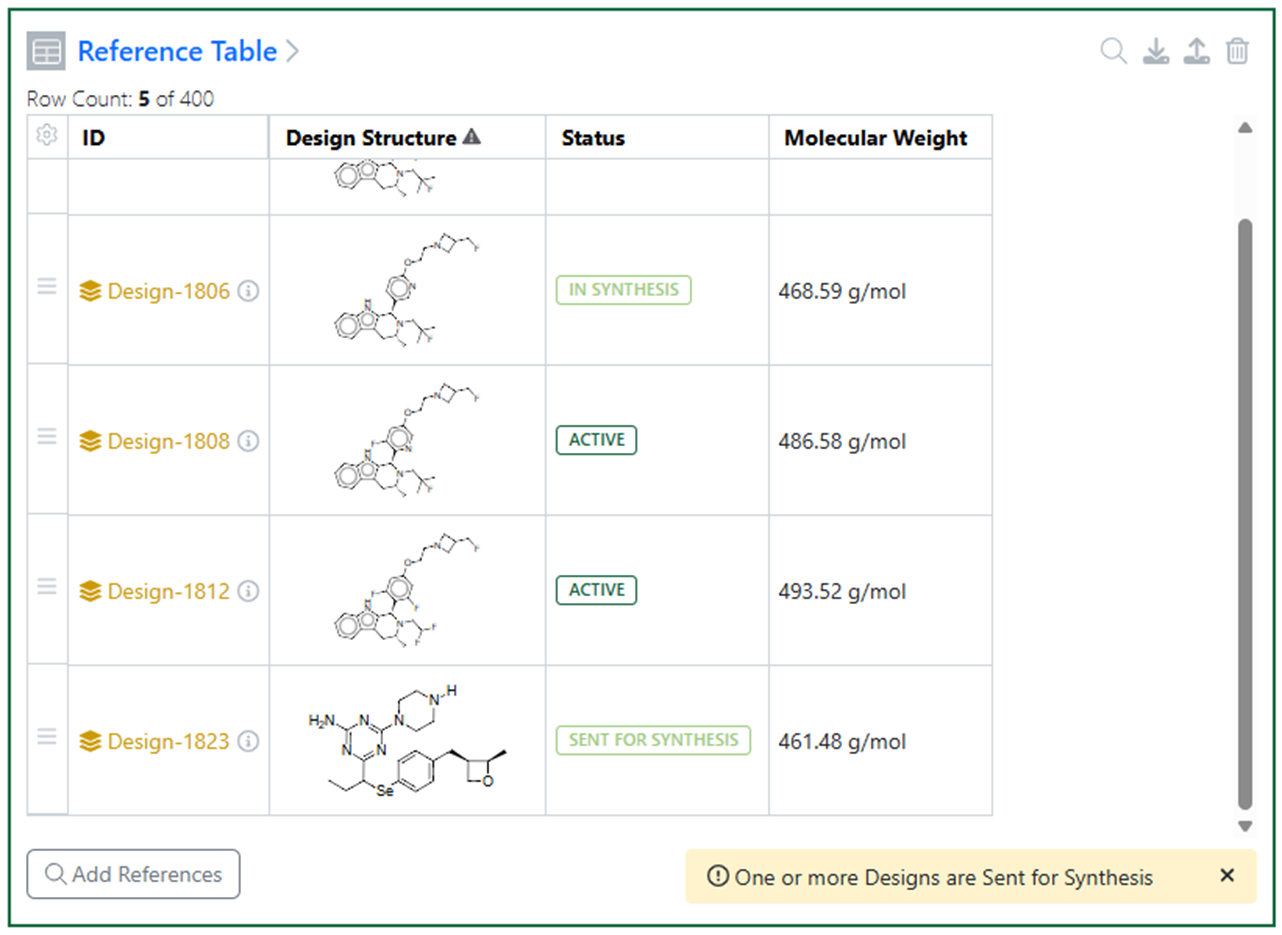
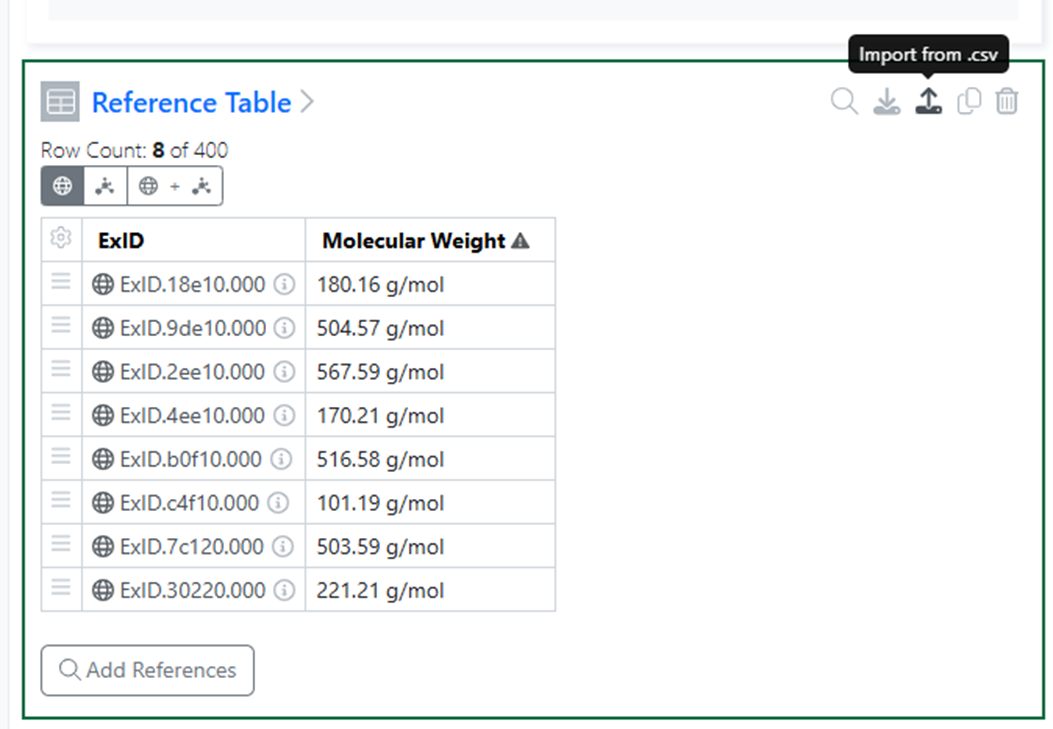
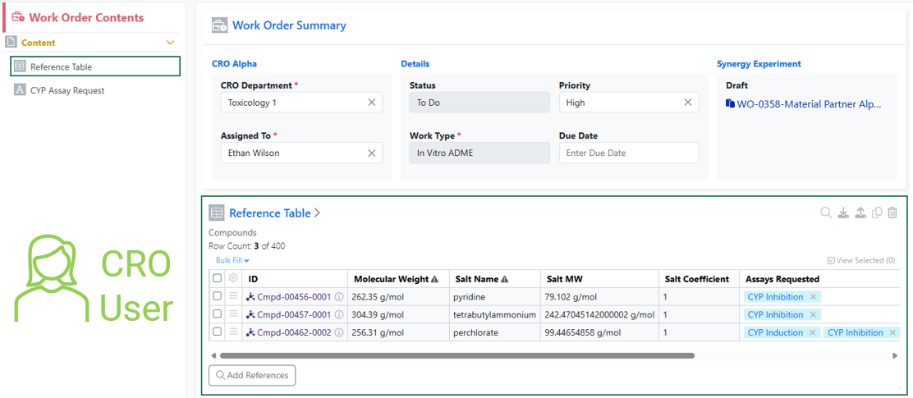
If the Collaboration is set to Materials IDs, materials shared via the Reference Table will display with their Material IDs to both the CRO and Sponsor. The Sponsor will not have a toggle to switch between the IDs, indicating that the Material ID will be shared with the CRO.
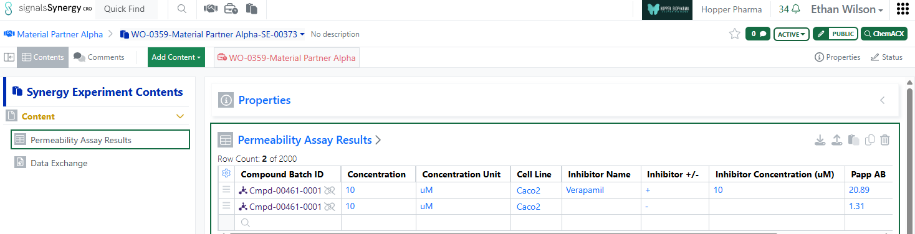
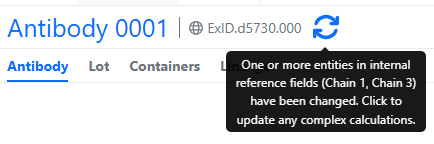
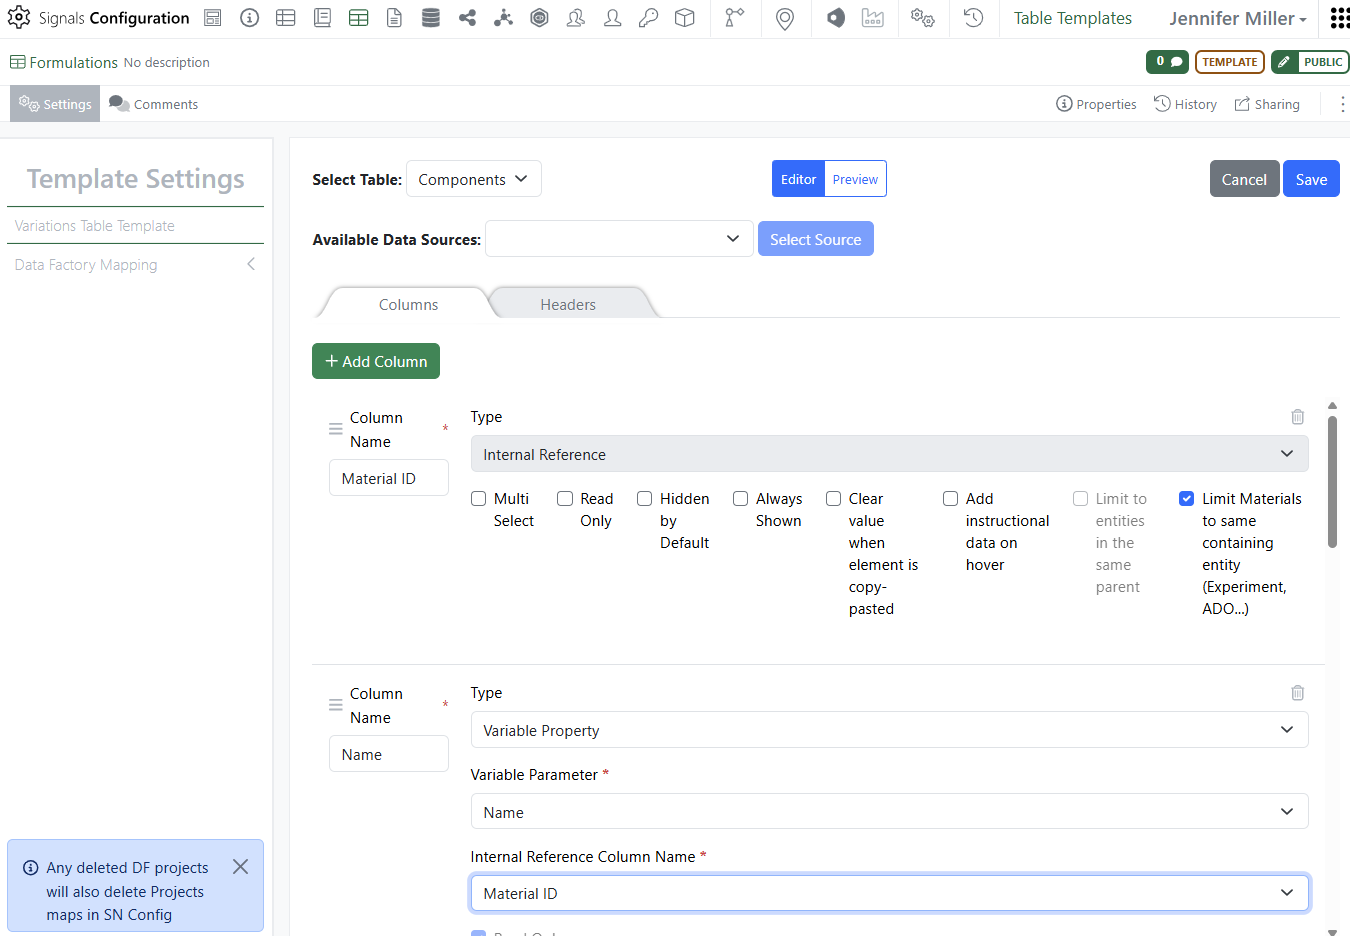
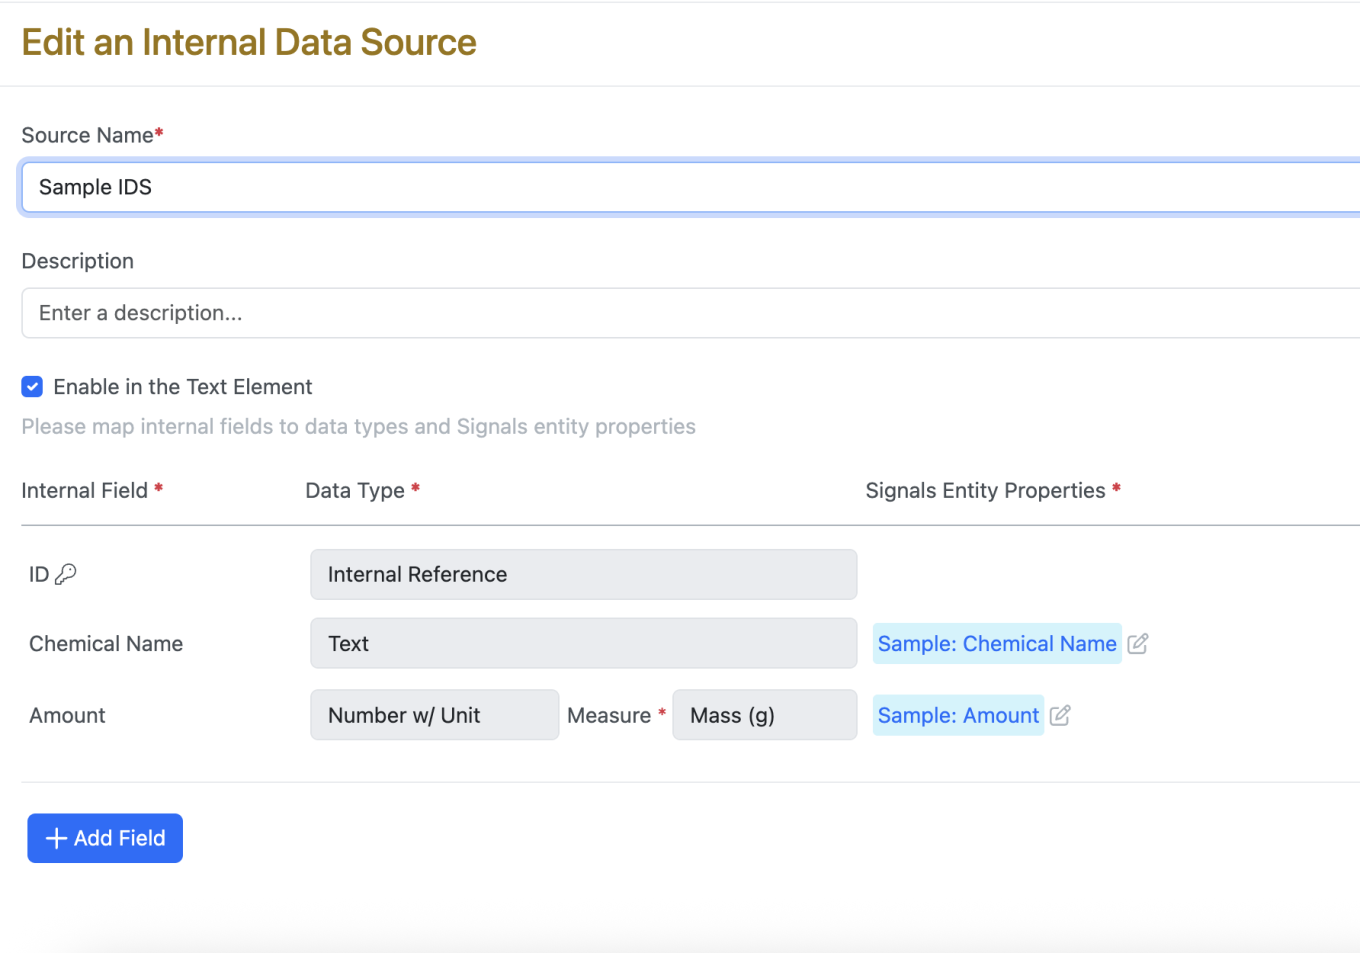
The use of Material IDs persists throughout the Collaboration in all child Work Orders and Synergy Experiments. For example, when a CRO user populates an internal reference column in an admin-defined table or when the Sponsor registers a Sample in a Samples table, the column will display the Material ID for both the Sponsor and CRO.
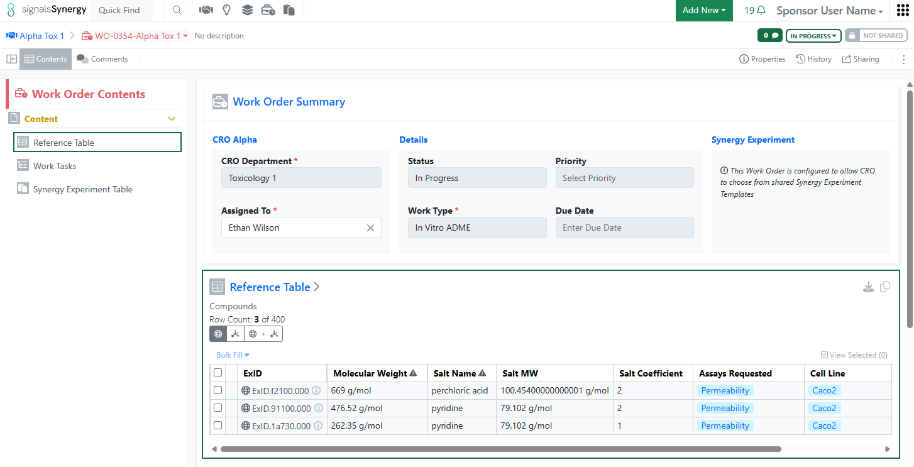
If the Collaboration is set to ExIDs (default), materials shared via the Reference Table will display with their ExIDs to the CRO, and the Sponsor will have a toggle to switch between the ExIDs, Material IDs, or both (existing behavior).
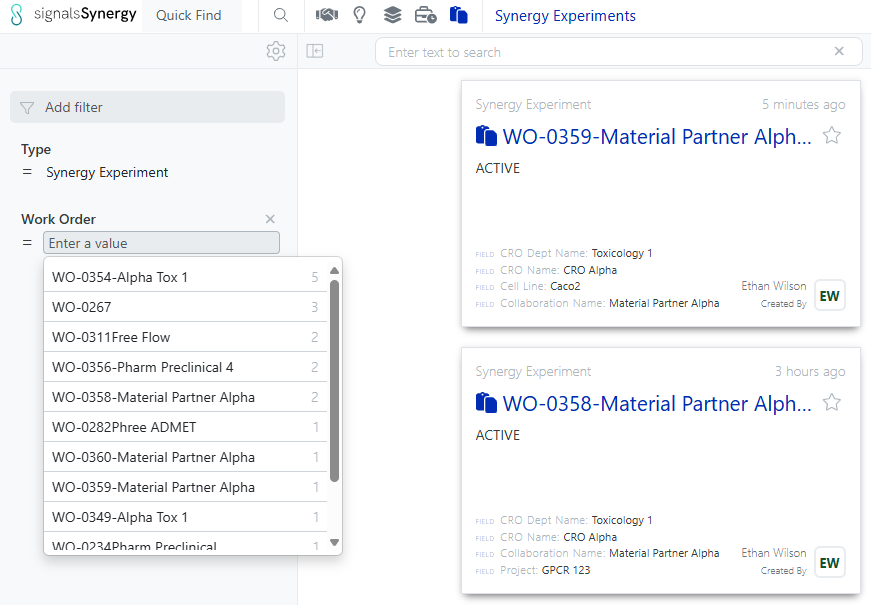
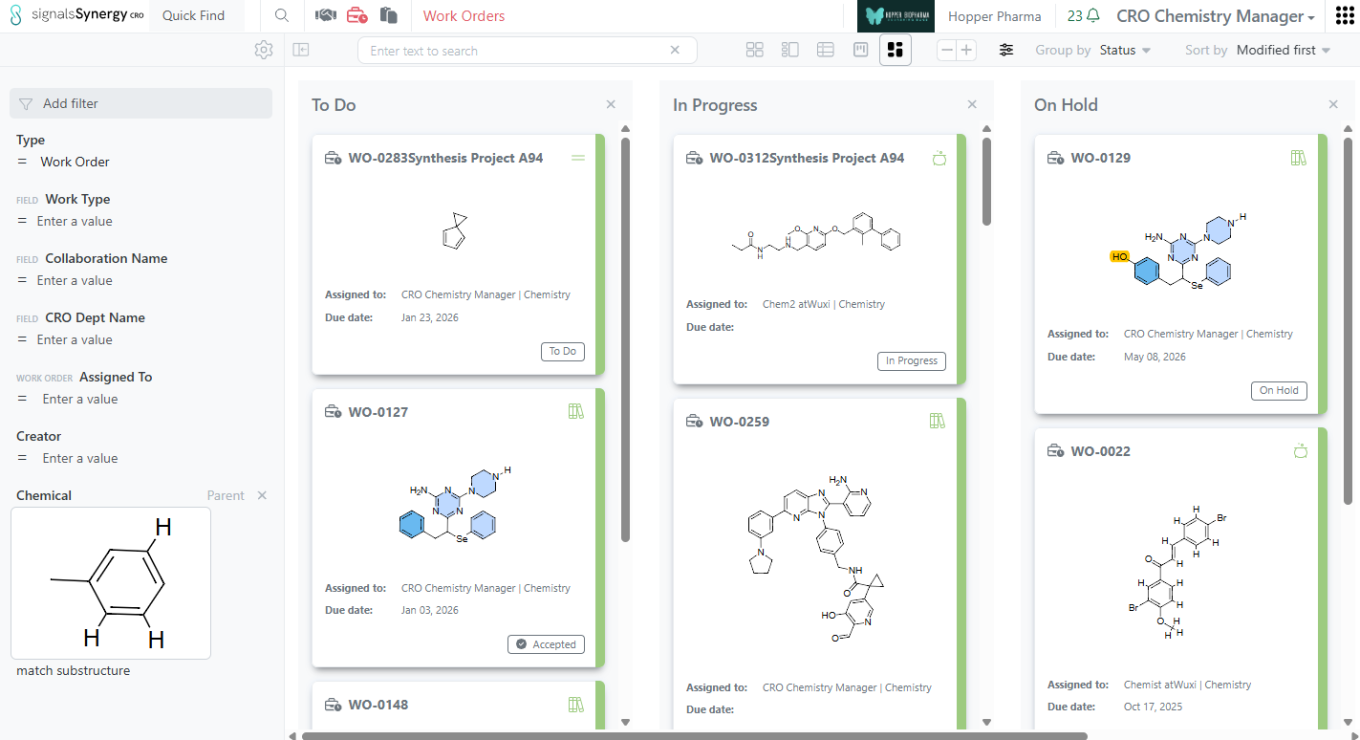
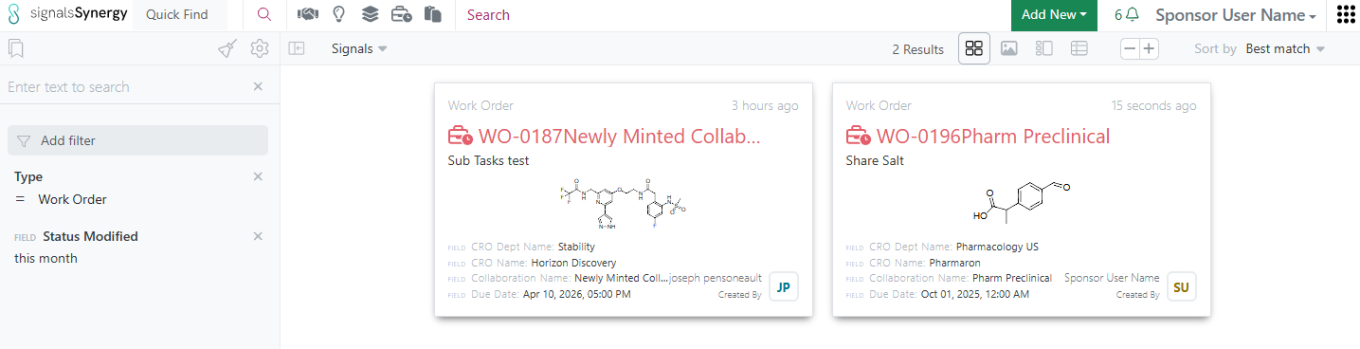
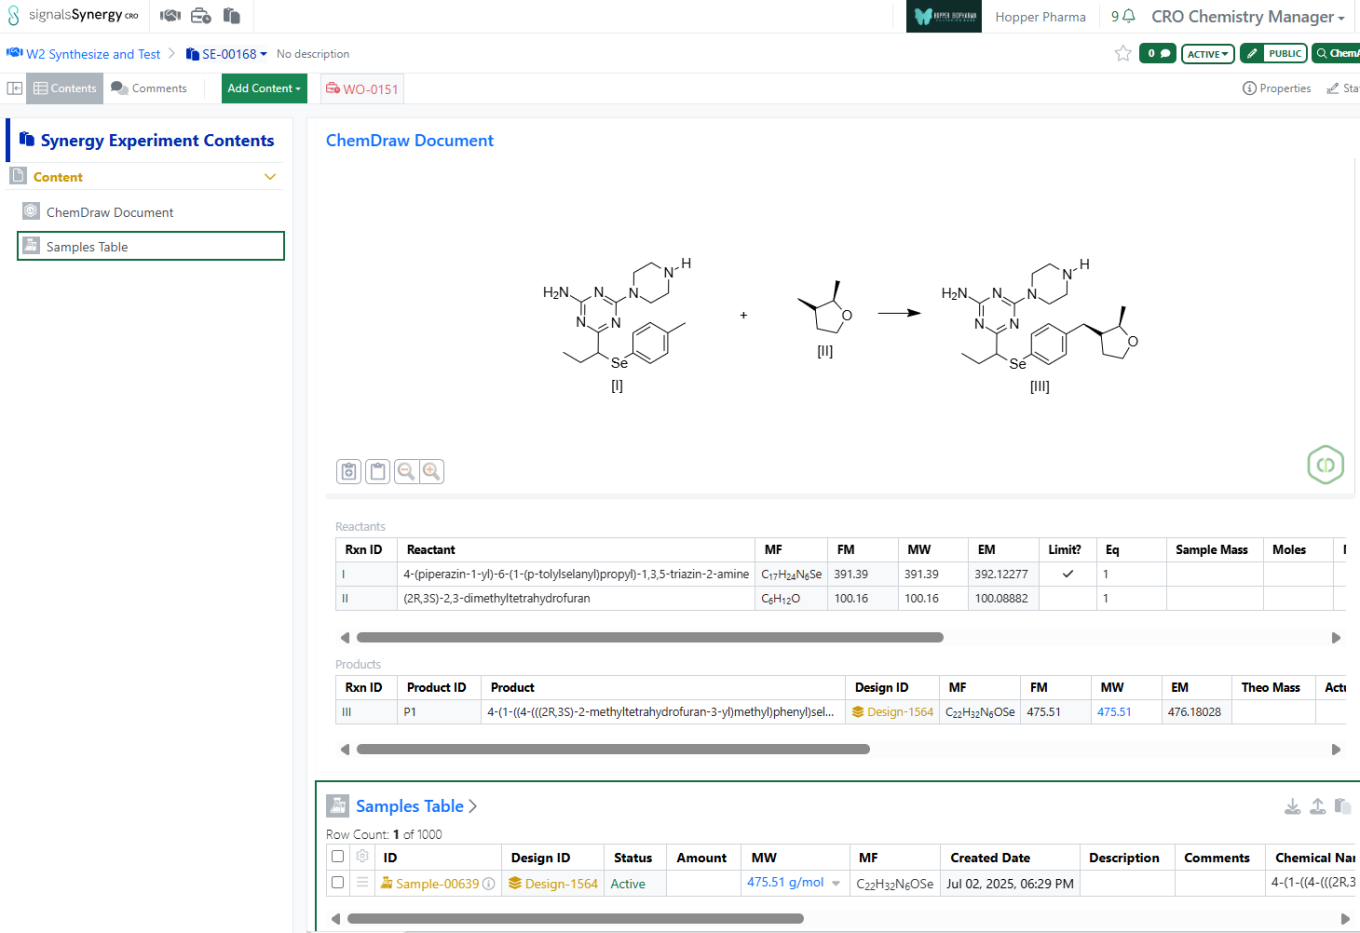
Both Sponsor and CRO users can now search for Synergy Experiments by the associated Work Order ID. The Work Order filter can be added in Advanced Search, typically alongside Type = Synergy Experiment, or to the Synergy Experiments Smart Folder.
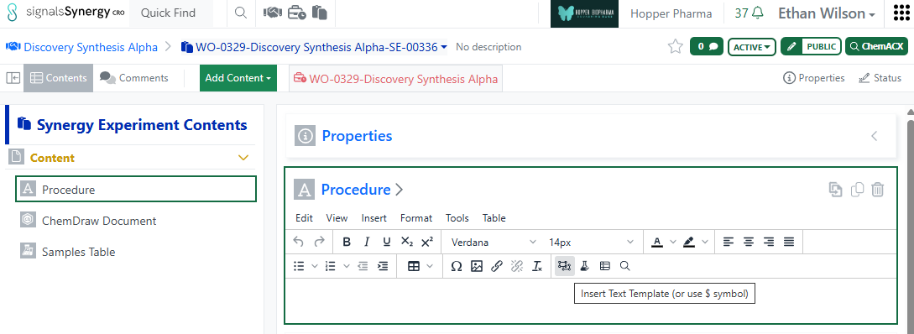
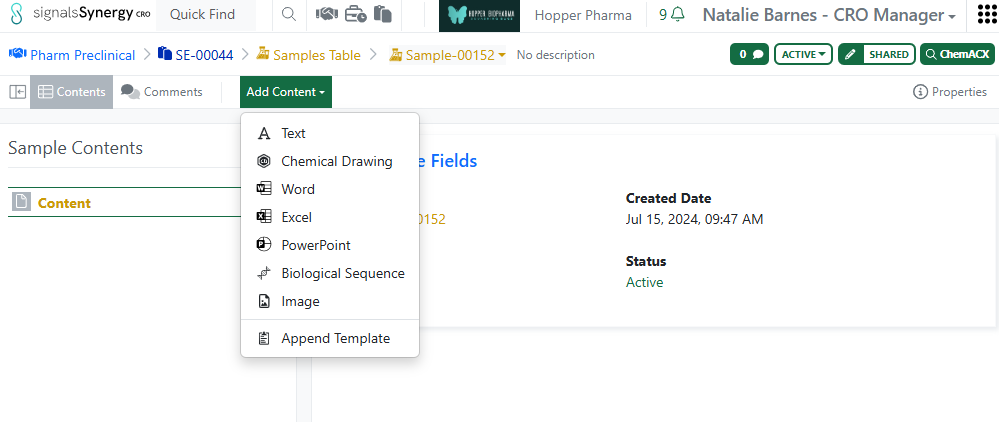
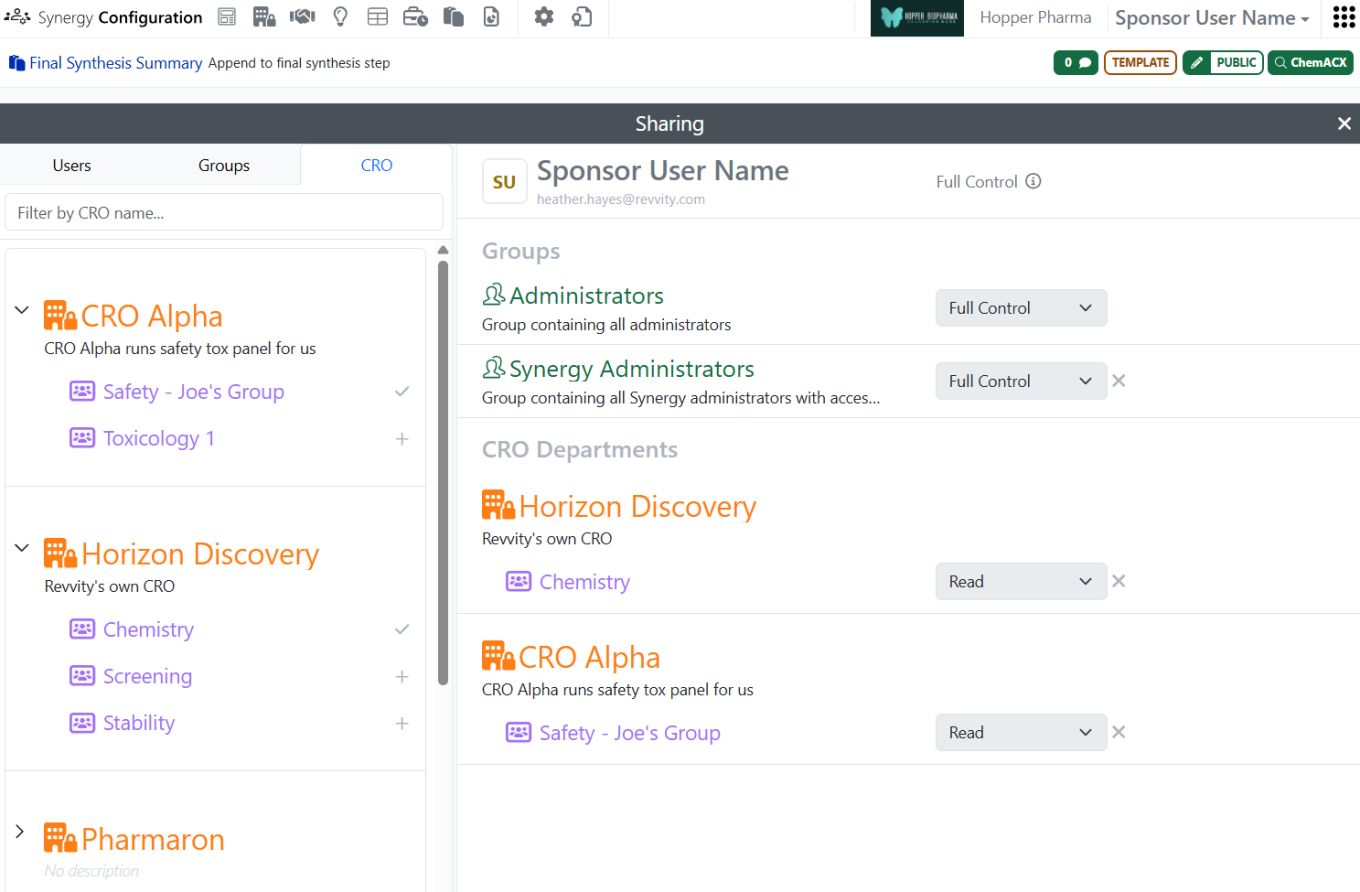
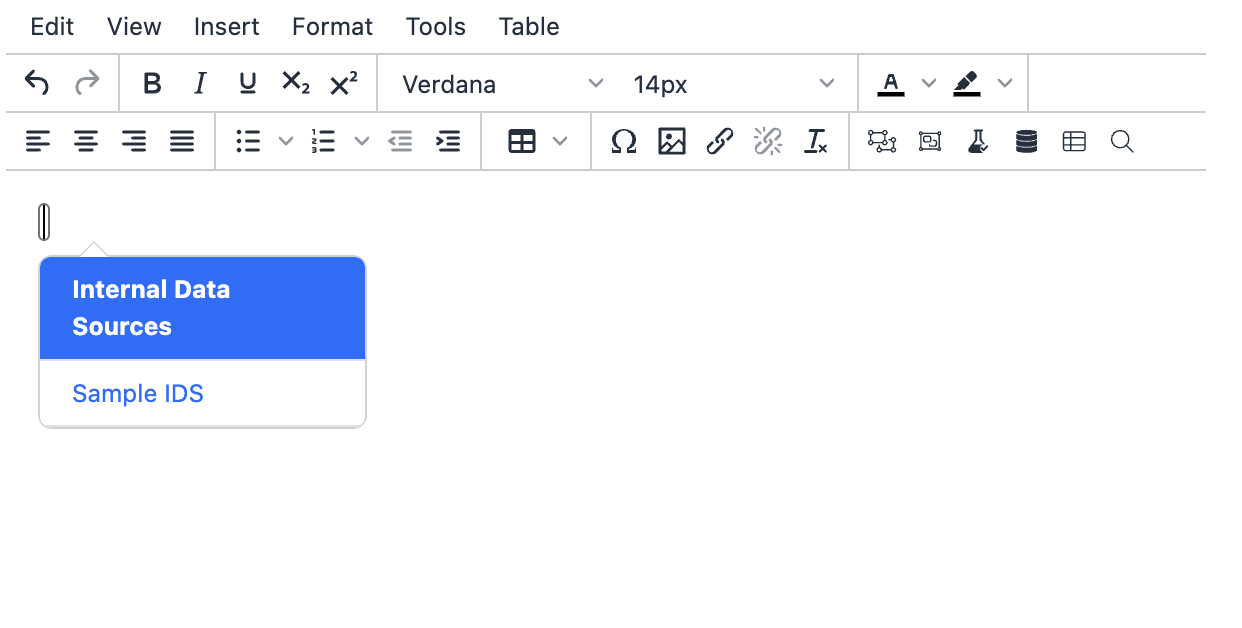
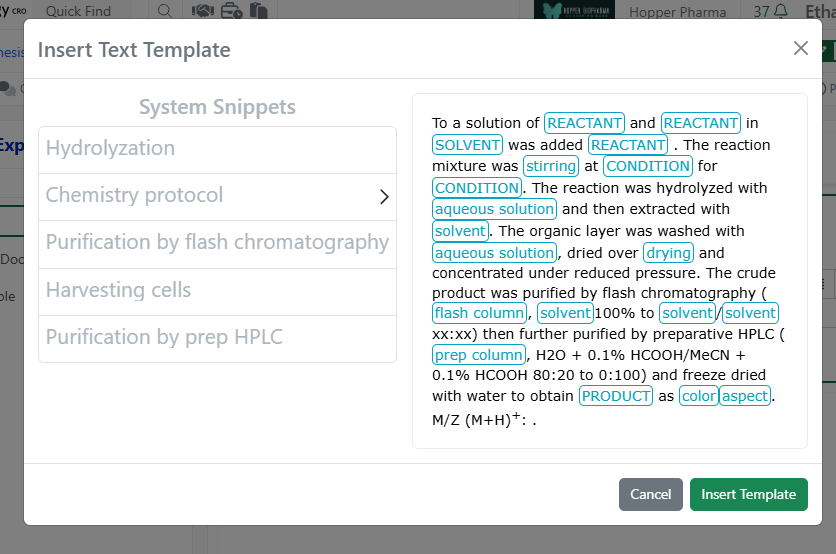
Finally, CRO users can now access and insert System Snippets using the Insert Text Template on any Text element. Note, CRO users cannot save text templates to avoid cluttering the template options for all users.
Chemistry

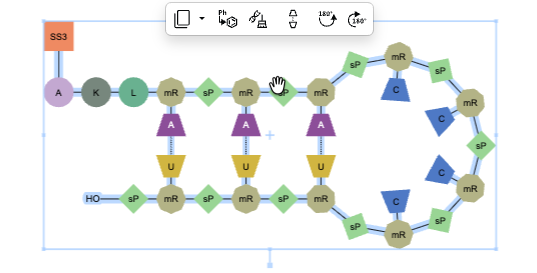
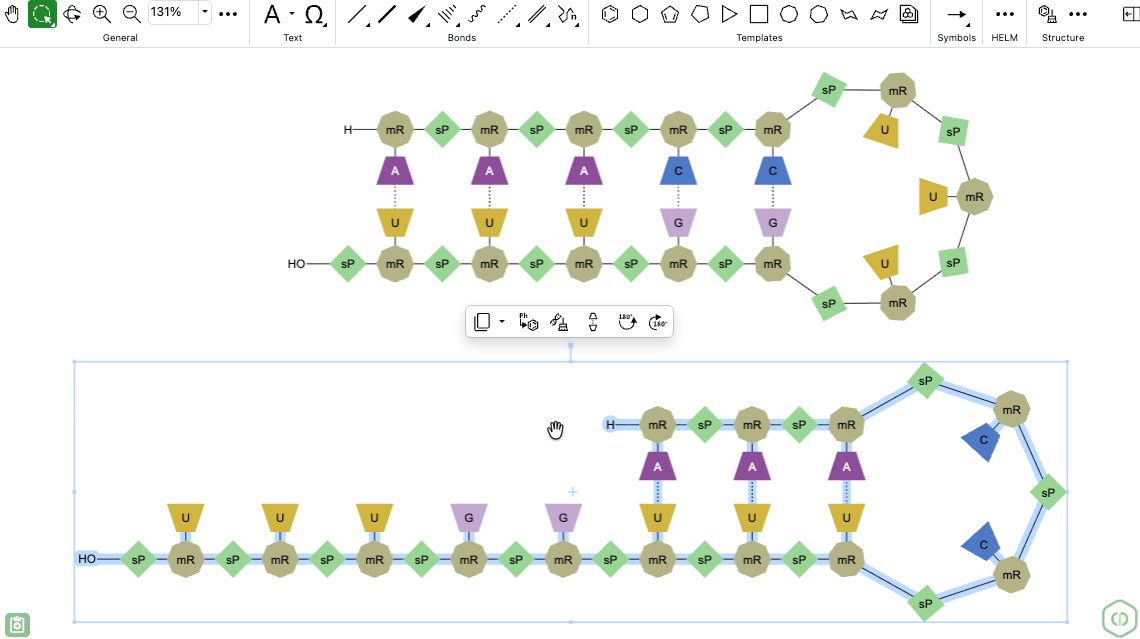
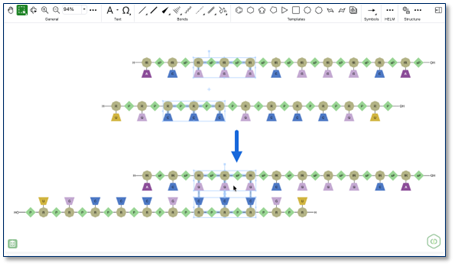
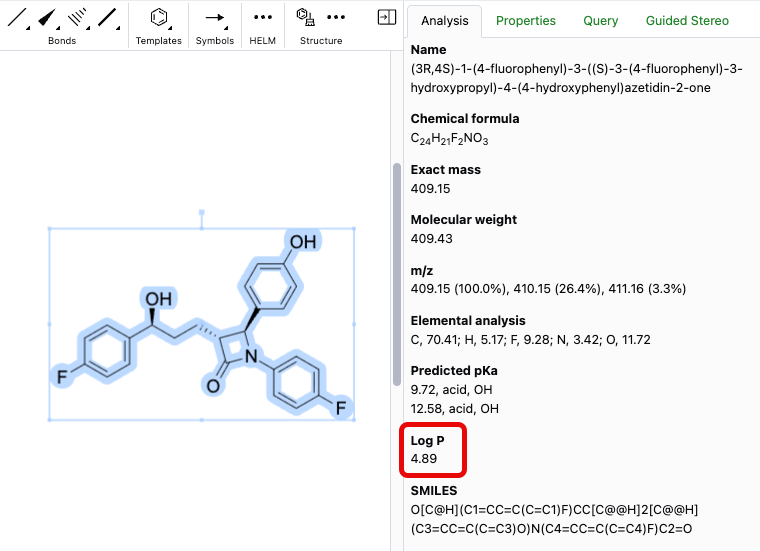
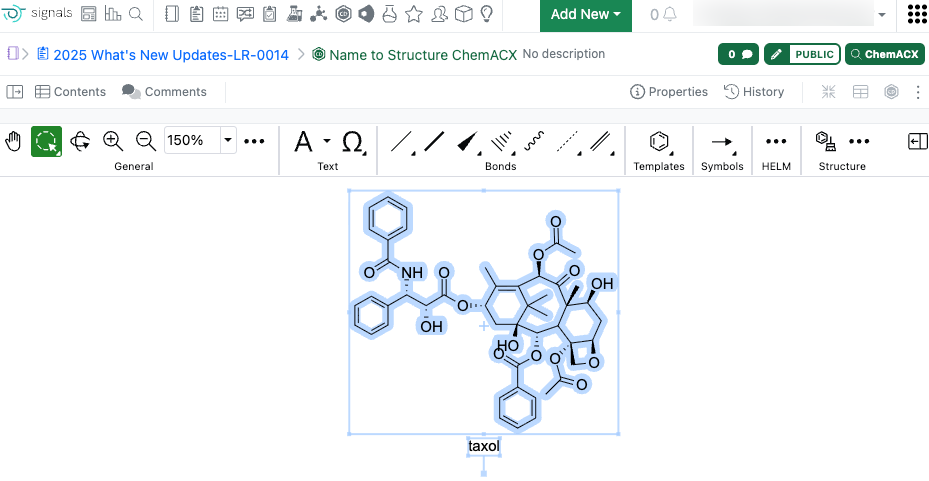
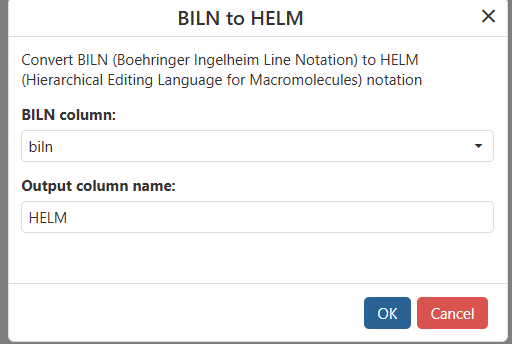
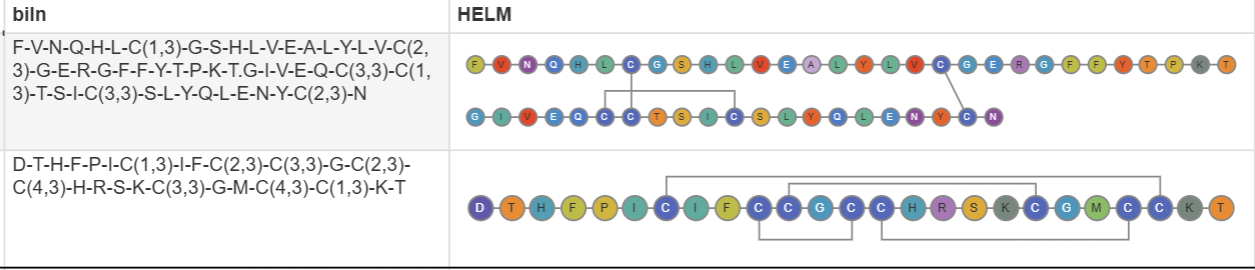
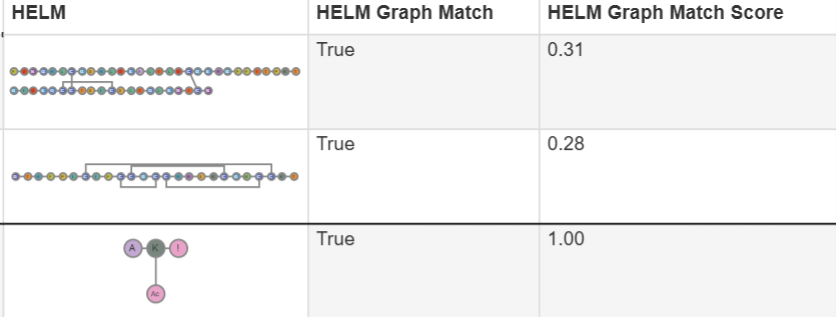
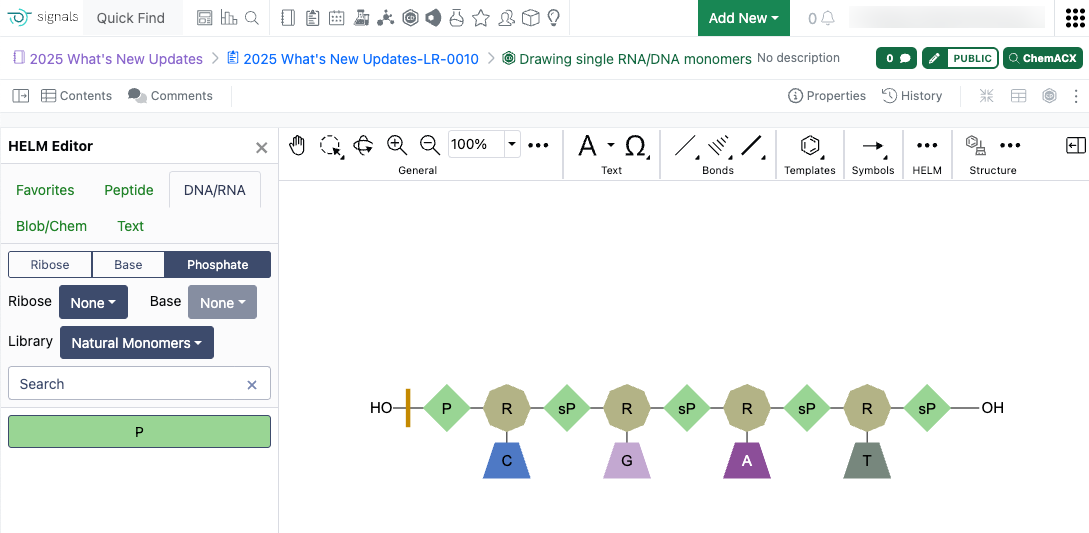
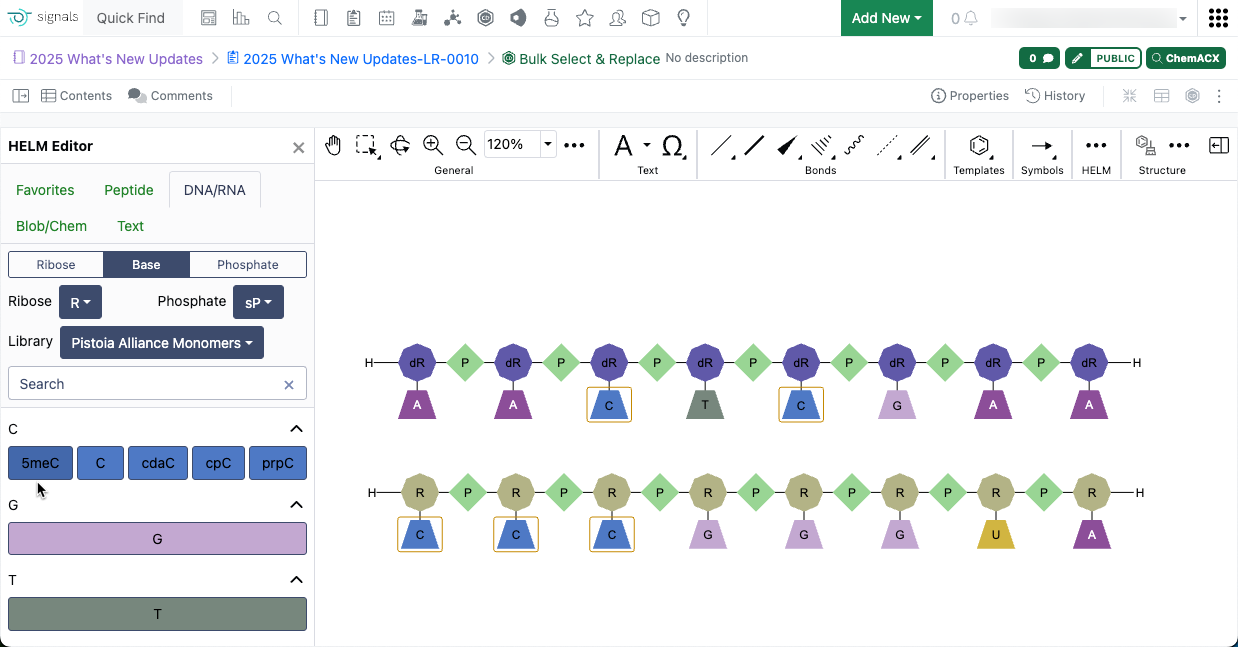
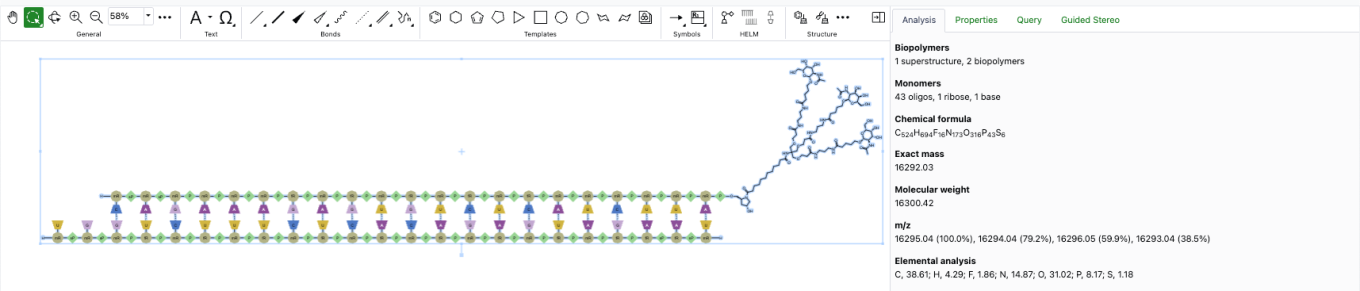
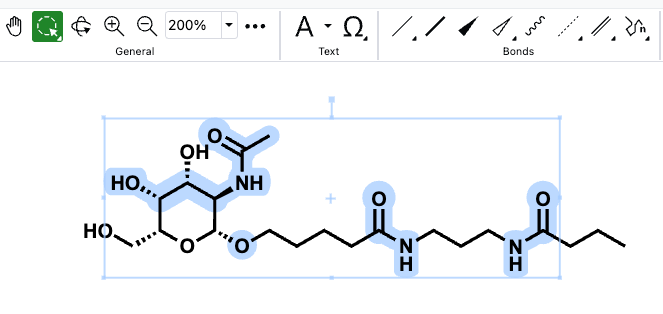
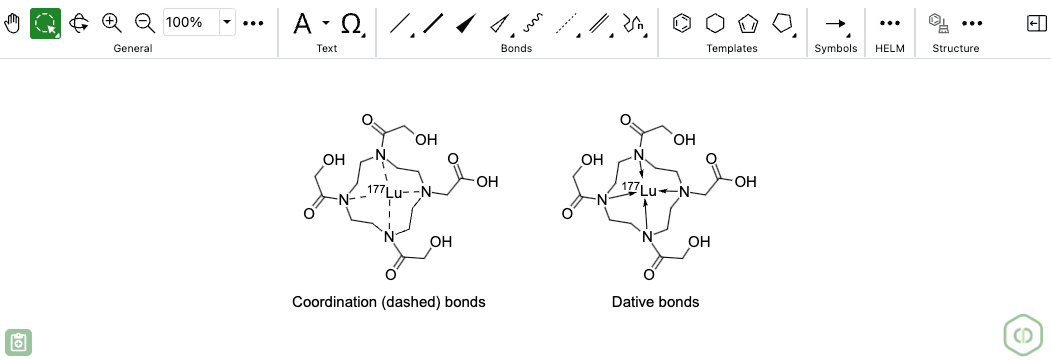
The ChemDraw editor now supports rendering and cleanup of multi-strand and branched complex biopolymers, making these structures easier to display in a clear, aligned, and readable layout.
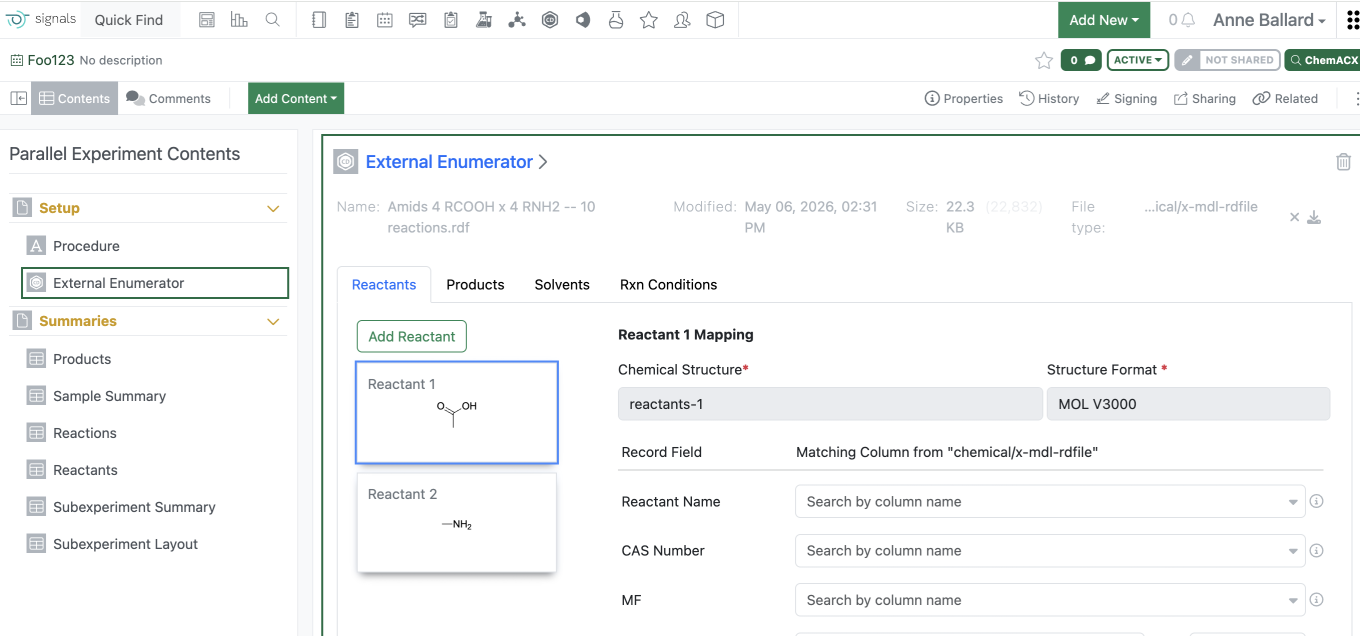
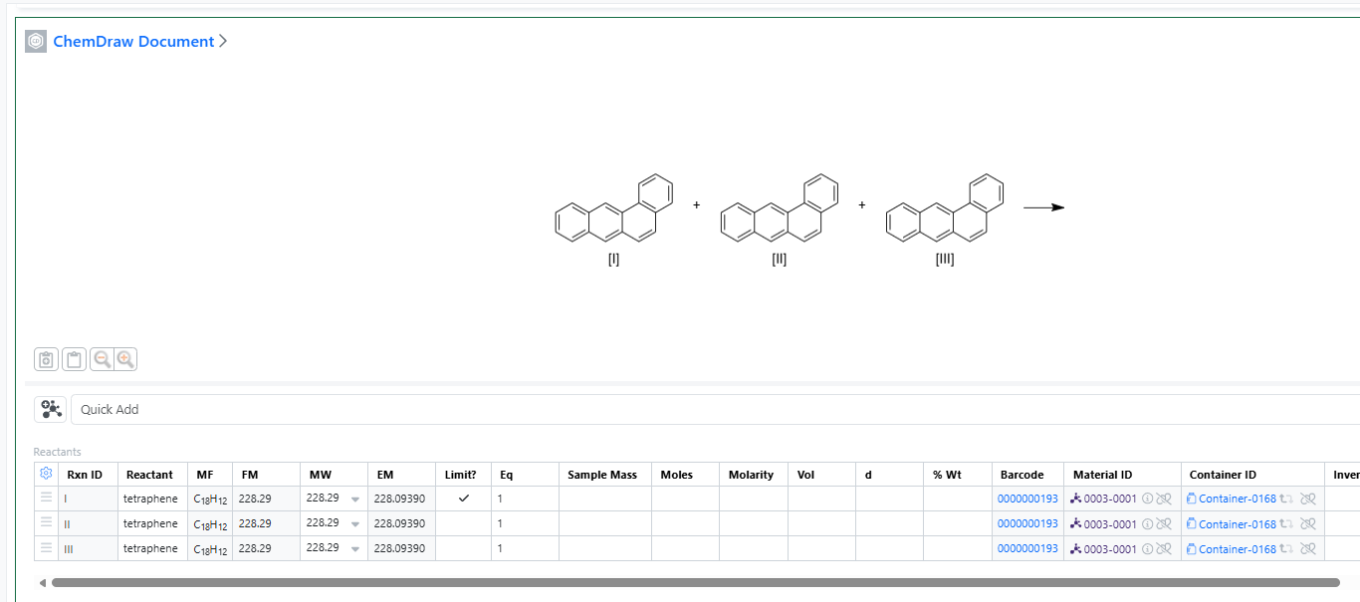
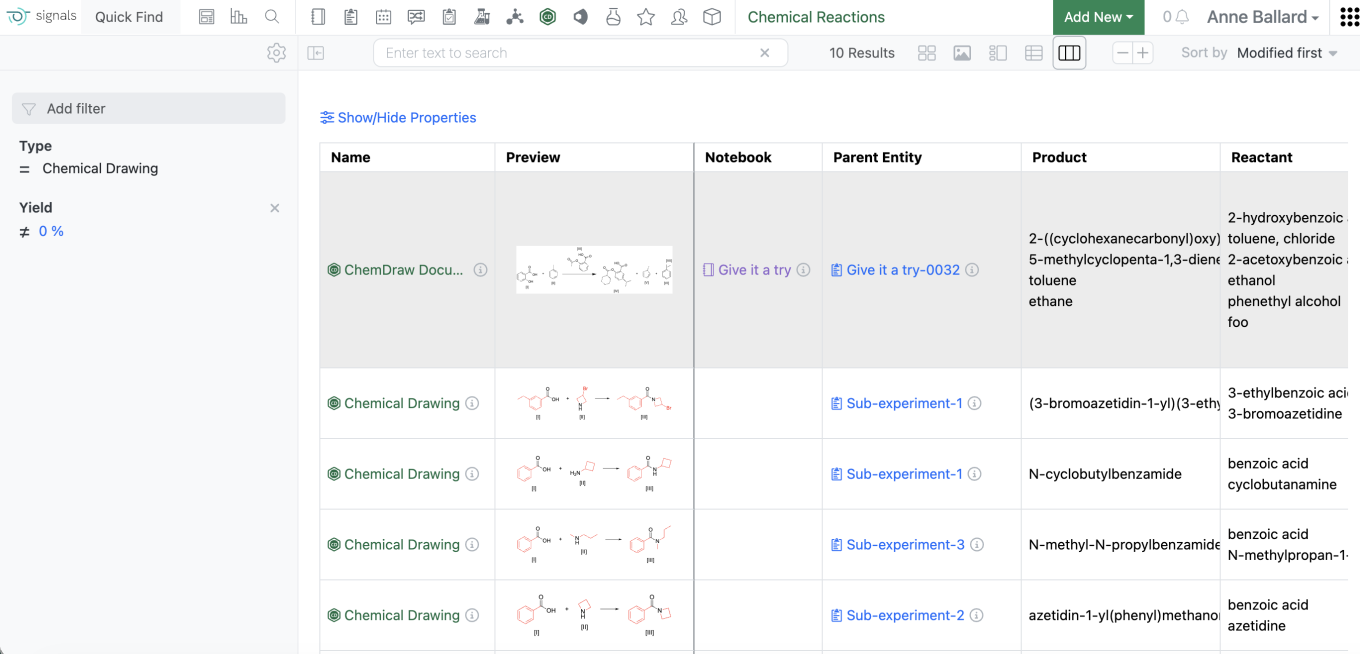
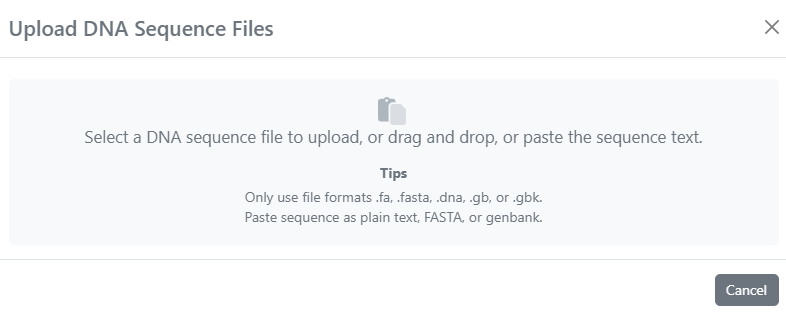
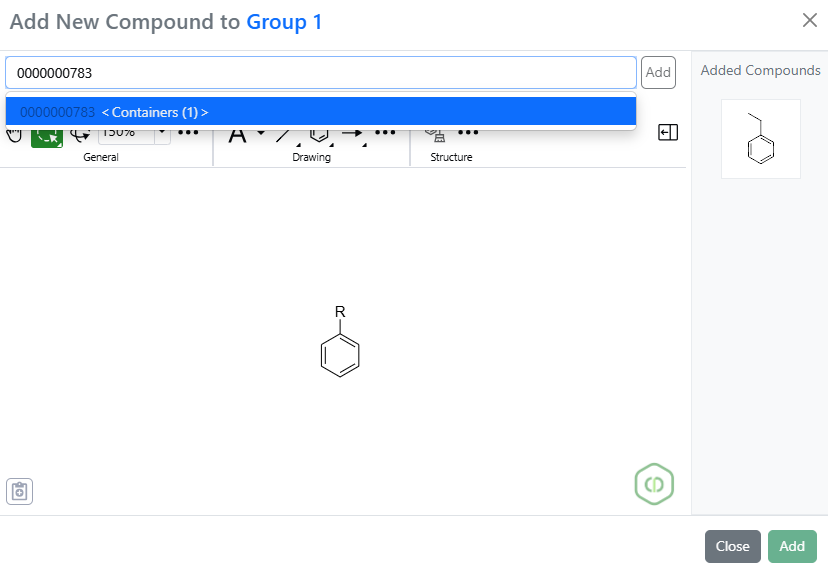
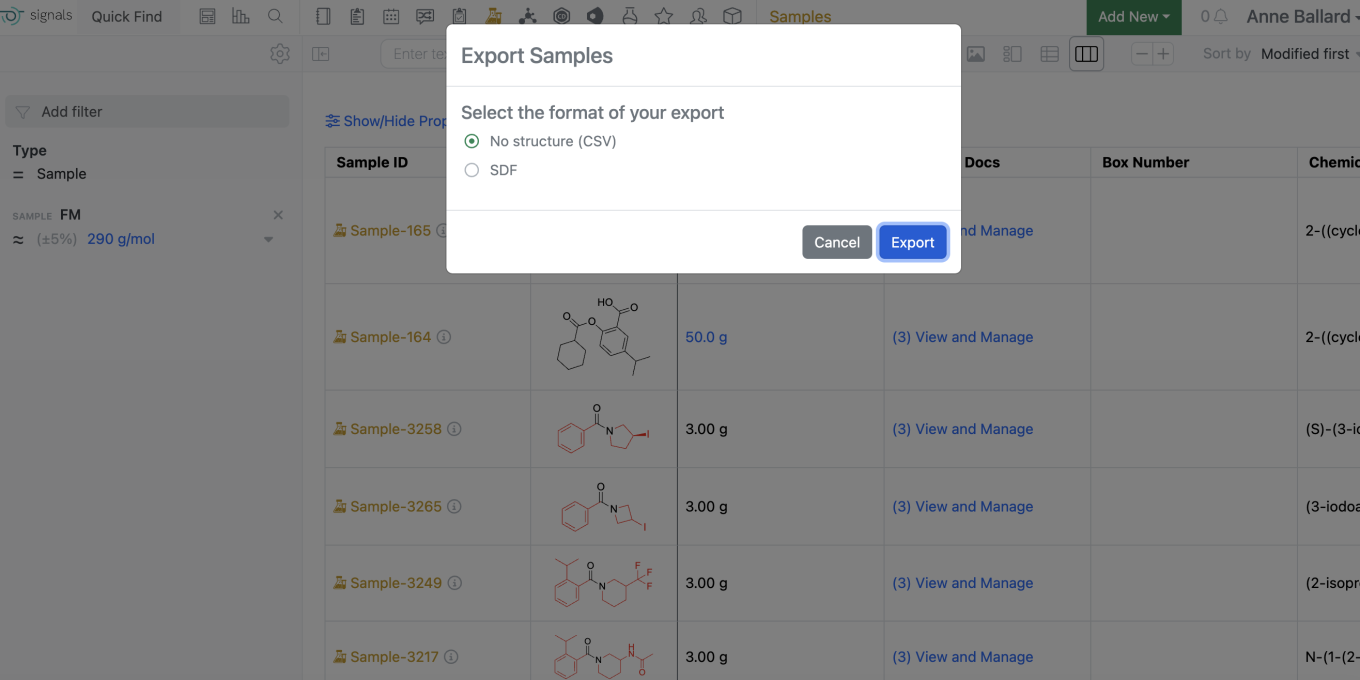
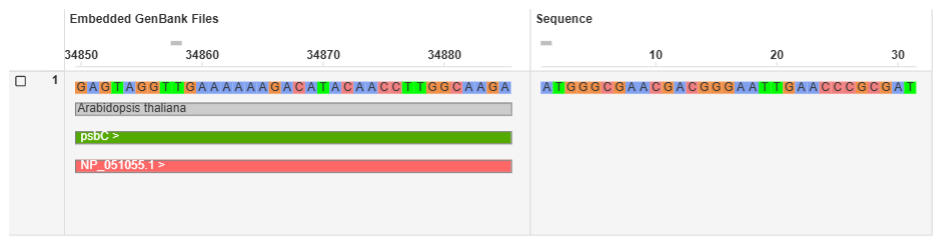
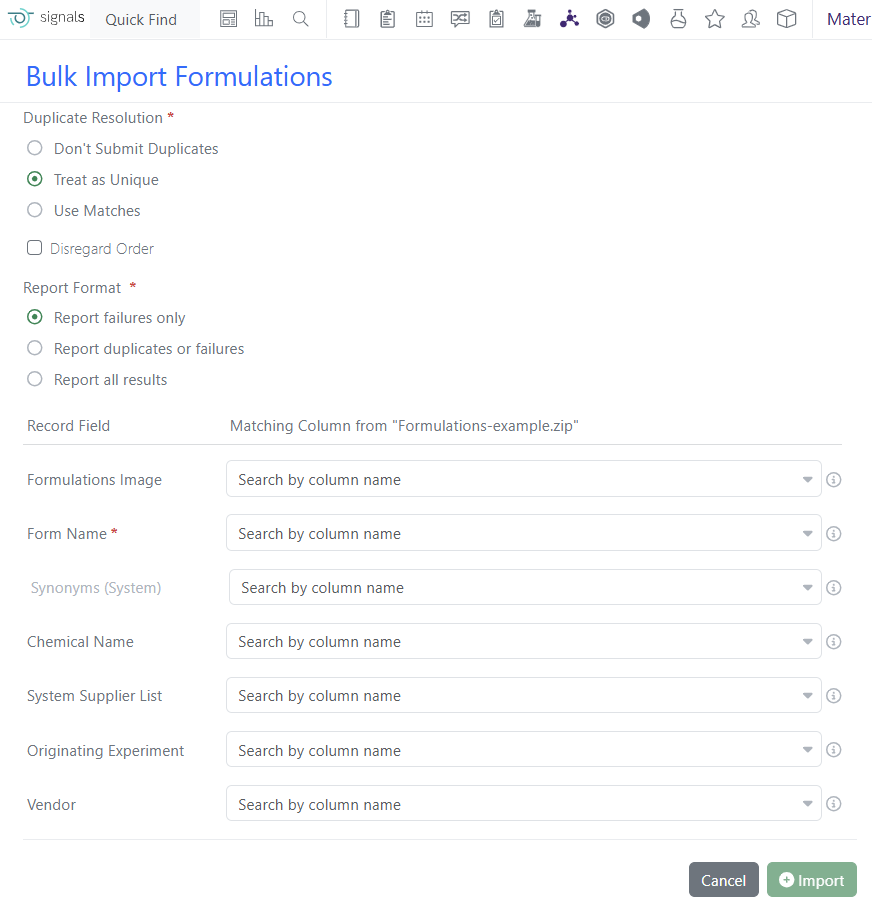
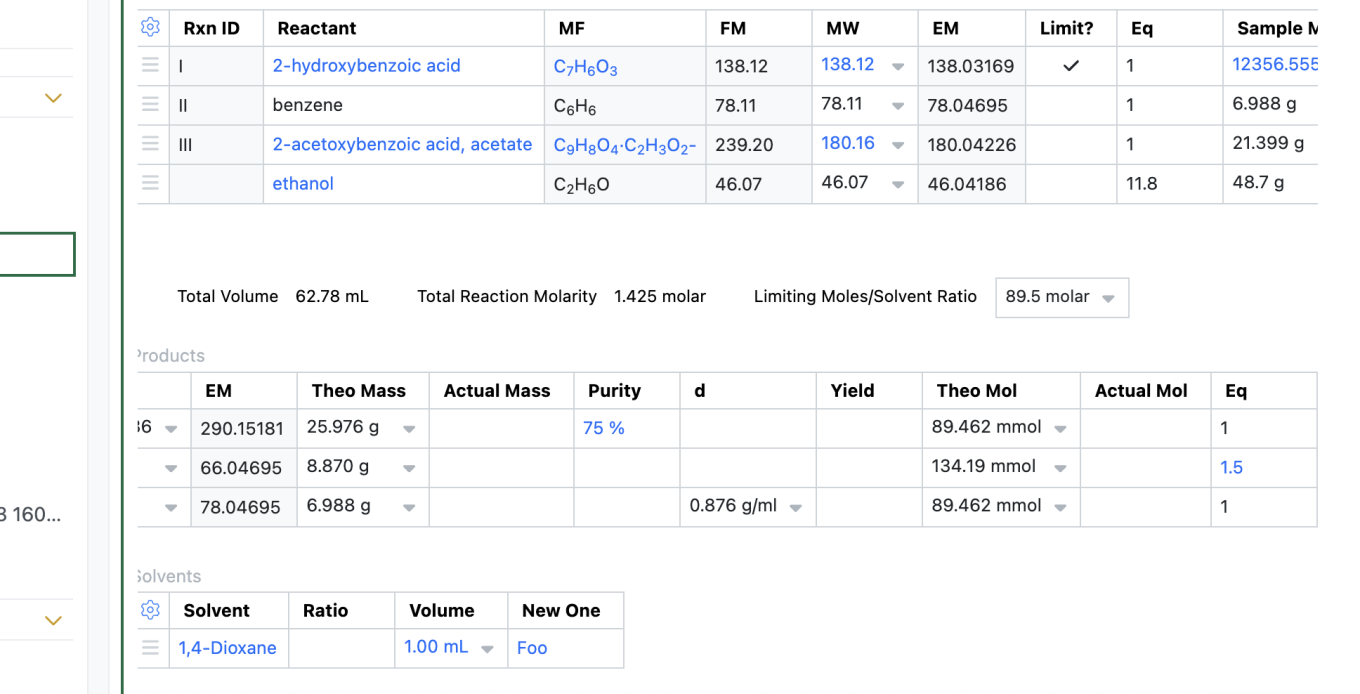
Users are now able to load an RDF type file into the External Enumerator for Parallel Experiment enumeration. Fields within the rdf can be mapped into the external enumerator. Reactant order is defined by the rdf file. Solvent and Rxn Conditions are not commonly included in the rdf file and therefore will need to be added manually.
Additional reactants or products can be added manually similarly to what can currently be managed.
Tables
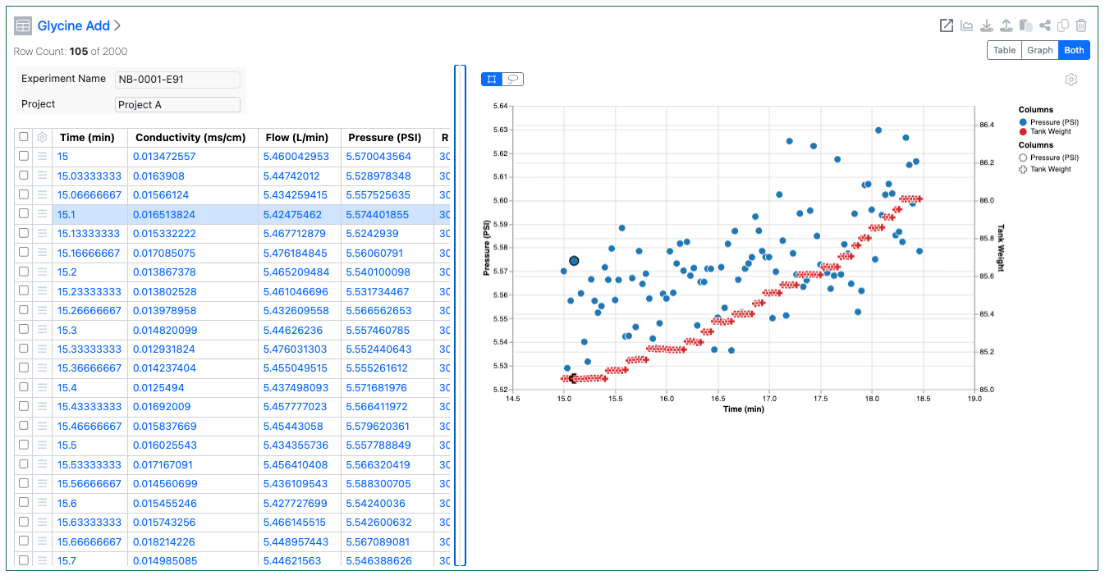
Scatter Plots are now available to all tenants. End users require a Signals One license to view and edit charts in ADTs.
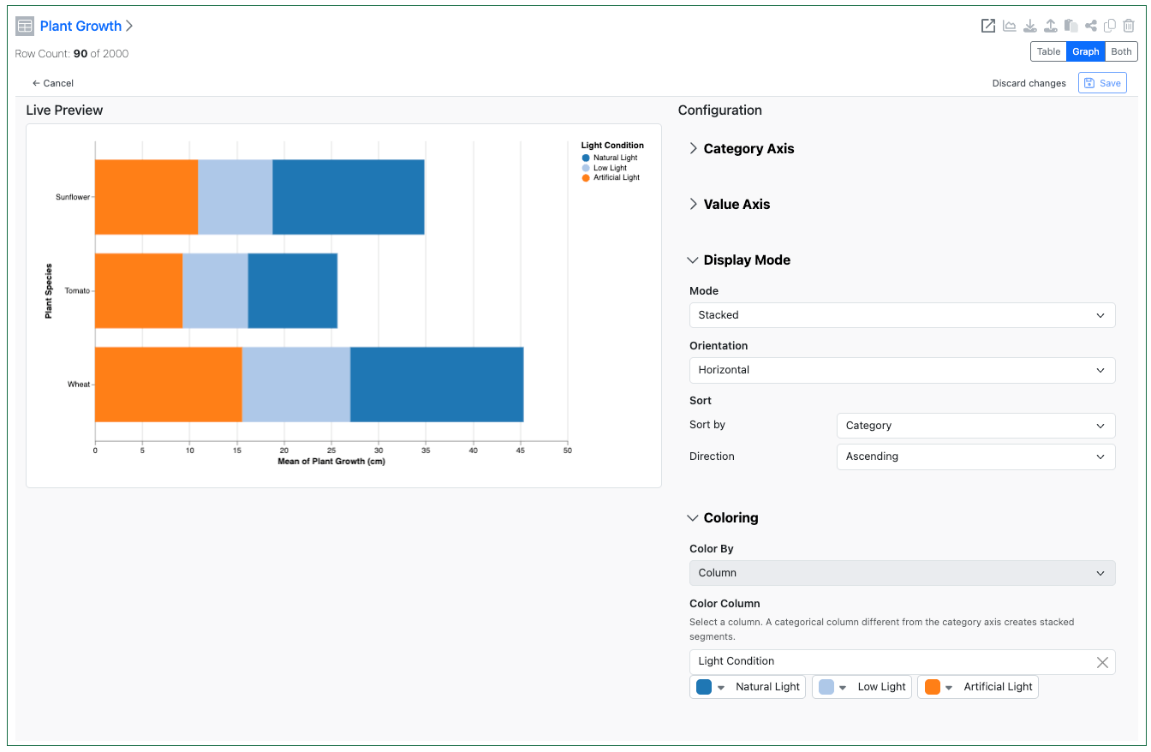
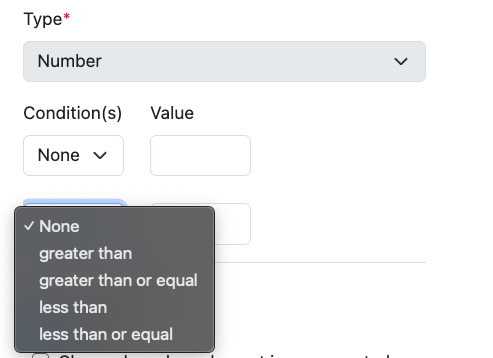
Configuration Administrators can now choose to define a Bar Chart on Admin Defined Tables. Similar to the definition of Scatter Plots, administrators can define the Bar Chart on the Table template including setting properties for the value and categorical axis. The chart can be a simple, stacked or 100% stacked bar chart and can be displayed vertically or horizontally. The admin can also choose if the end user is able to adjust the settings for the chart.
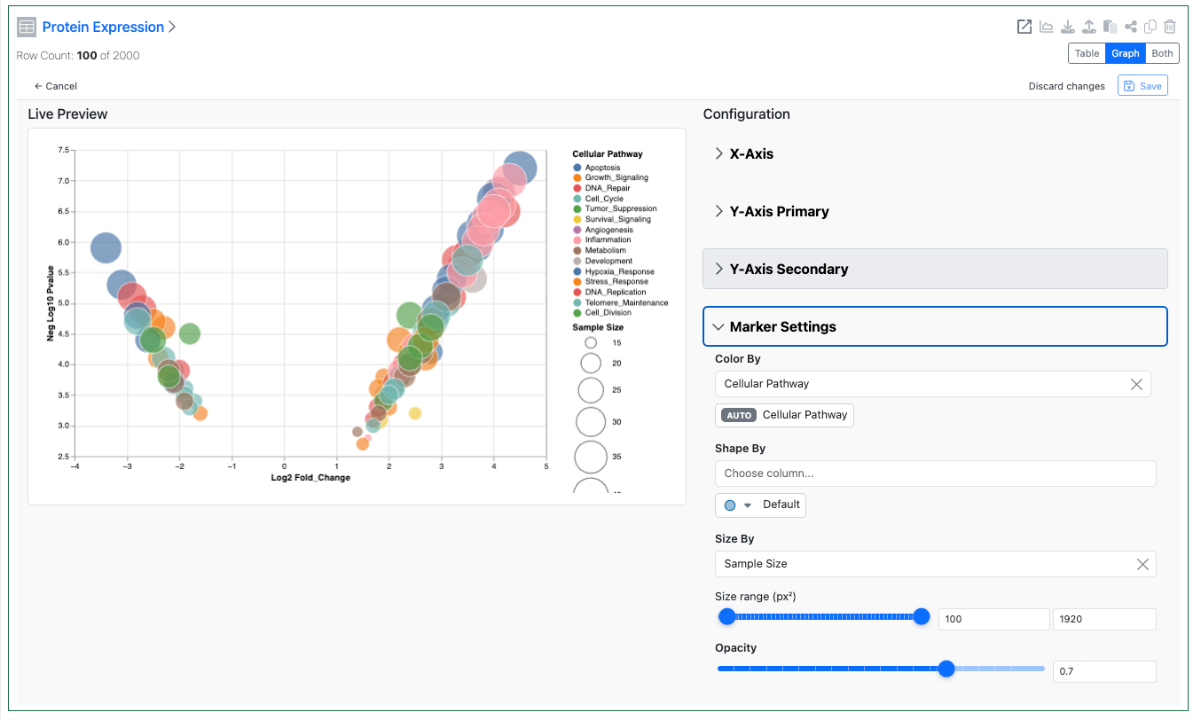
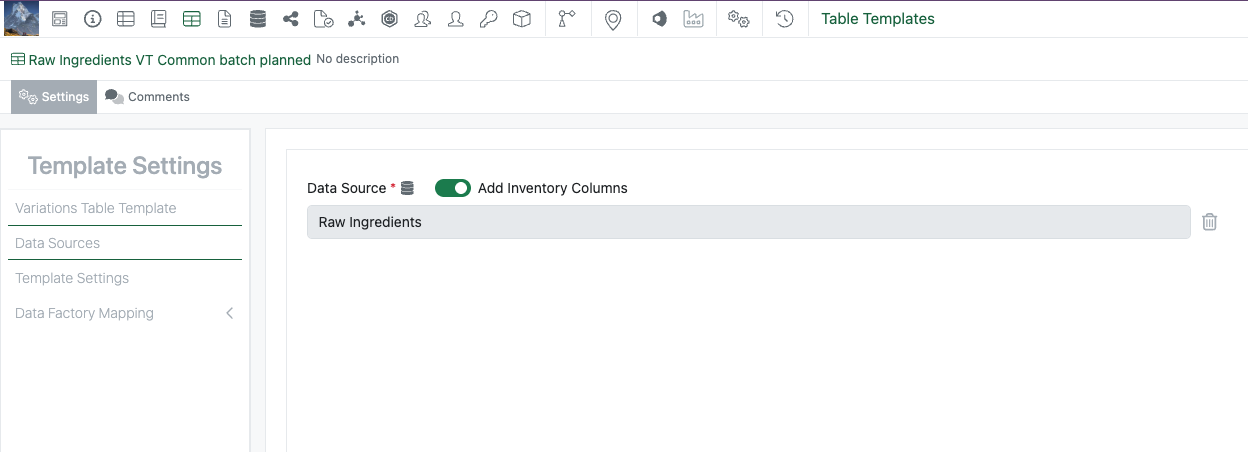
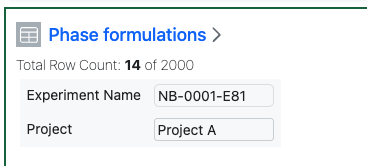
Configuration administrators can also now define a Size By and an Opacity setting for Scatter Charts. These two settings allow for the creation of Bubble Charts using the Scatter Chart type. If the end user is allowed to change chart settings these options are also available directly within the Admin Defined Table.
Inventory

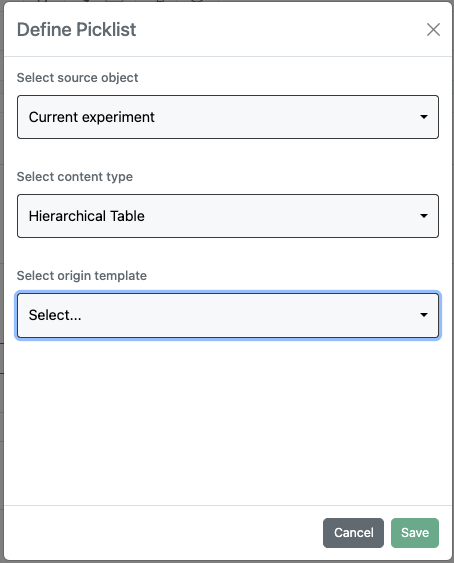
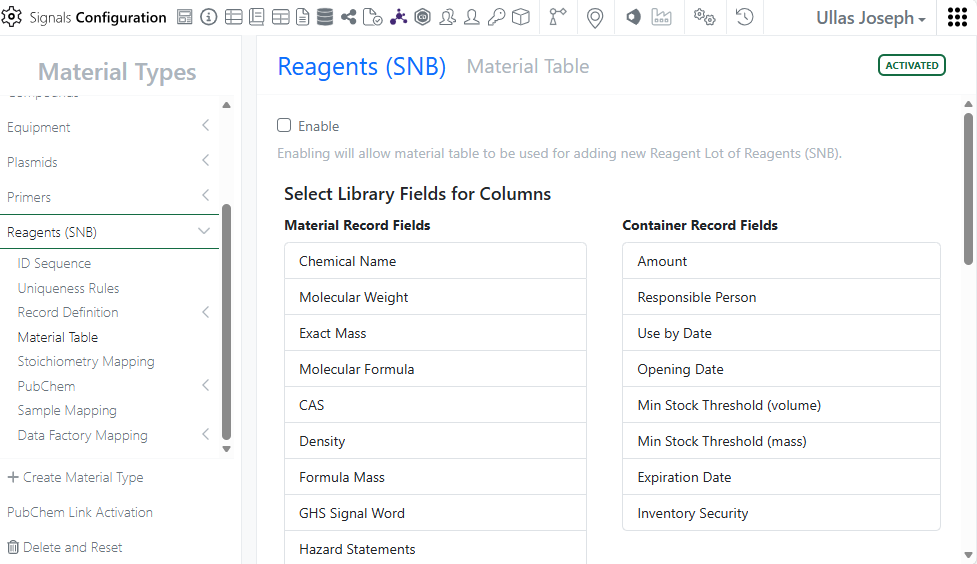
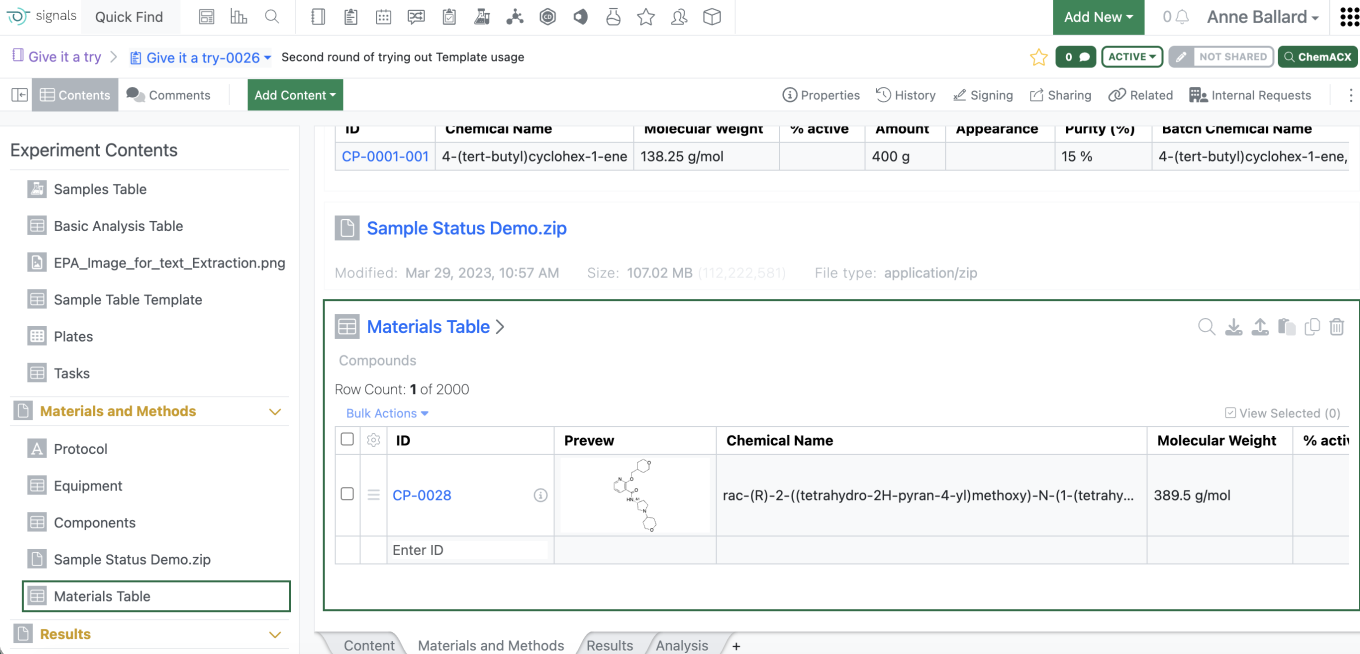
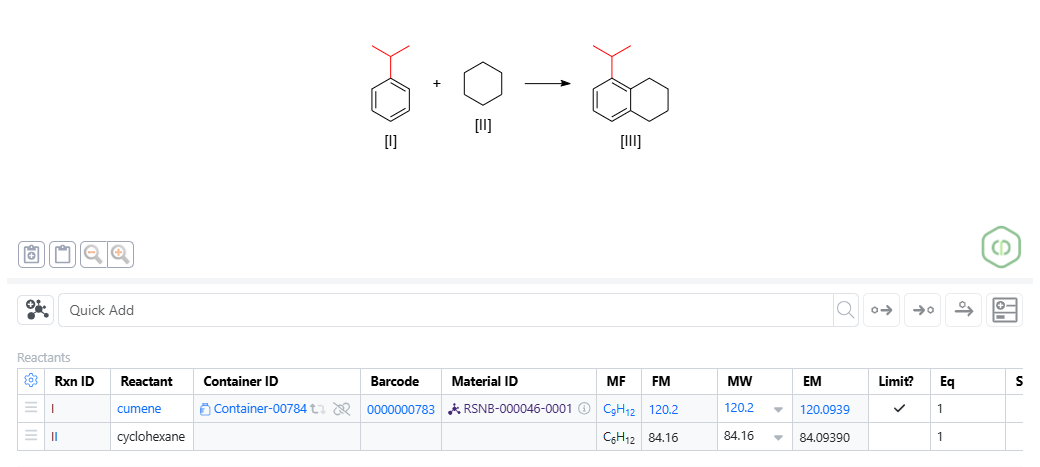
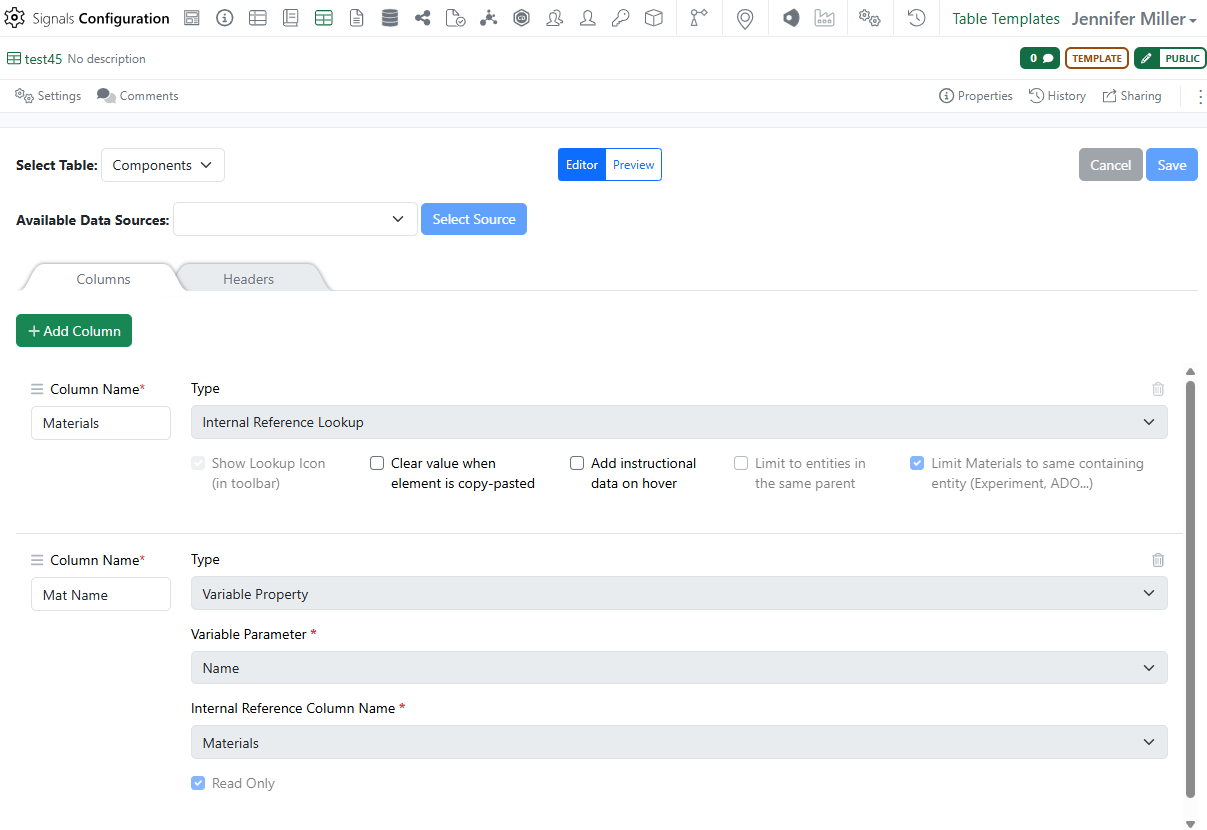
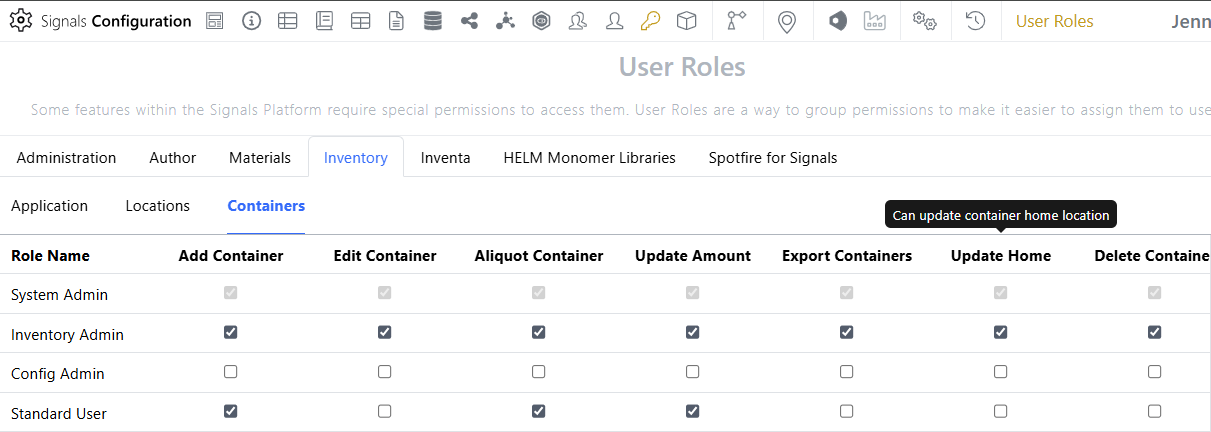
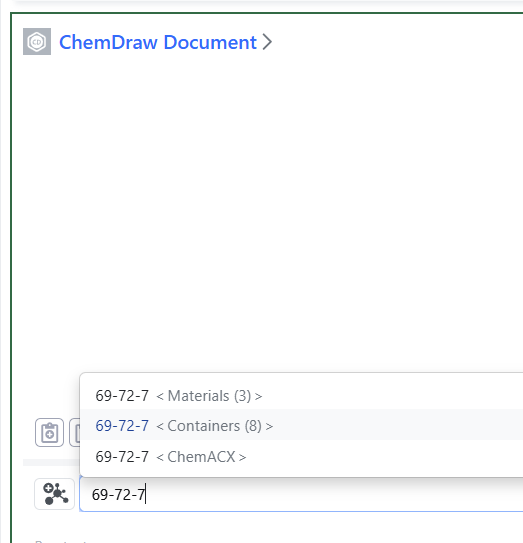
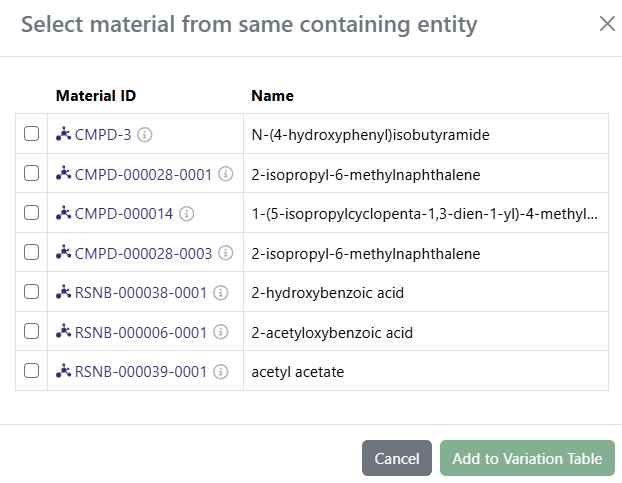
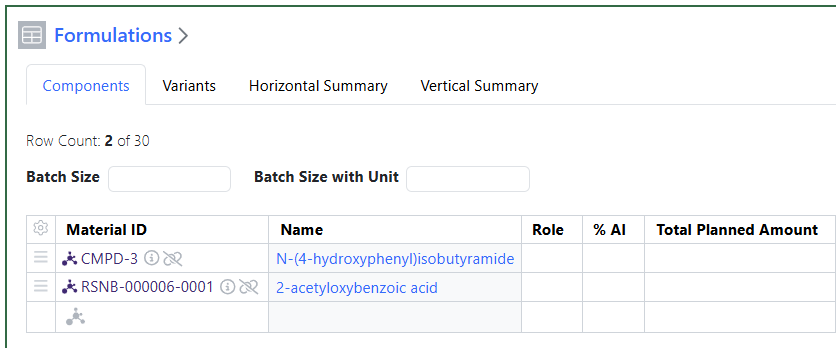
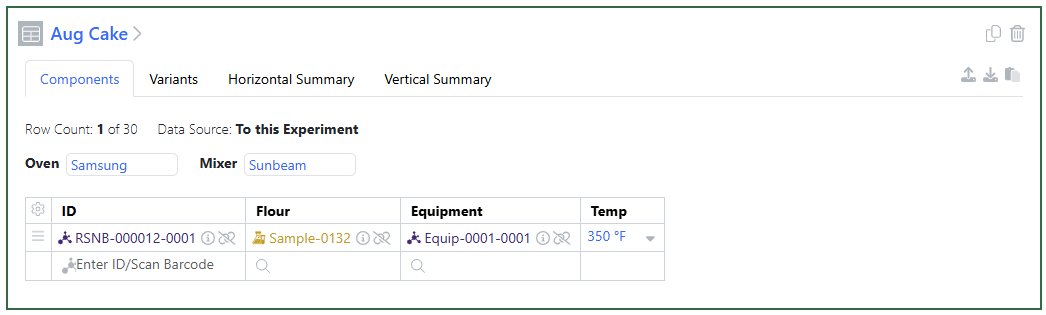
Users with the right permissions can now assign or reassign containers in cloned or pre-defined experiments, even after container details are cleared, enabling more flexible and accurate inventory workflows in Reagent table.
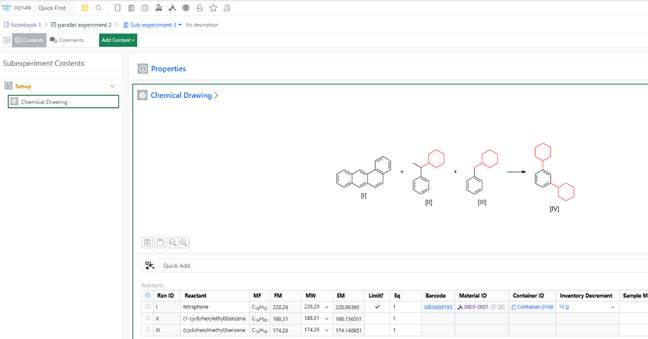
Inventory Decrement can now be entered at the sub‑experiment level, allowing users to accurately update container usage when working with parallel, cloned, or reagent‑specific sub‑experiments.

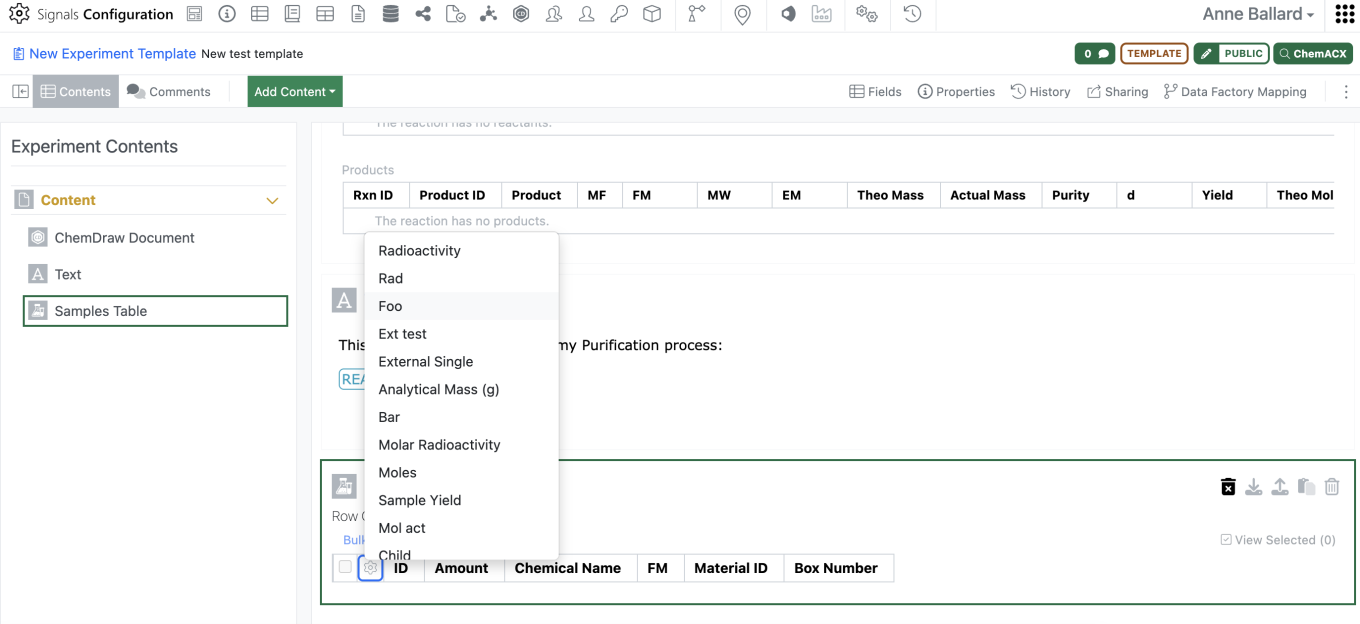
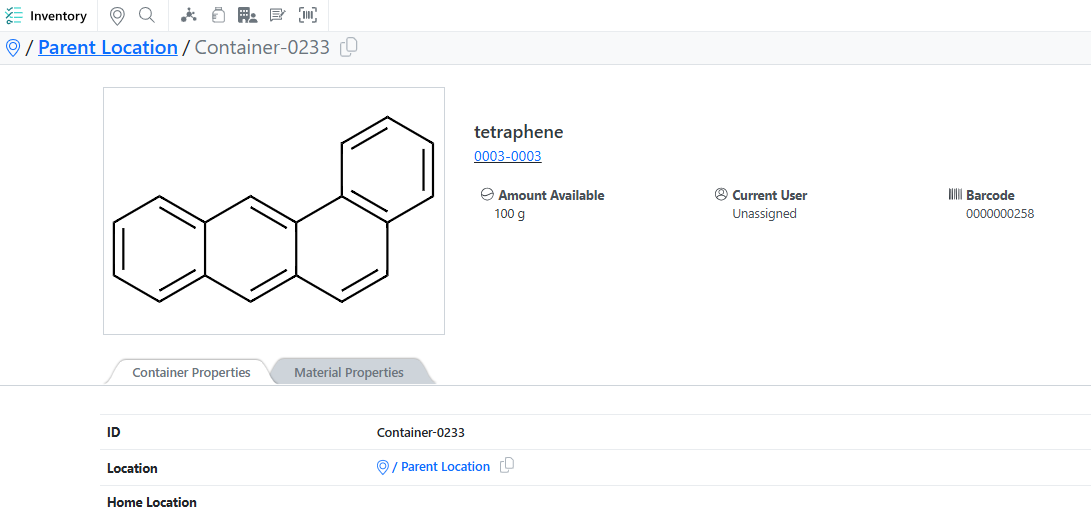
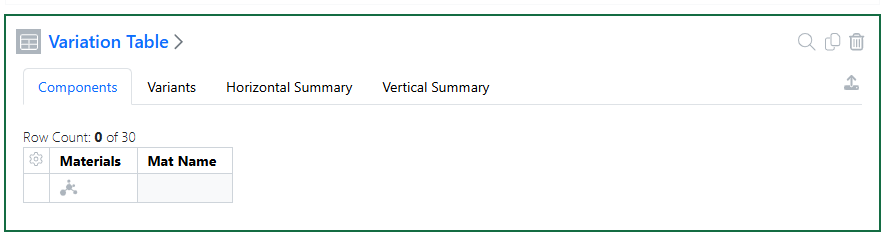
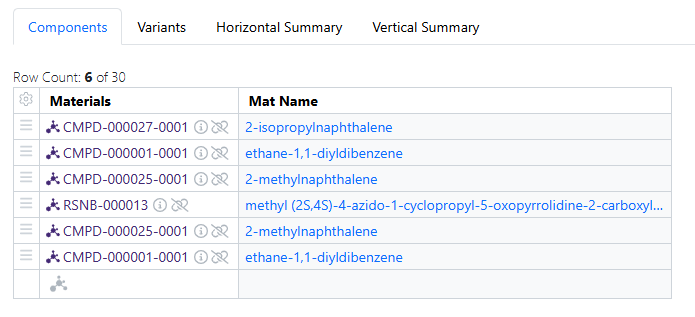
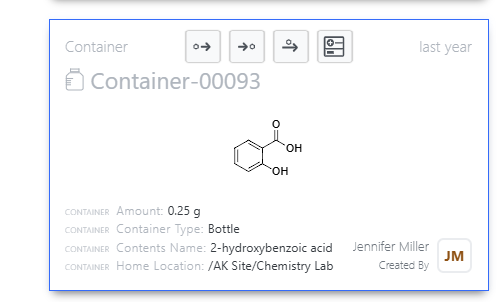
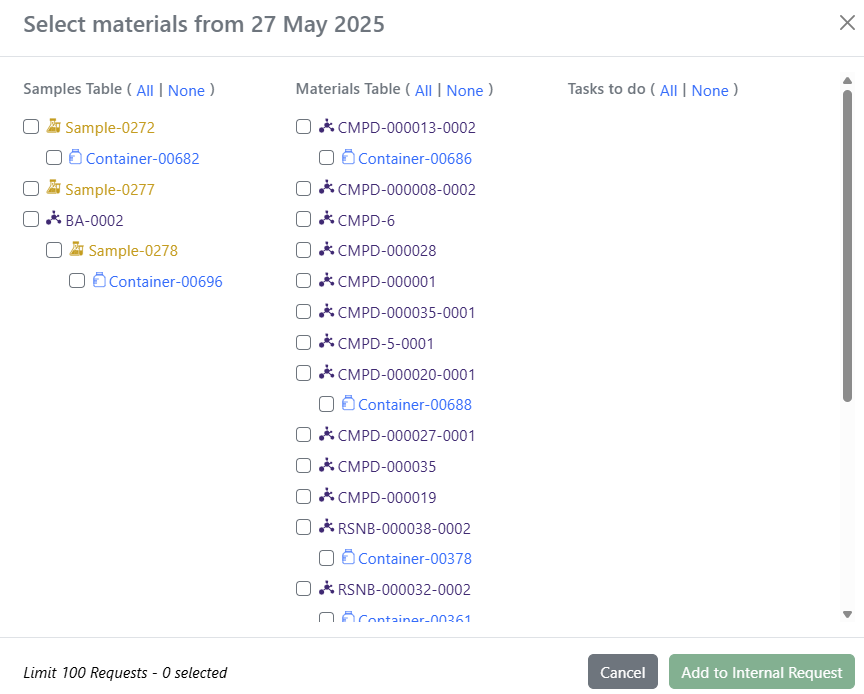
Container details are now accessible from the Samples table even when a Material ID is provided, ensuring consistent visibility across sample workflows.
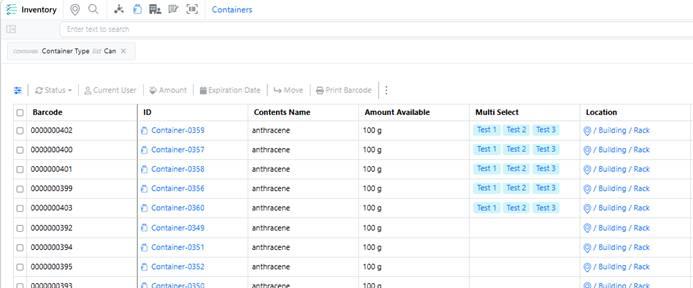
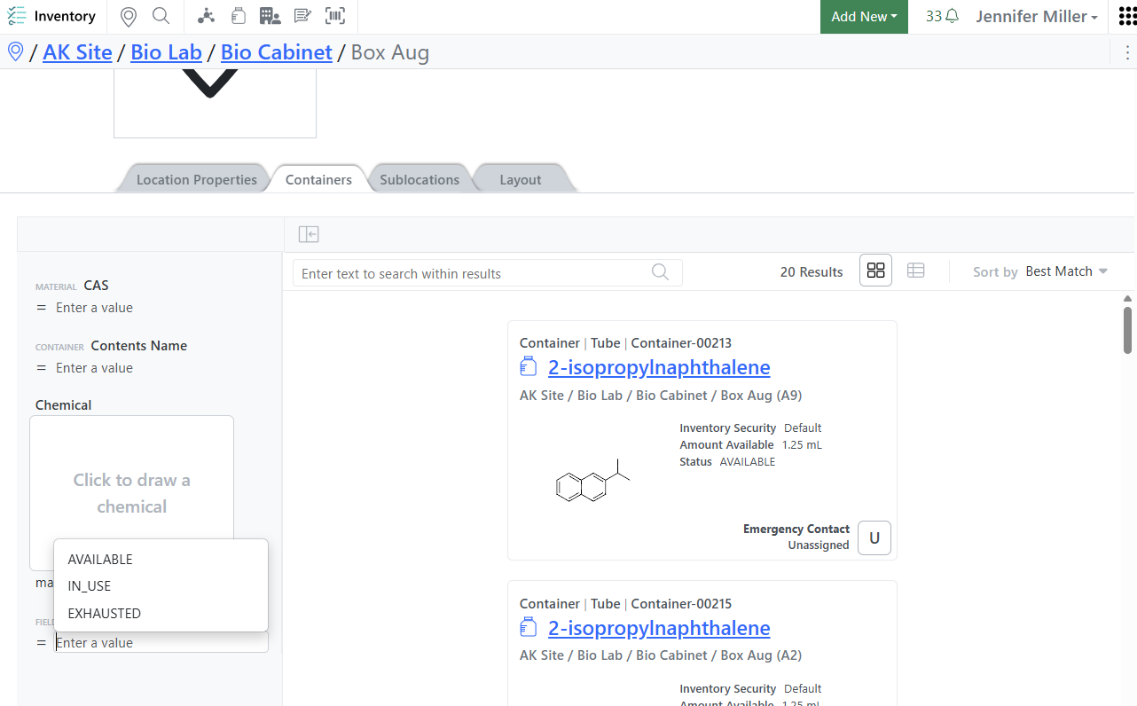
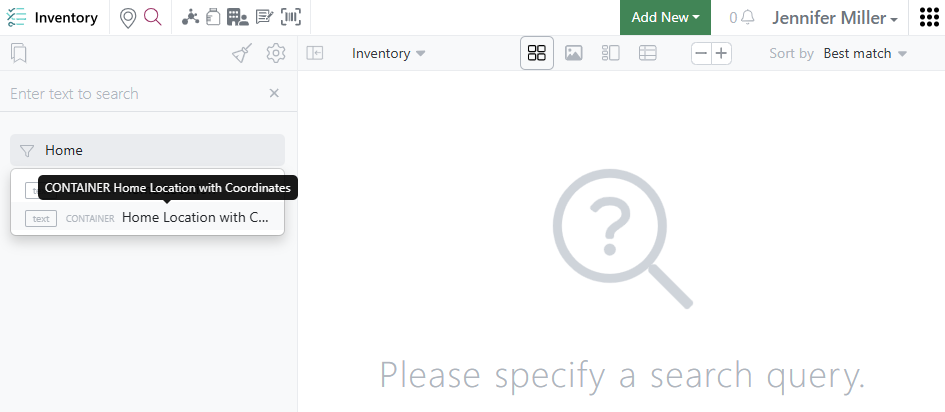
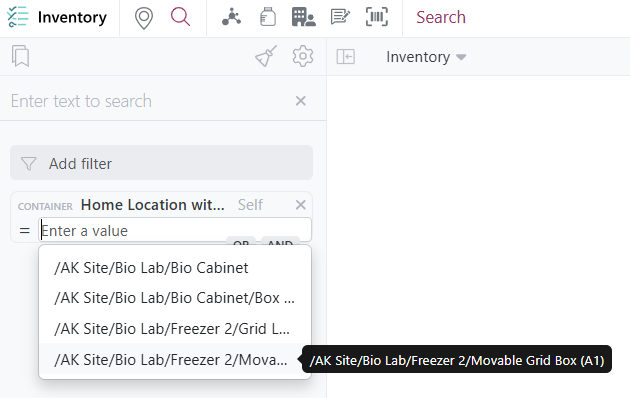
Container multi‑select properties are now available in the Container table, allowing users to view multi‑select container properties directly from the inventory view.
InventoryGo
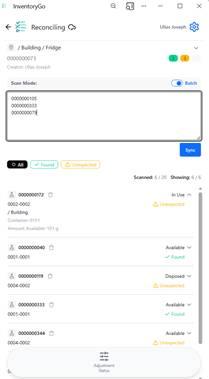
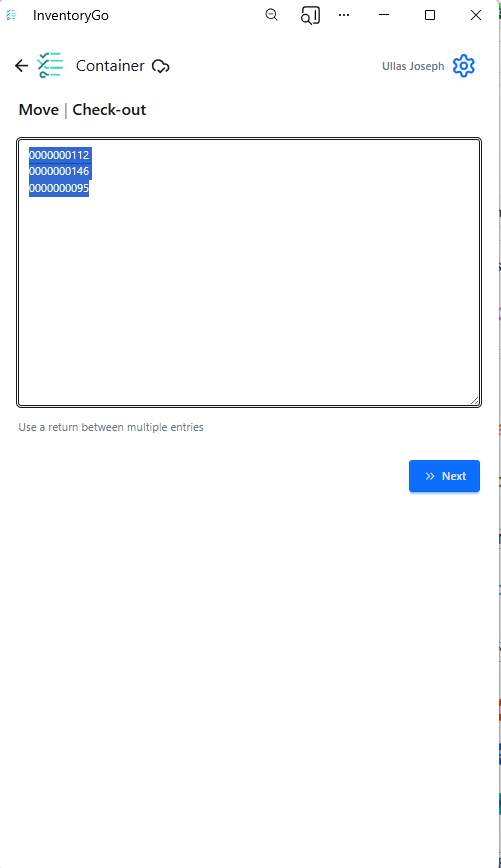
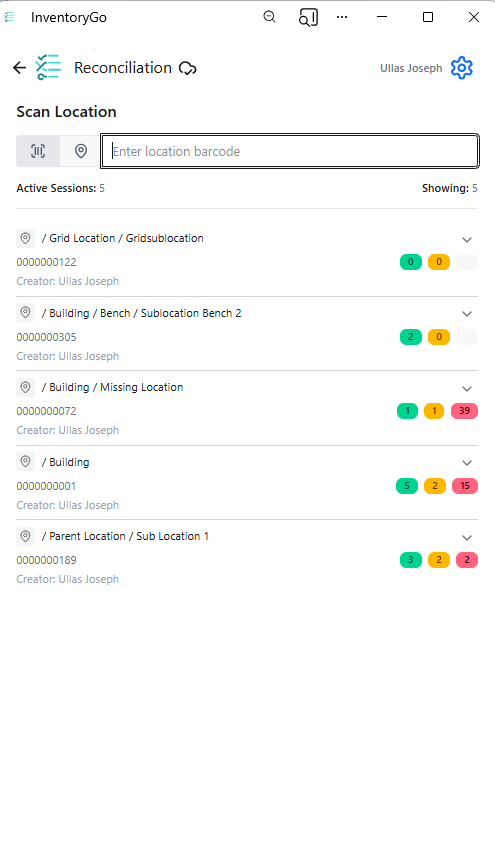
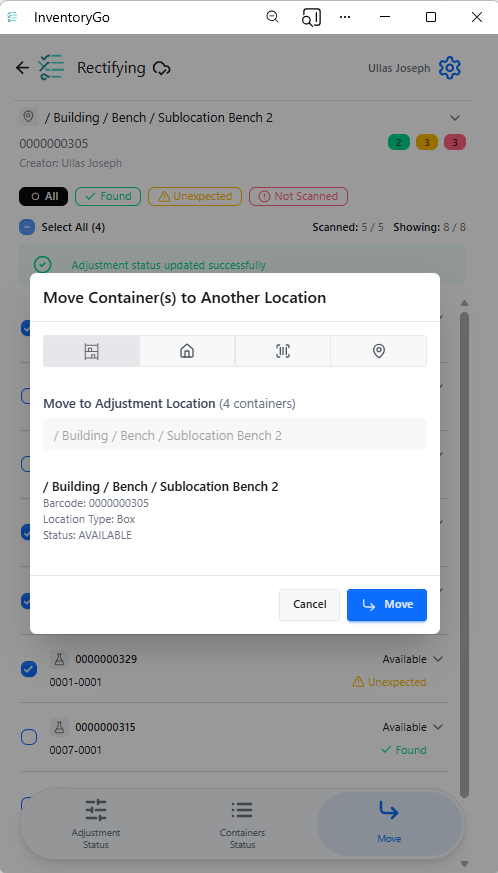
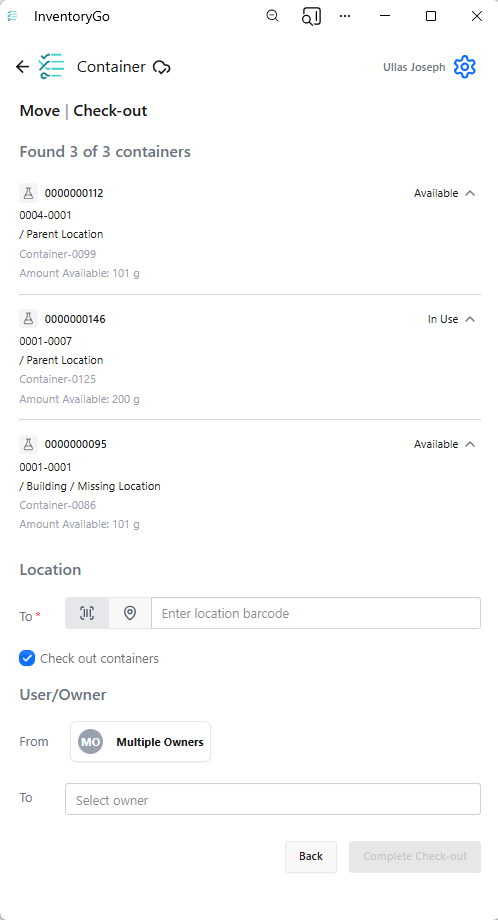
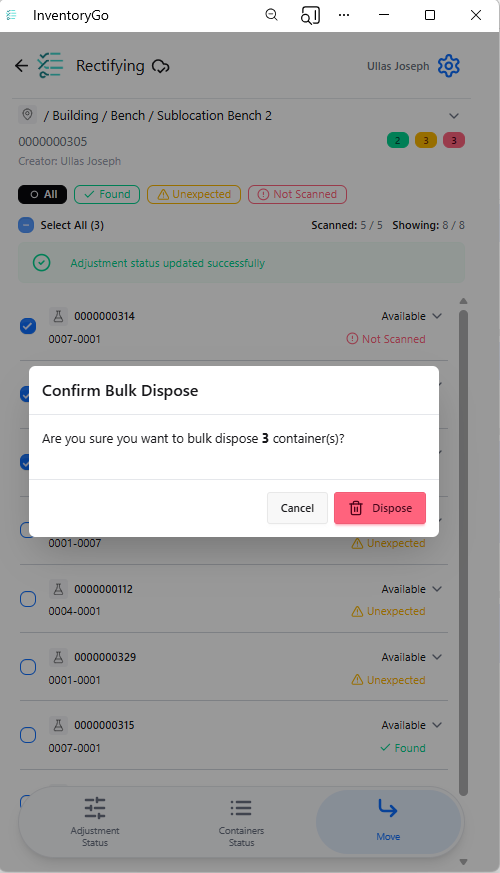
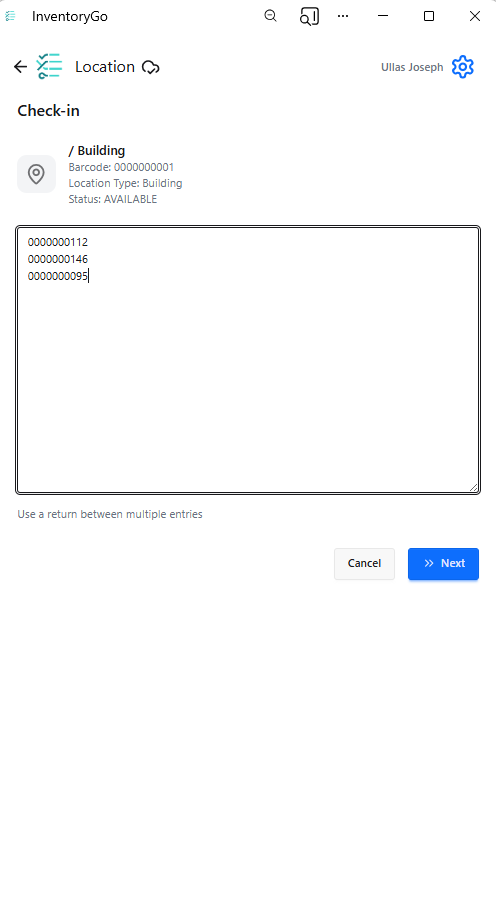
A new Scan List mode has been added to reconciliation, allowing users to scan containers in bulk and fetch results on demand, with a toggle to switch between batch and individual scanning for more reliable and faster workflows.
Administration
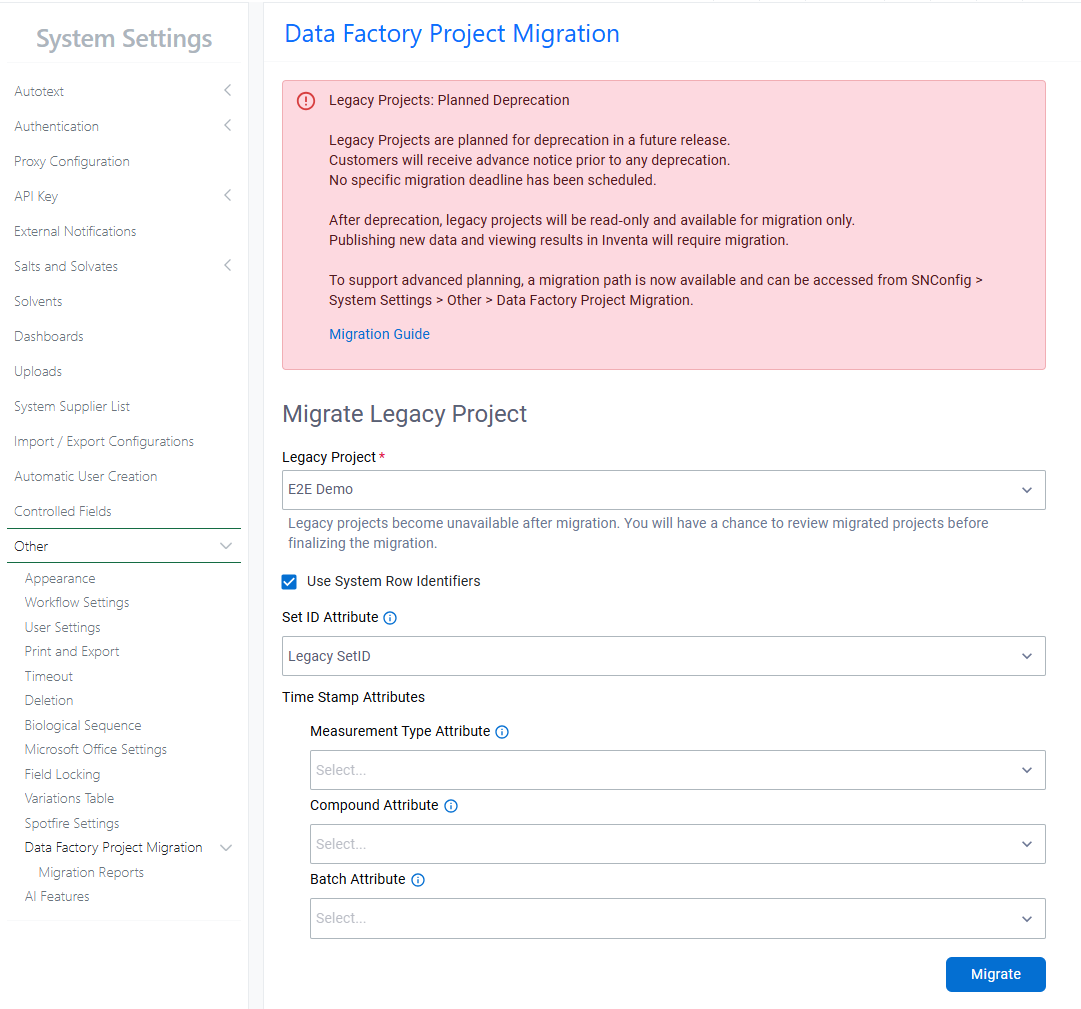
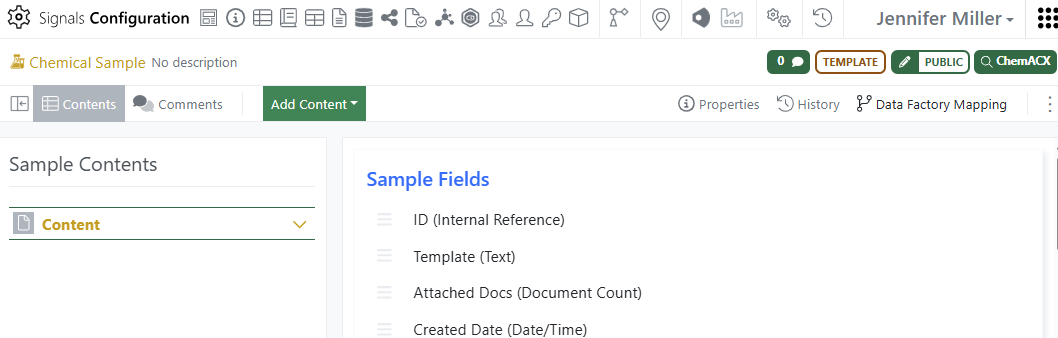
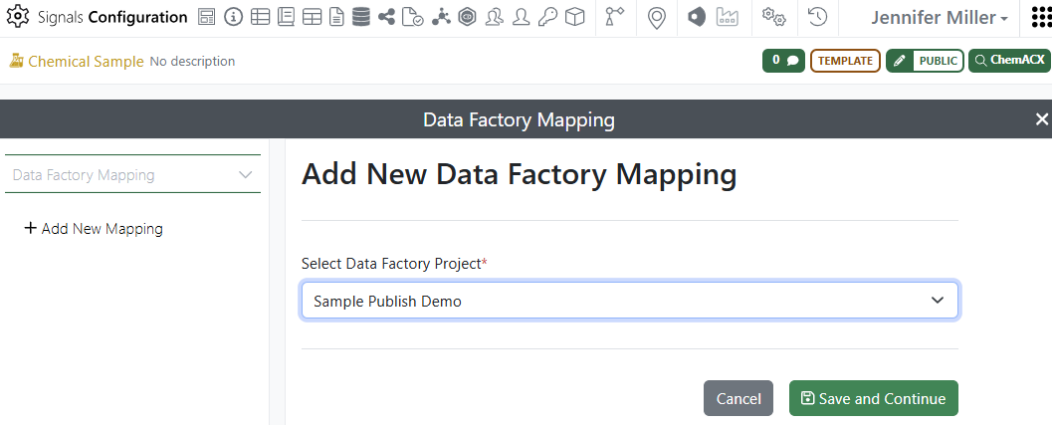
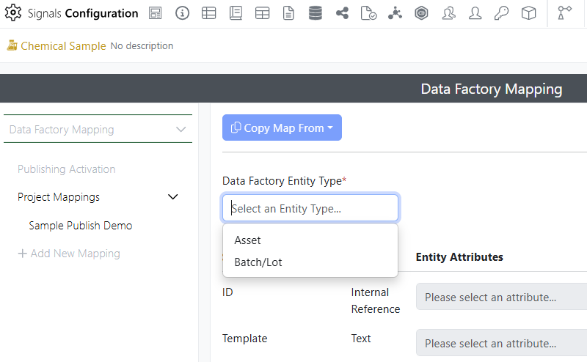
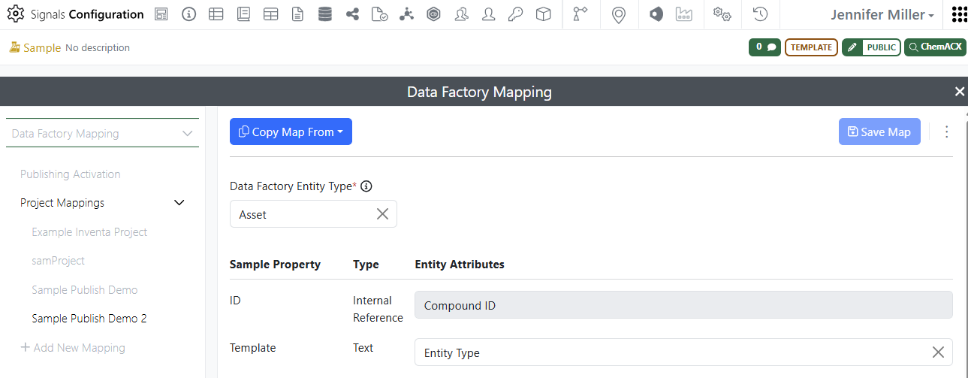
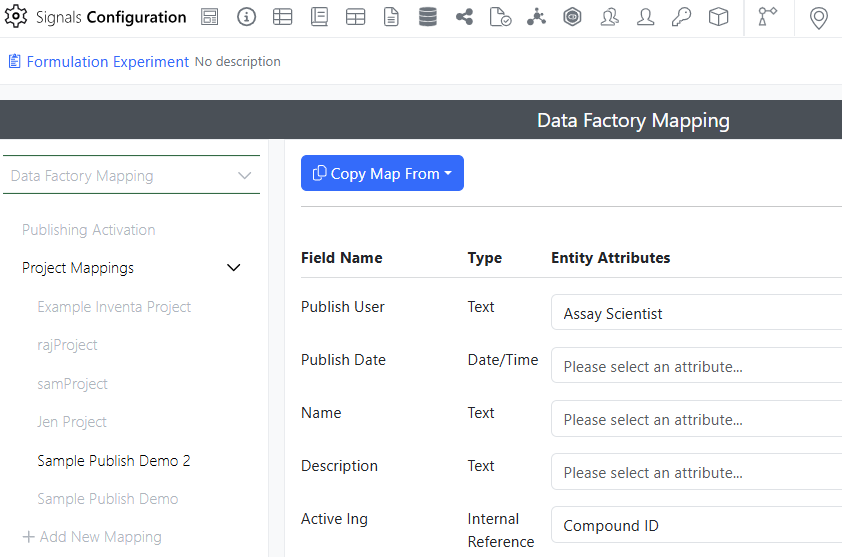
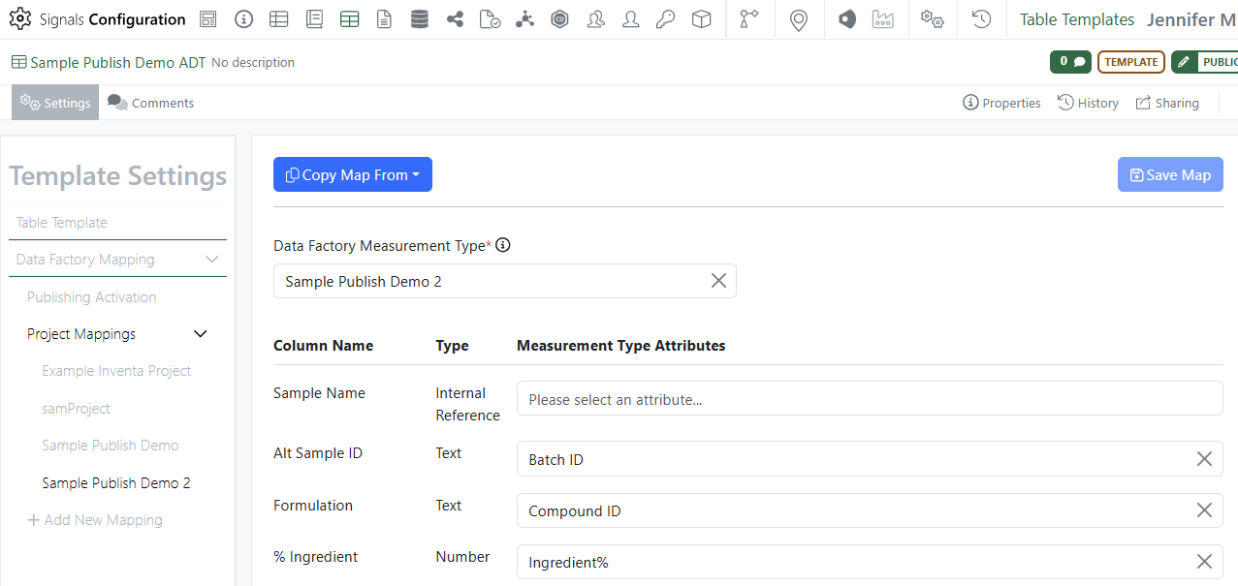
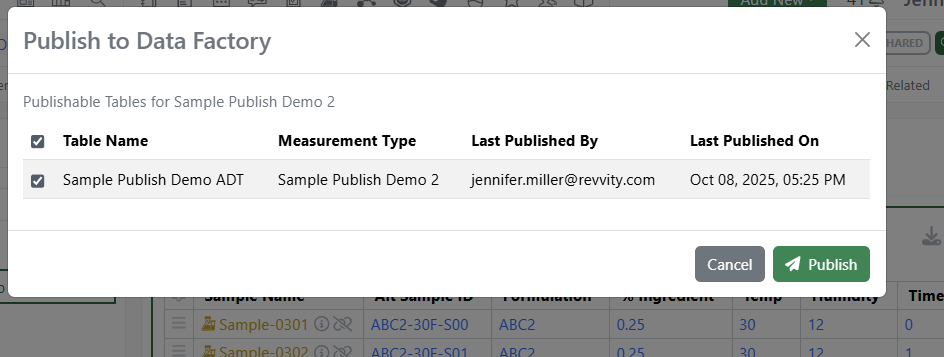
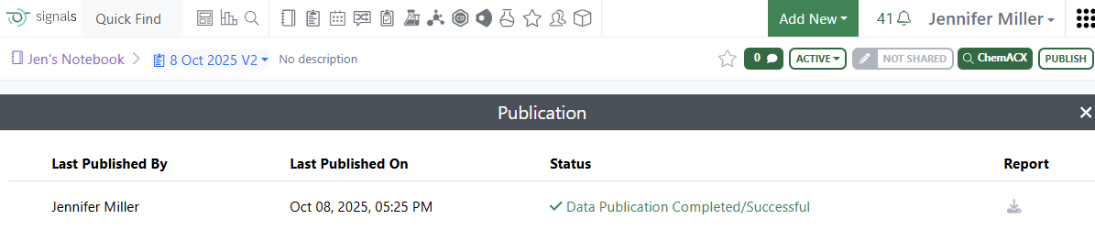
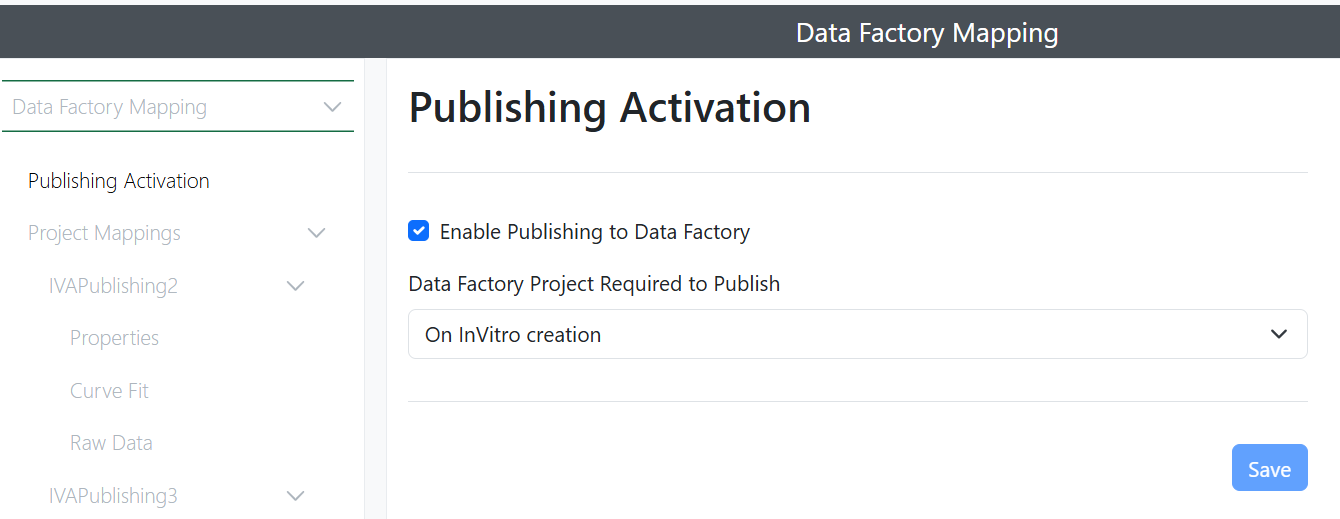
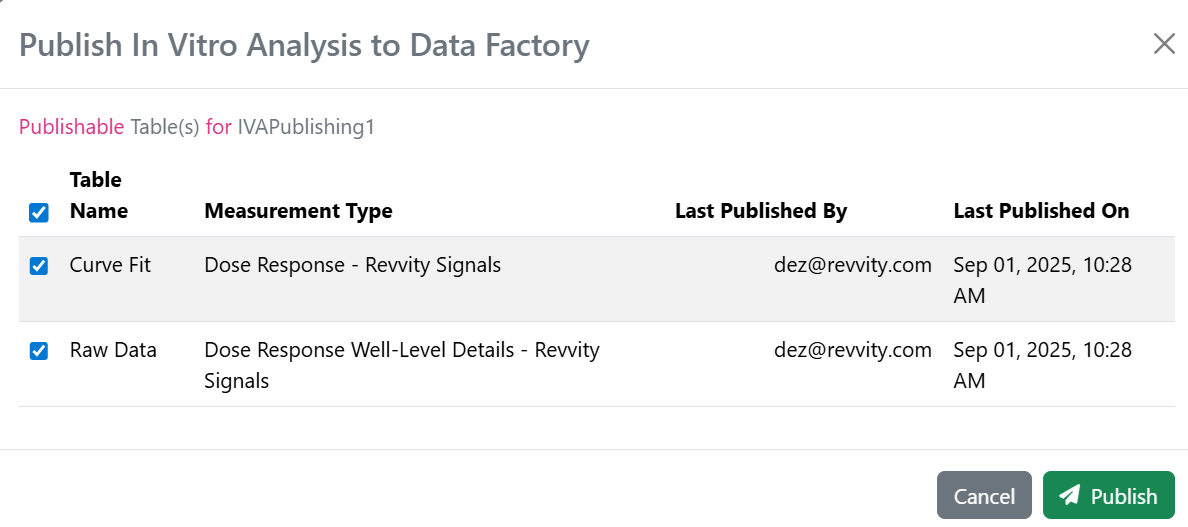
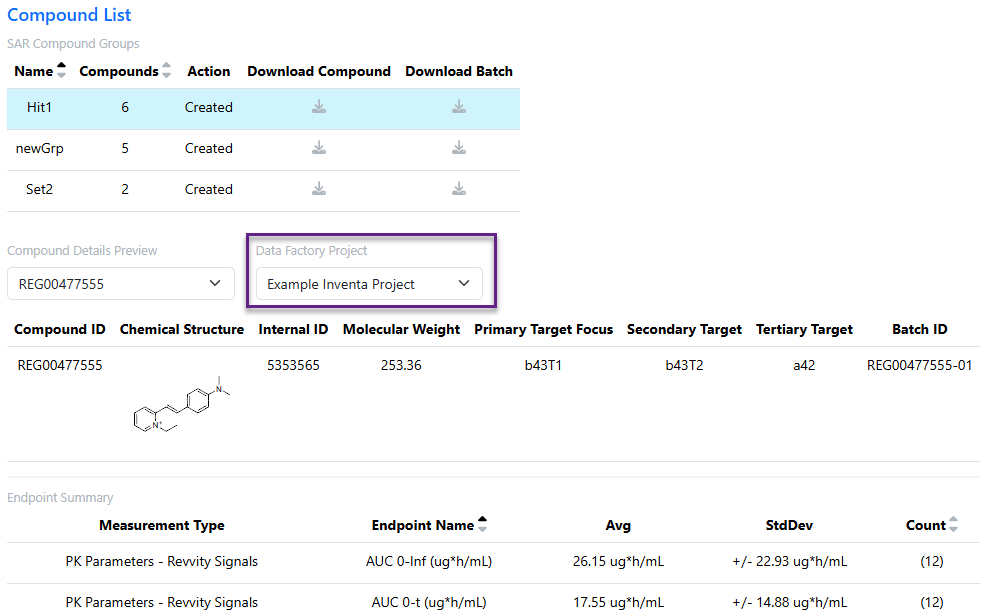
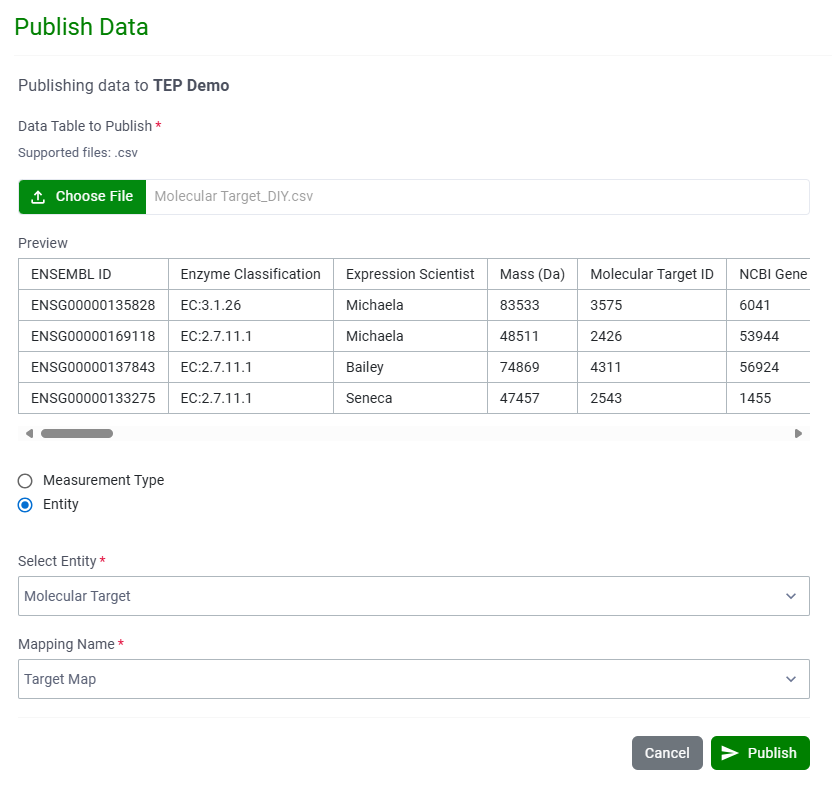
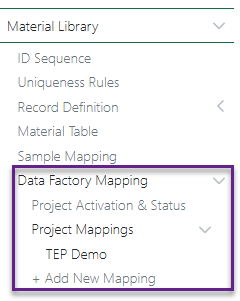
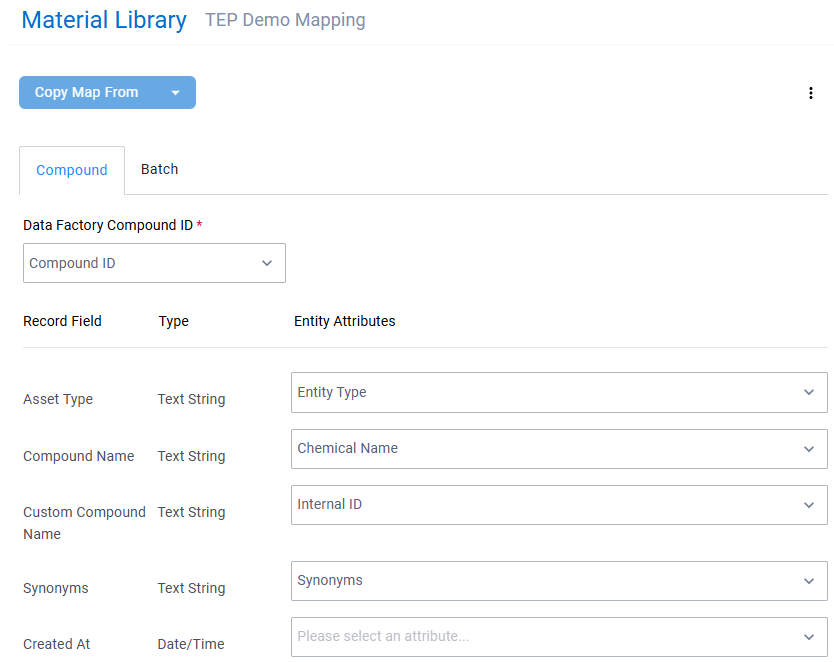
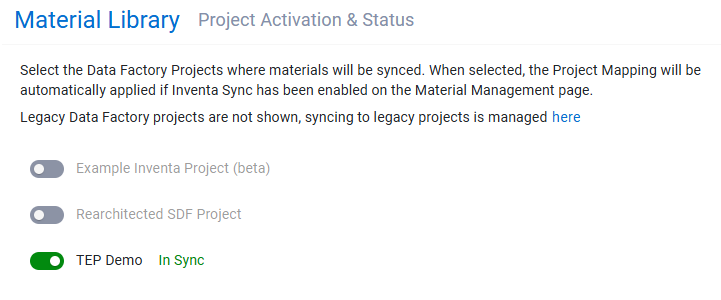
A migration path for legacy Data Factory projects is now available. Legacy Data Factory will be deprecated in a future release; administrators are encouraged to migrate to the latest Data Factory as soon as possible. The Legacy Project Migration tool is available from System Settings > Other. Before migrating, review the Migration Guide within the Signals Configuration Guide.
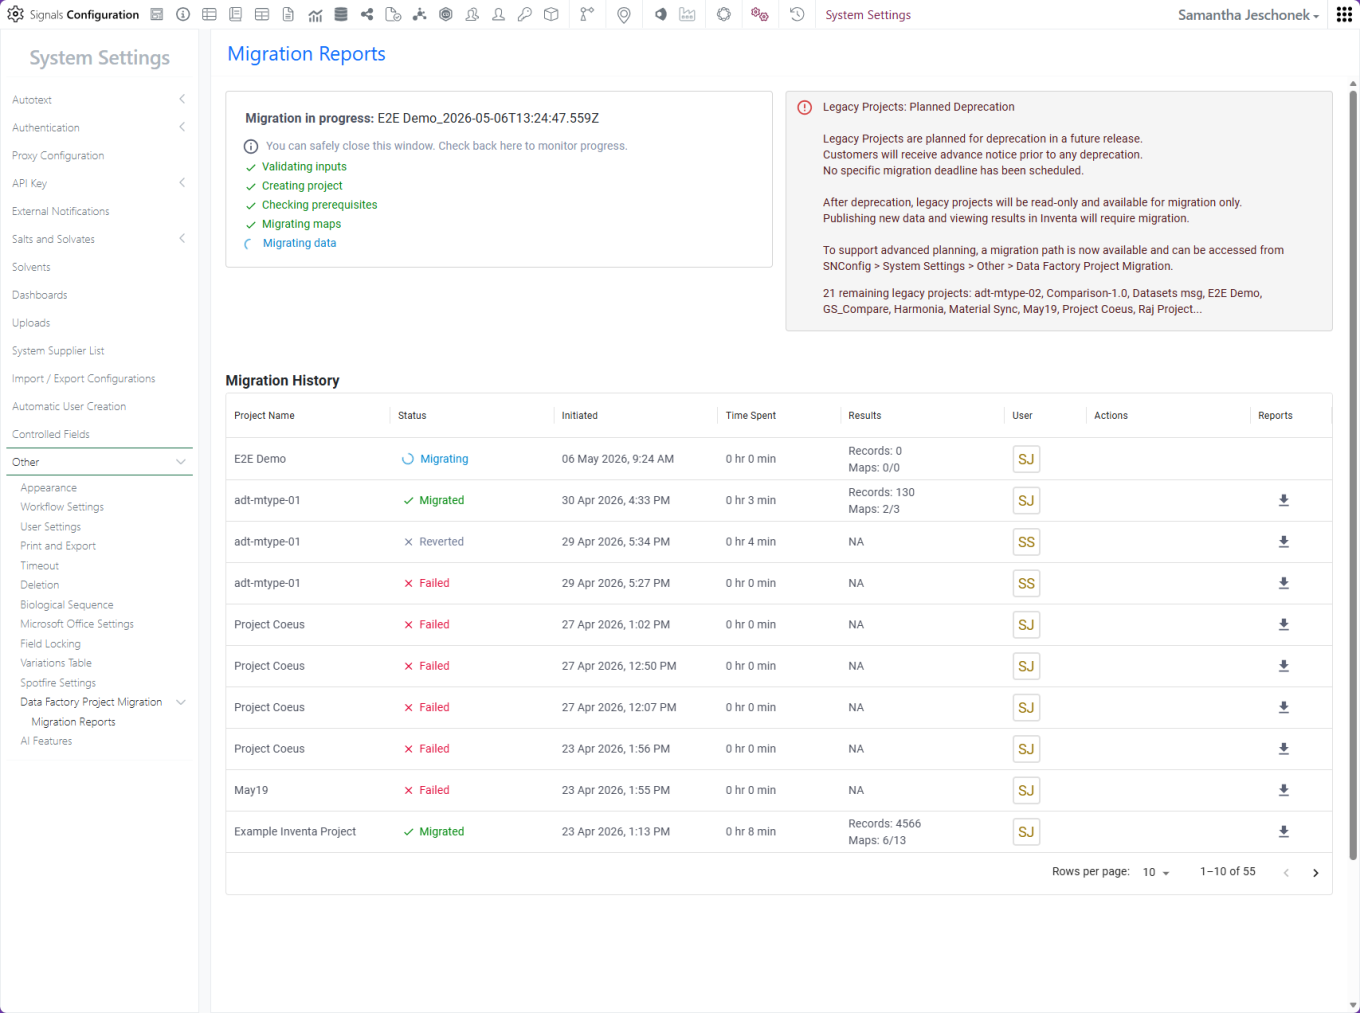
Migration status and history are captured in the Migration Report.

After a successful migration, administrators can review the migrated project before committing the changes.

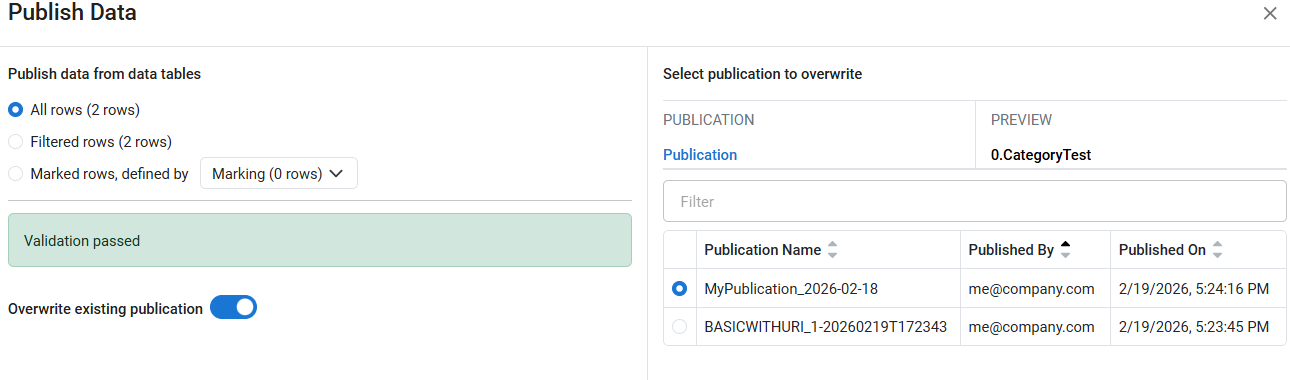
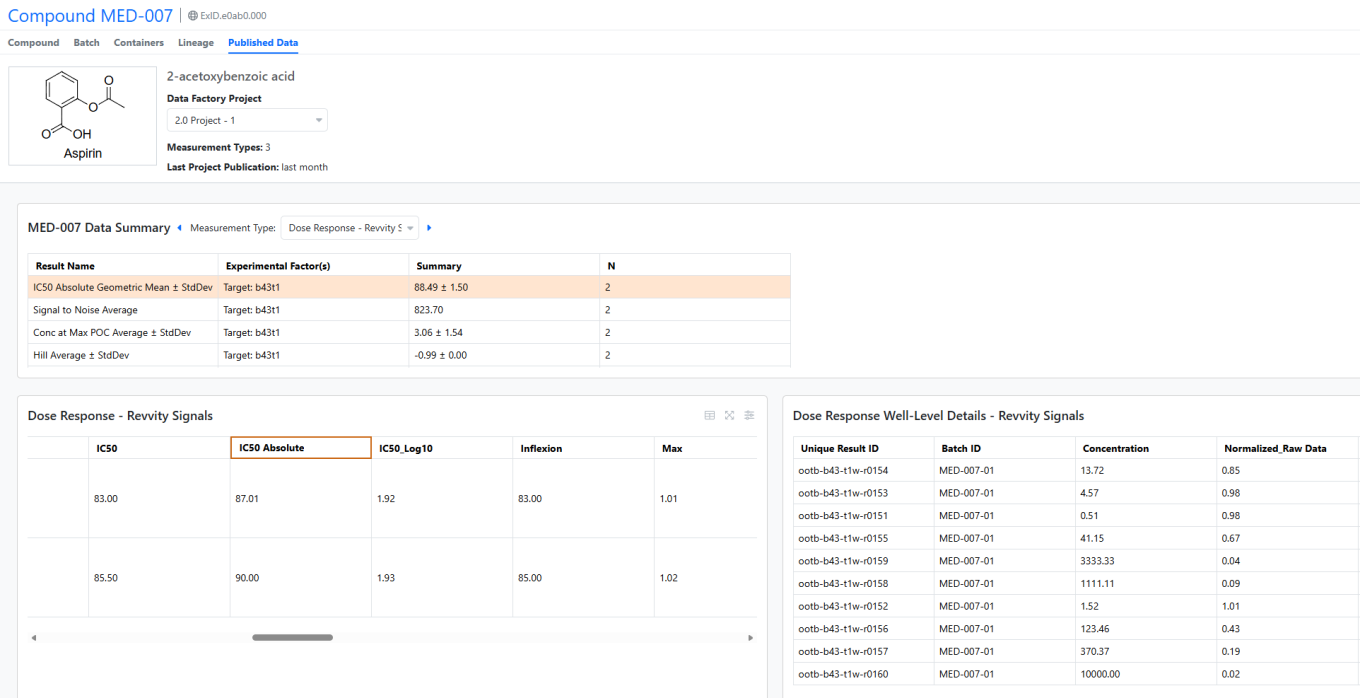
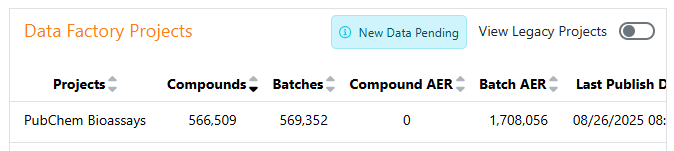
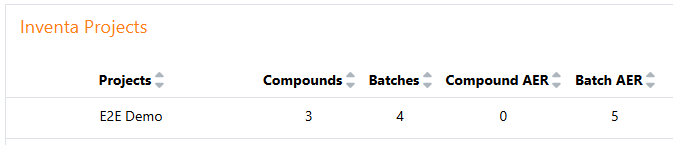
After you commit, the migrated project is ready to use and can be accessed from the Inventa Dashboard. The legacy project is no longer available for publication or data retrieval in Inventa.
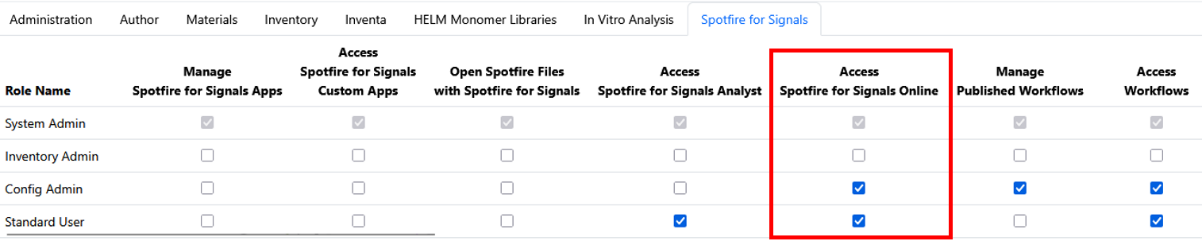
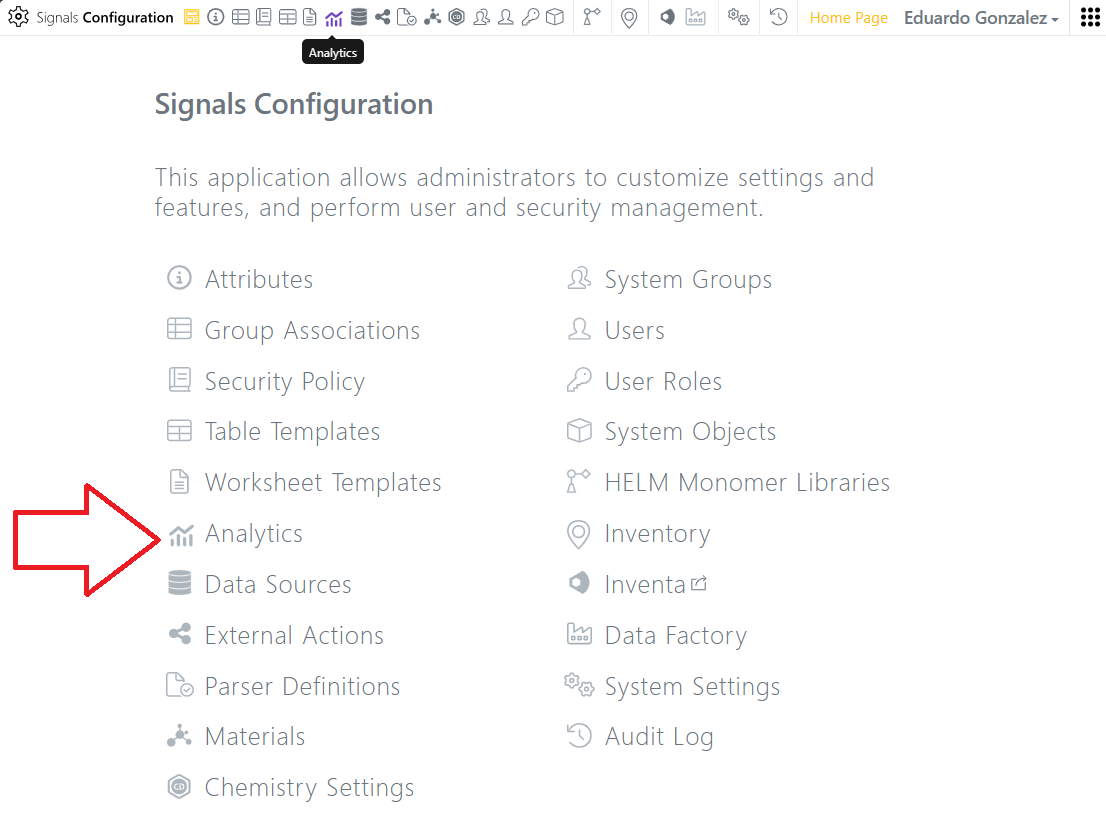
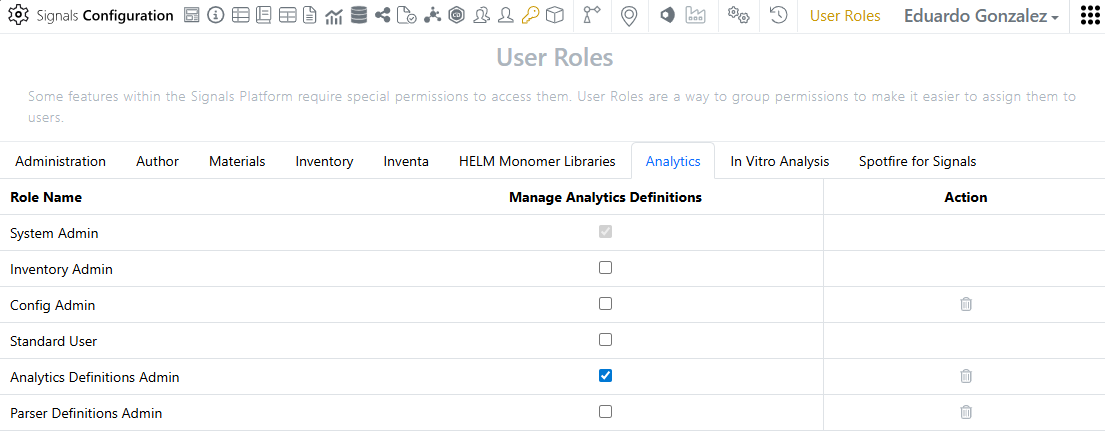
Spotfire for Signals Online Access privilege available to control which users can access and substantiate Spotfire for Signals Online. Users without this privilege will be limited to Spotfire for Signals Analyst use.
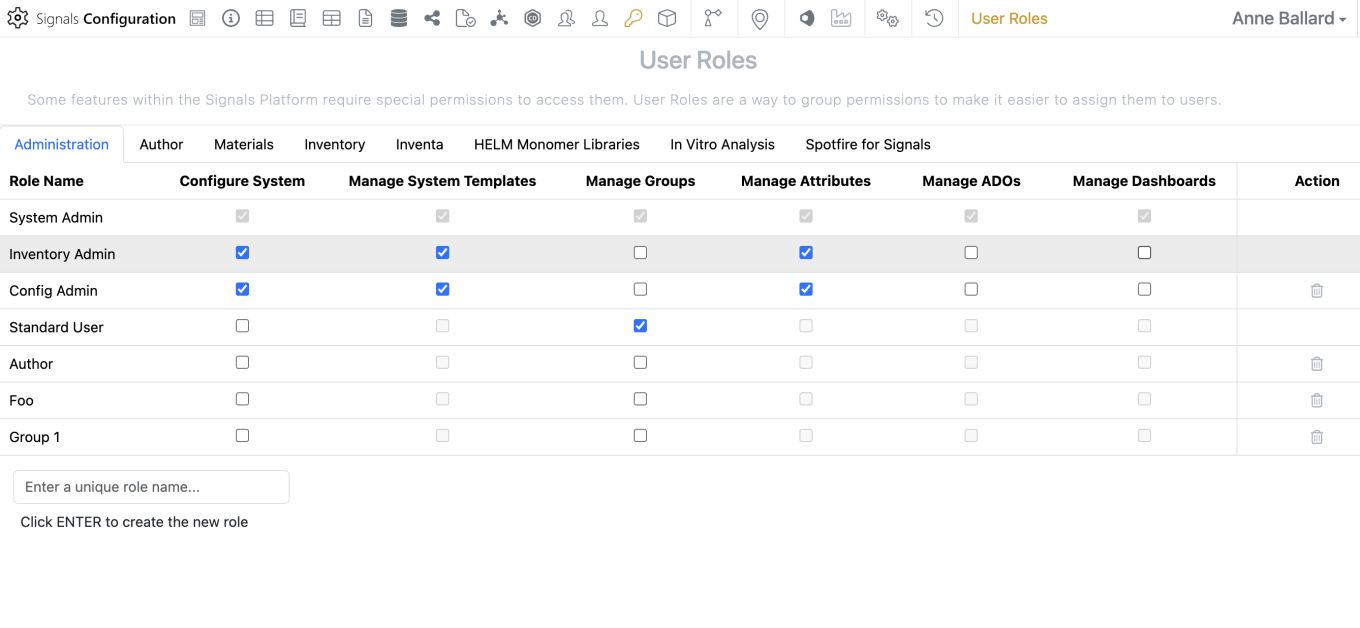
Administrators should now be able to create and share dashboards from the SN Config. To edit, share or create dashboards, a user must have the “Manage Dashboards” privilege and access to the SN Config as Admin Defined Dashboards can only be edited or created within the SN Config.
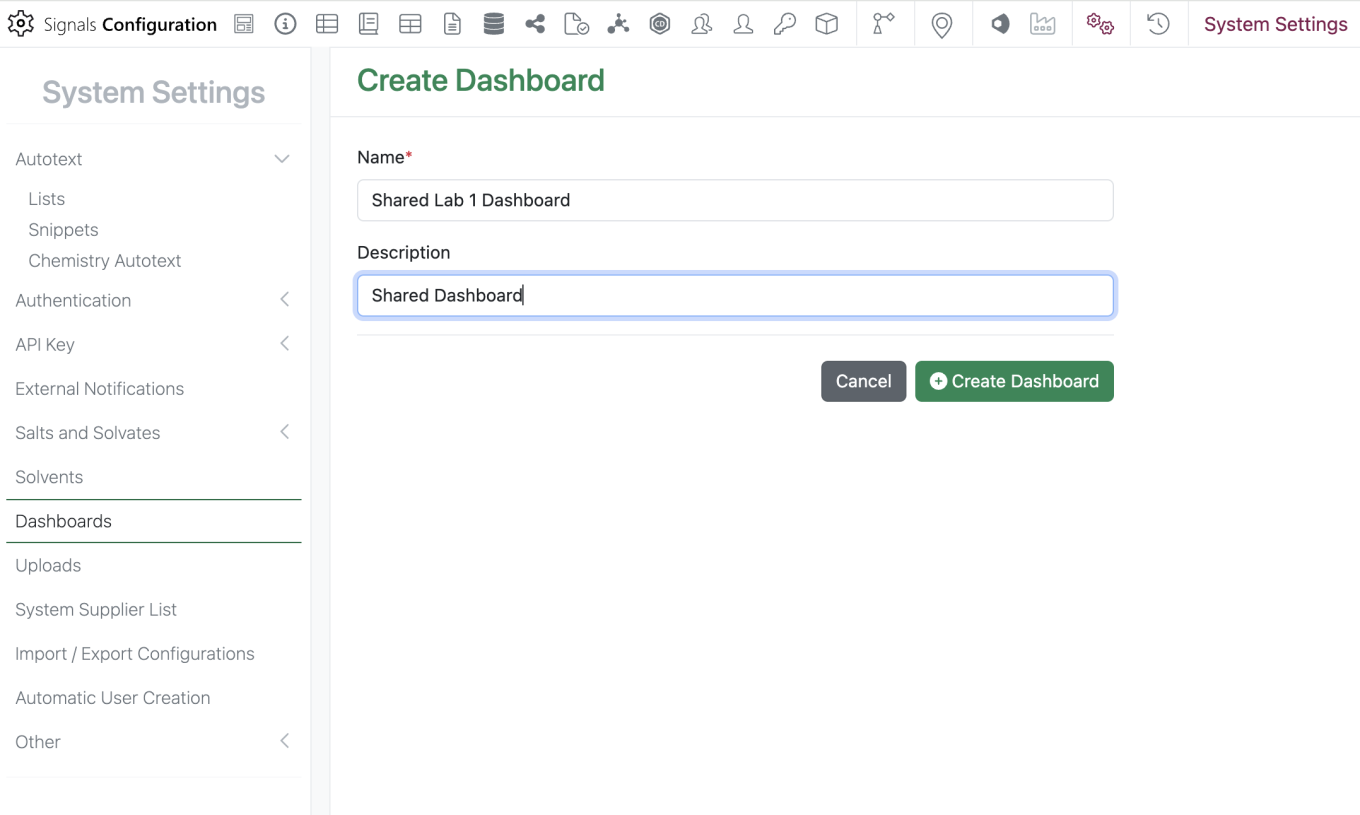
The new “Dashboards” section can be found in the System Settings. To create a dashboard, the admin should select the green “Create Dashboard” button then they are prompted to enter a dashboard name and description.
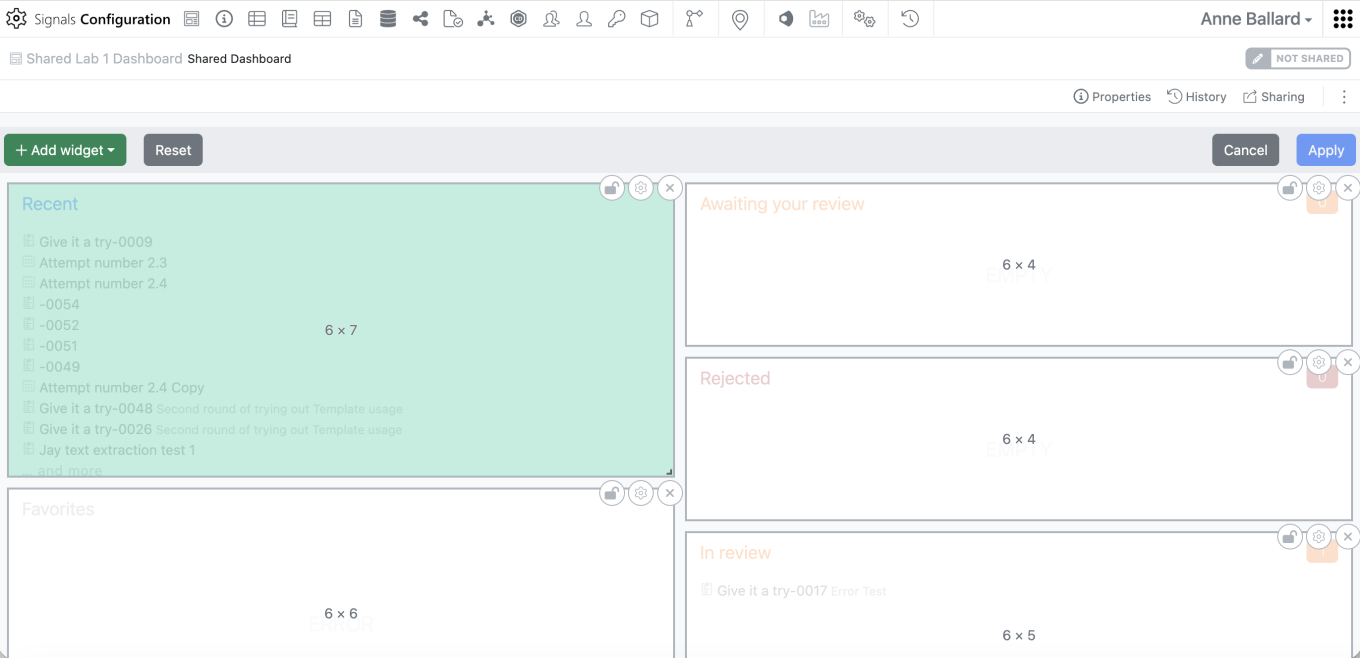
When the admin clicks on “Create Dashboard” they will be brought to the Dashboard edit screen. Here they can add, remove, edit, or resize widgets similarly to what can be done with a personal Dashboard.
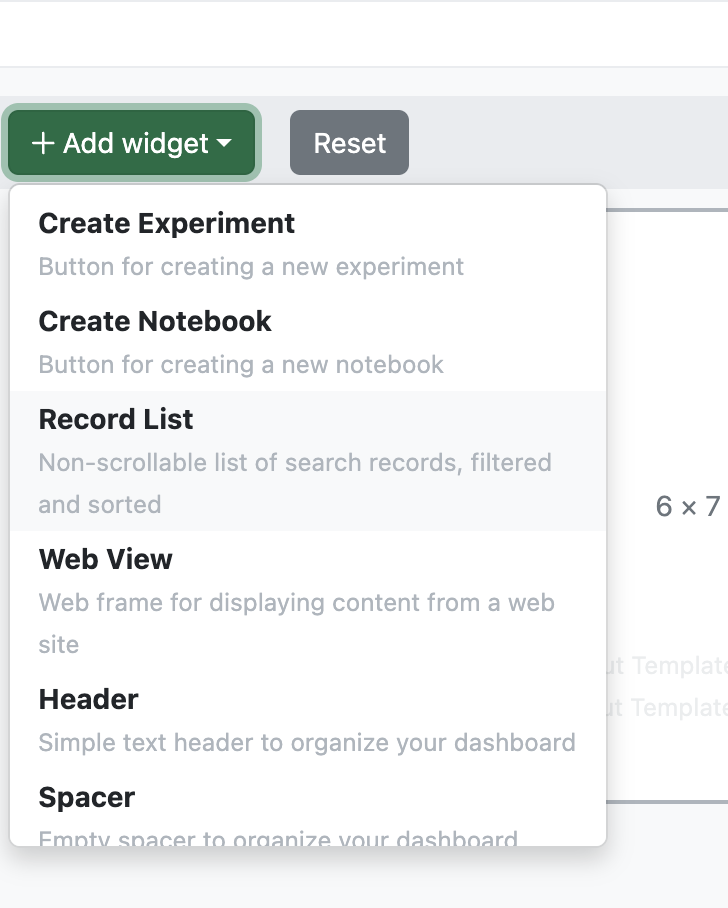
To add a new “Record List”, the most commonly utilized widget, the admin would select “Add Widget” > “Record List”. Under “List Source” the admin can select from a standard set of predefined lists or select “Define List” to create a new search list.
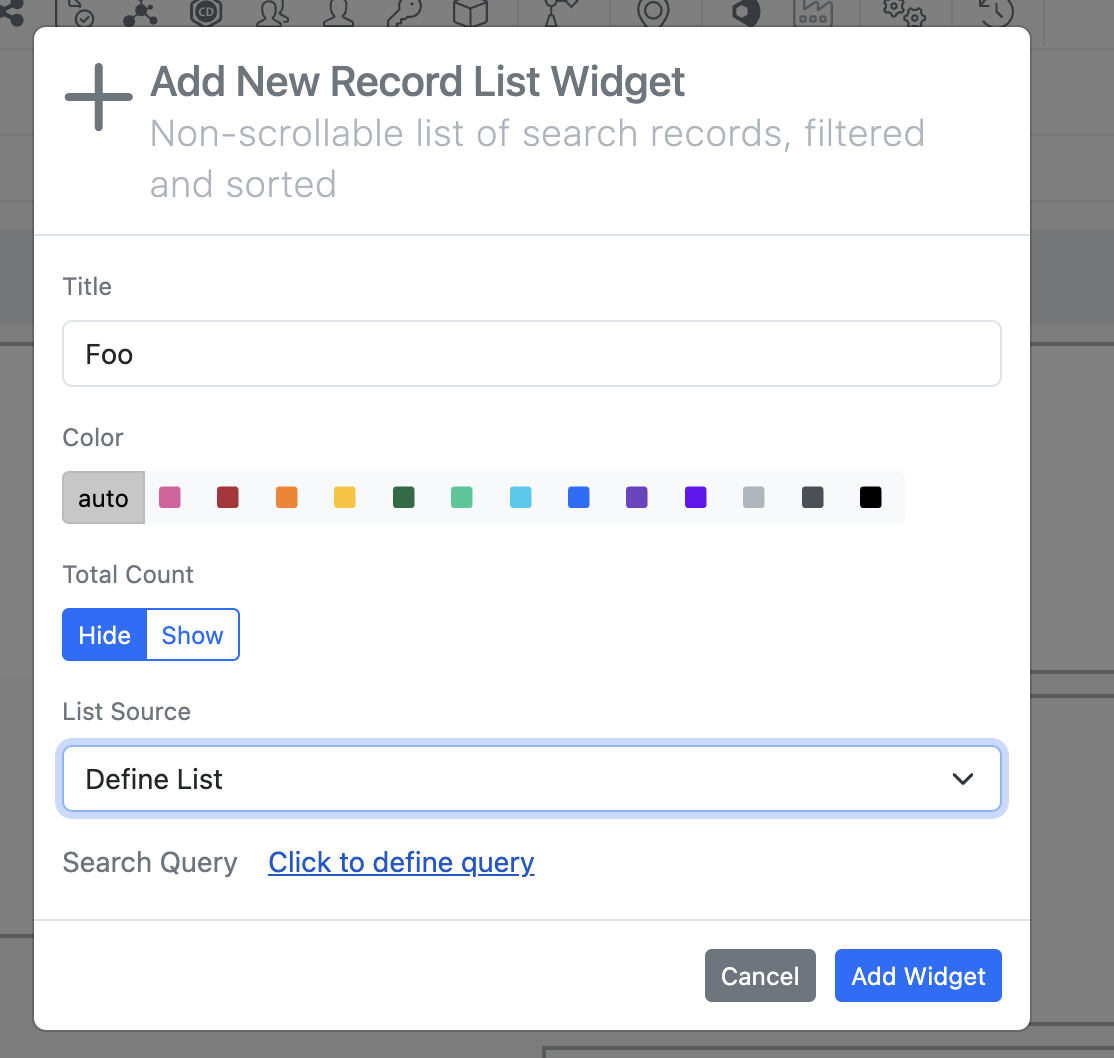
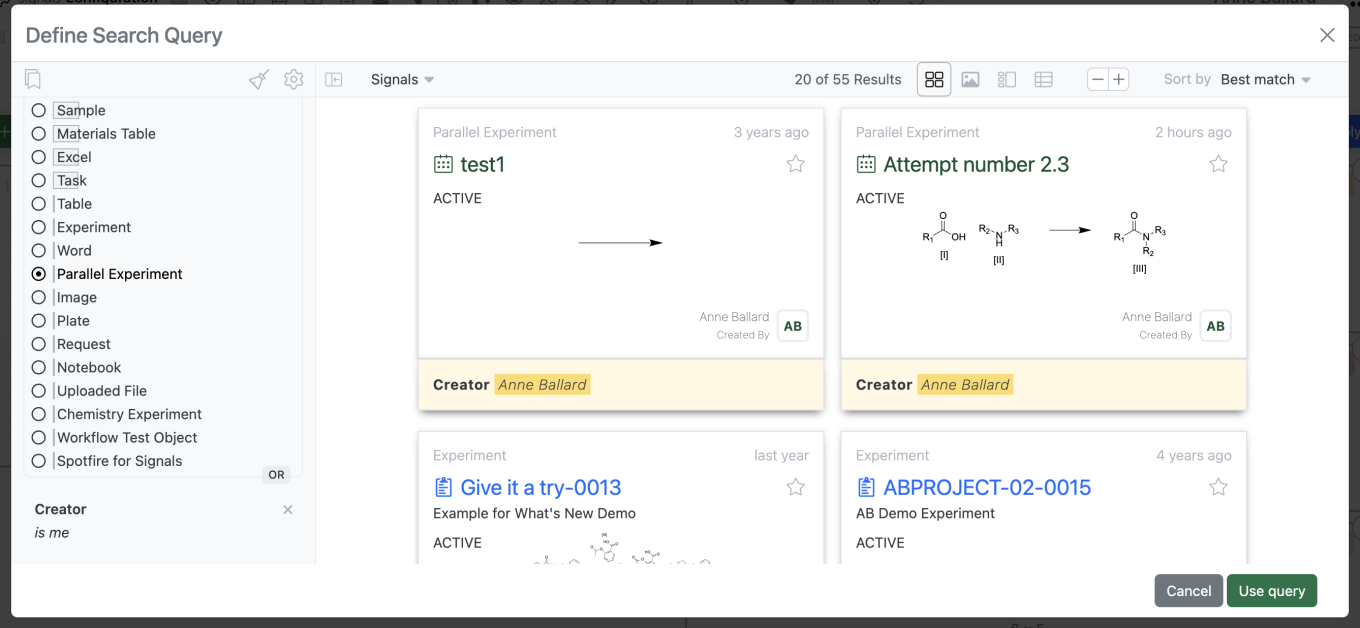
Selecting “Define List” > “Click to define query” brings up a search query builder the admin can utilize to define their search list.
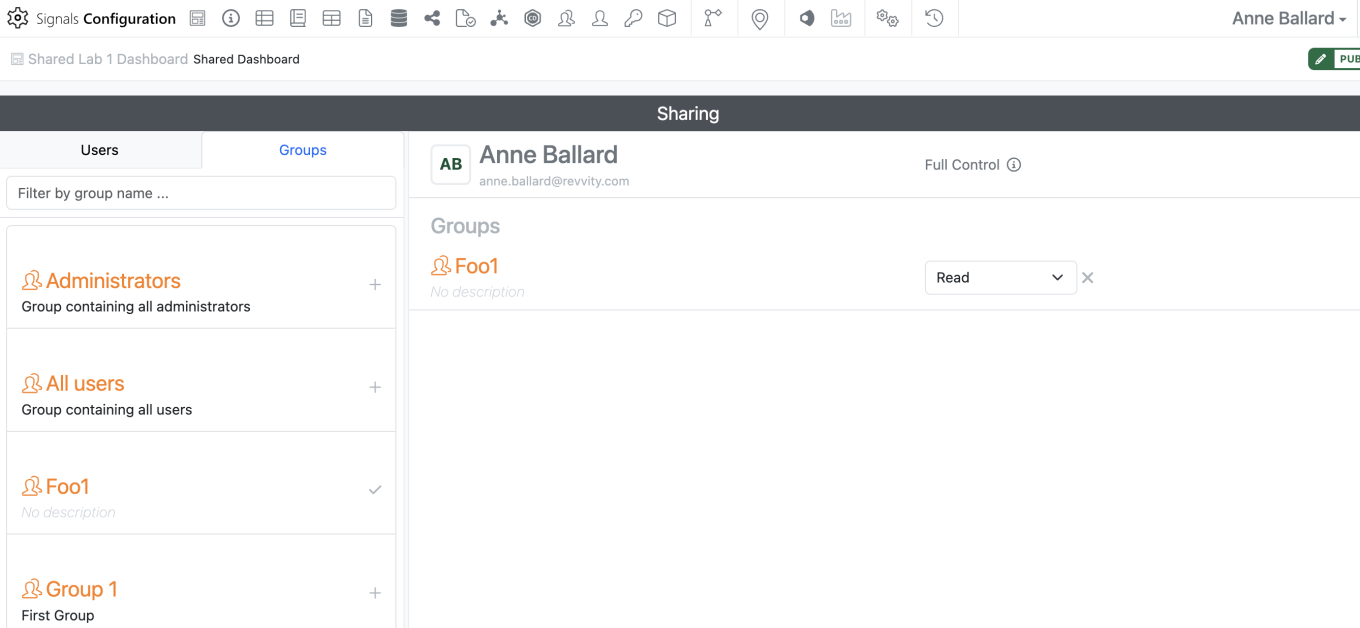
Changes to the selected dashboard are saved by selecting the blue “Apply” in the top right corner.
The admin can then share the dashboard with other users or groups similarly to how sharing is managed in other elements.
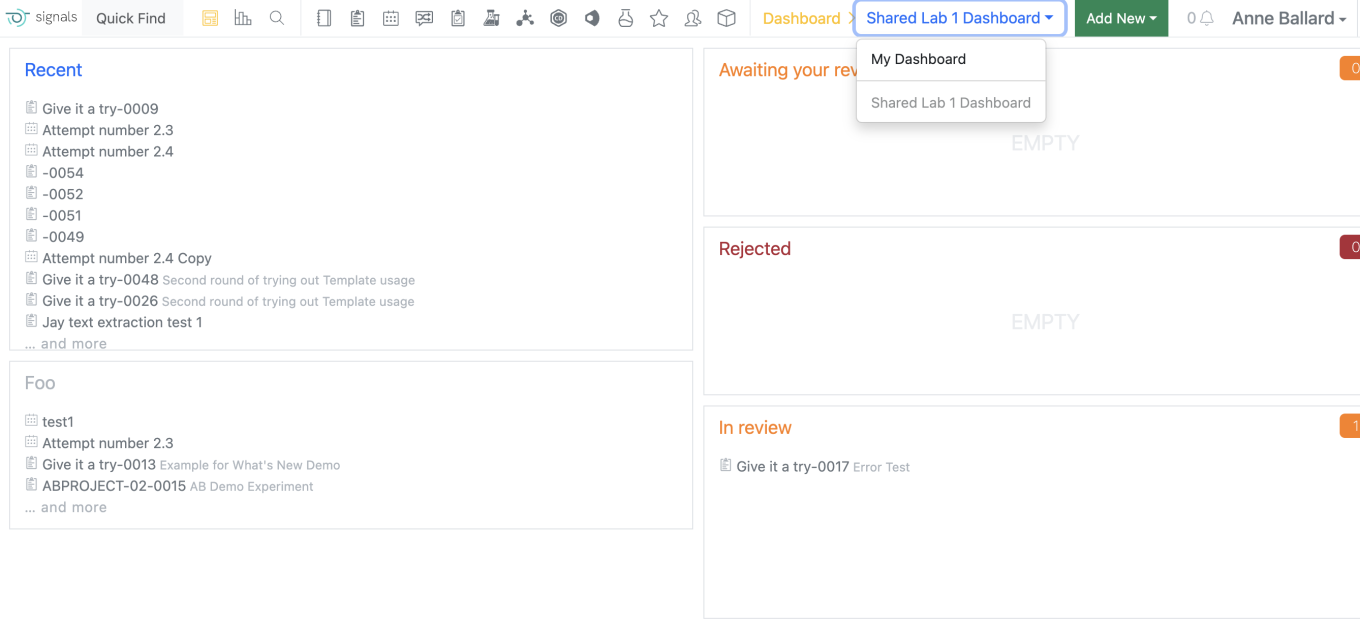
Dashboards are automatically shared with Read access. If a dashboard is shared with write access or full control to a user or group that does not have access to the SN Config, they will be unable to edit or share the dashboard as shared dashboards are Read Only outside of the SN Config.
For end users, their current personal dashboard has now been named “My Dashboard” on the dashboard menu. Users are still able to edit their own “My Dashboard” as they were previously able to do. All shared dashboards appear below “My Dashboard”. If the user selects one of their shared dashboards this selection is sticky.
Integrations & Interfaces

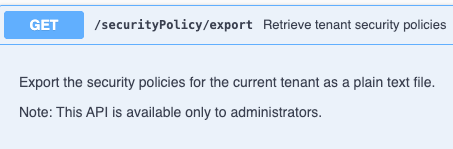
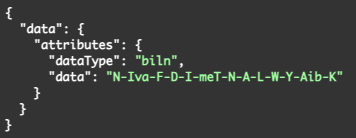
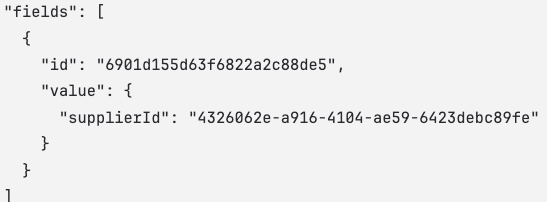
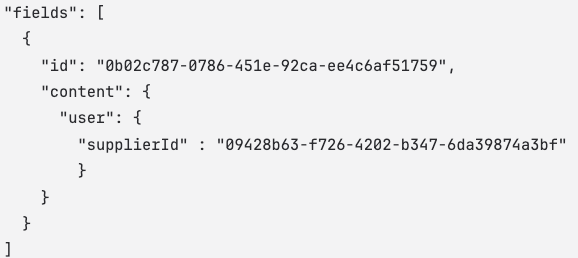
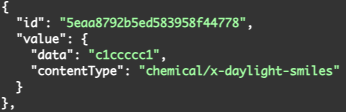
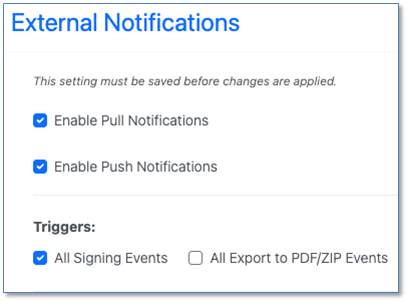
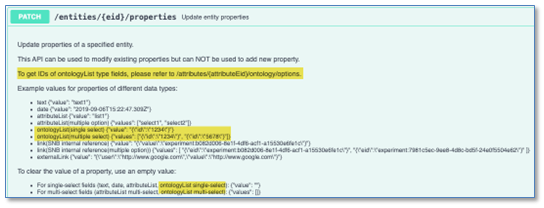
We have added API support for writing to Ontology List fields. These are enhancements to all APIs which write to entities that support Ontology List fields and properties. There are new APIs to fetch and explore Ontology Lists. The “id” values found here are used to set values on Ontology List fields and properties.
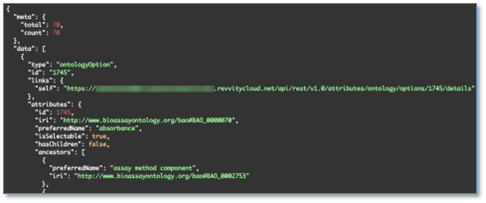
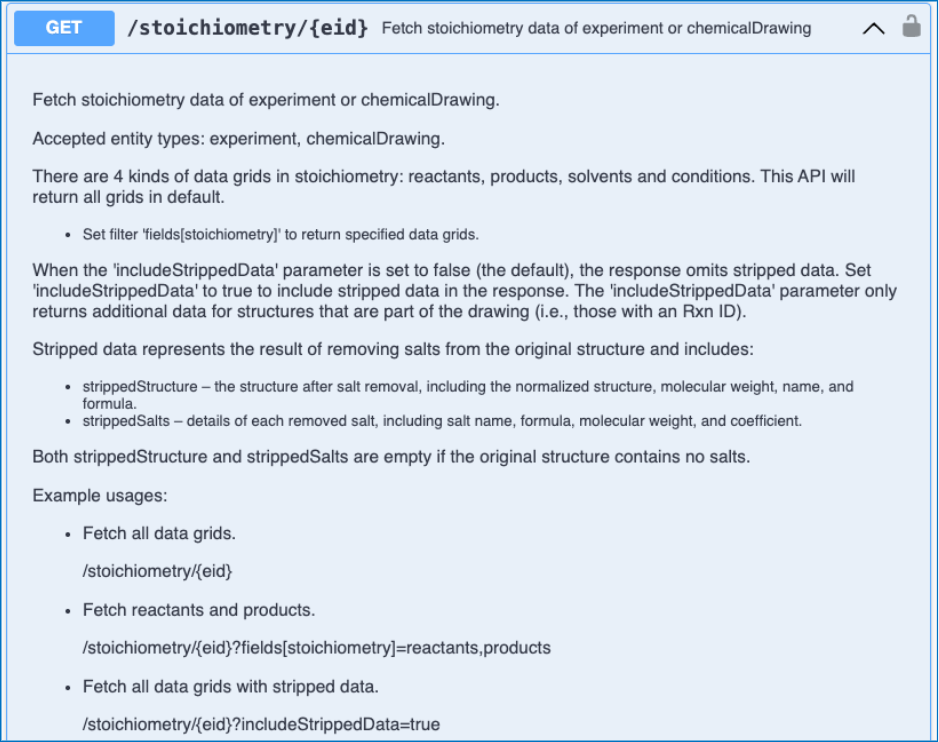
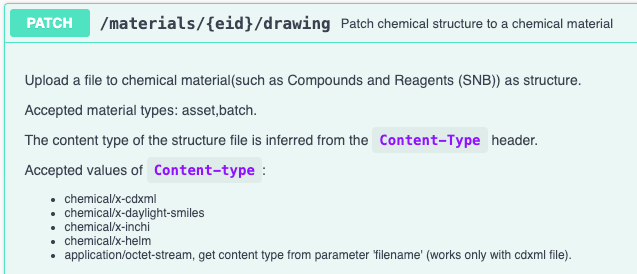
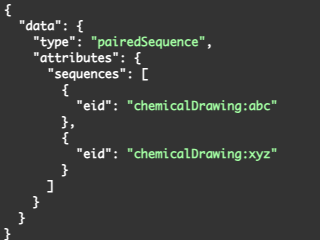
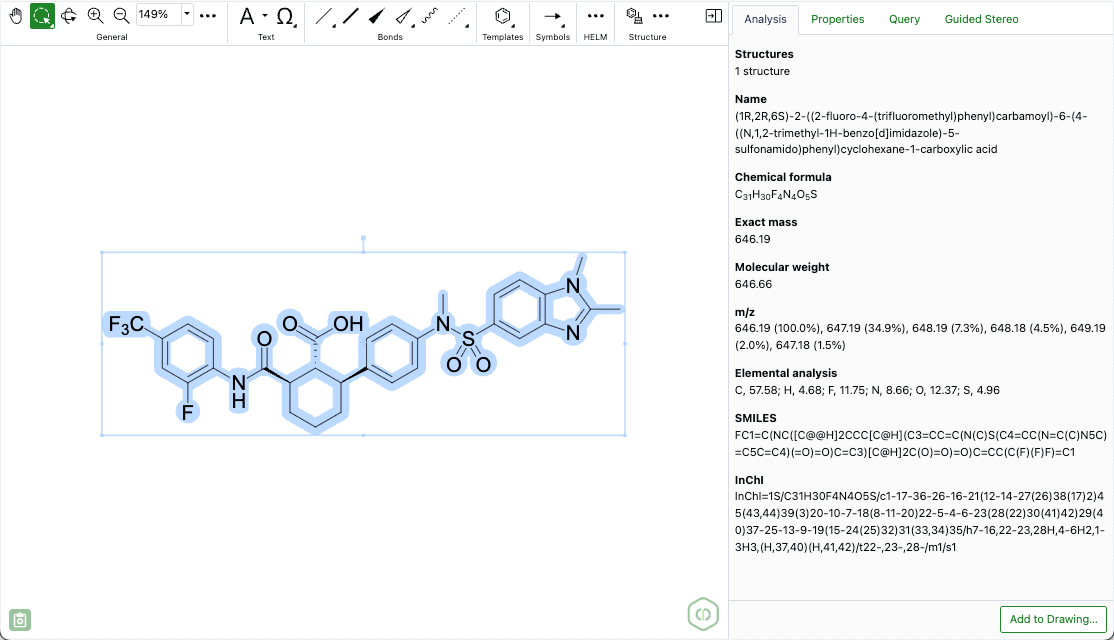
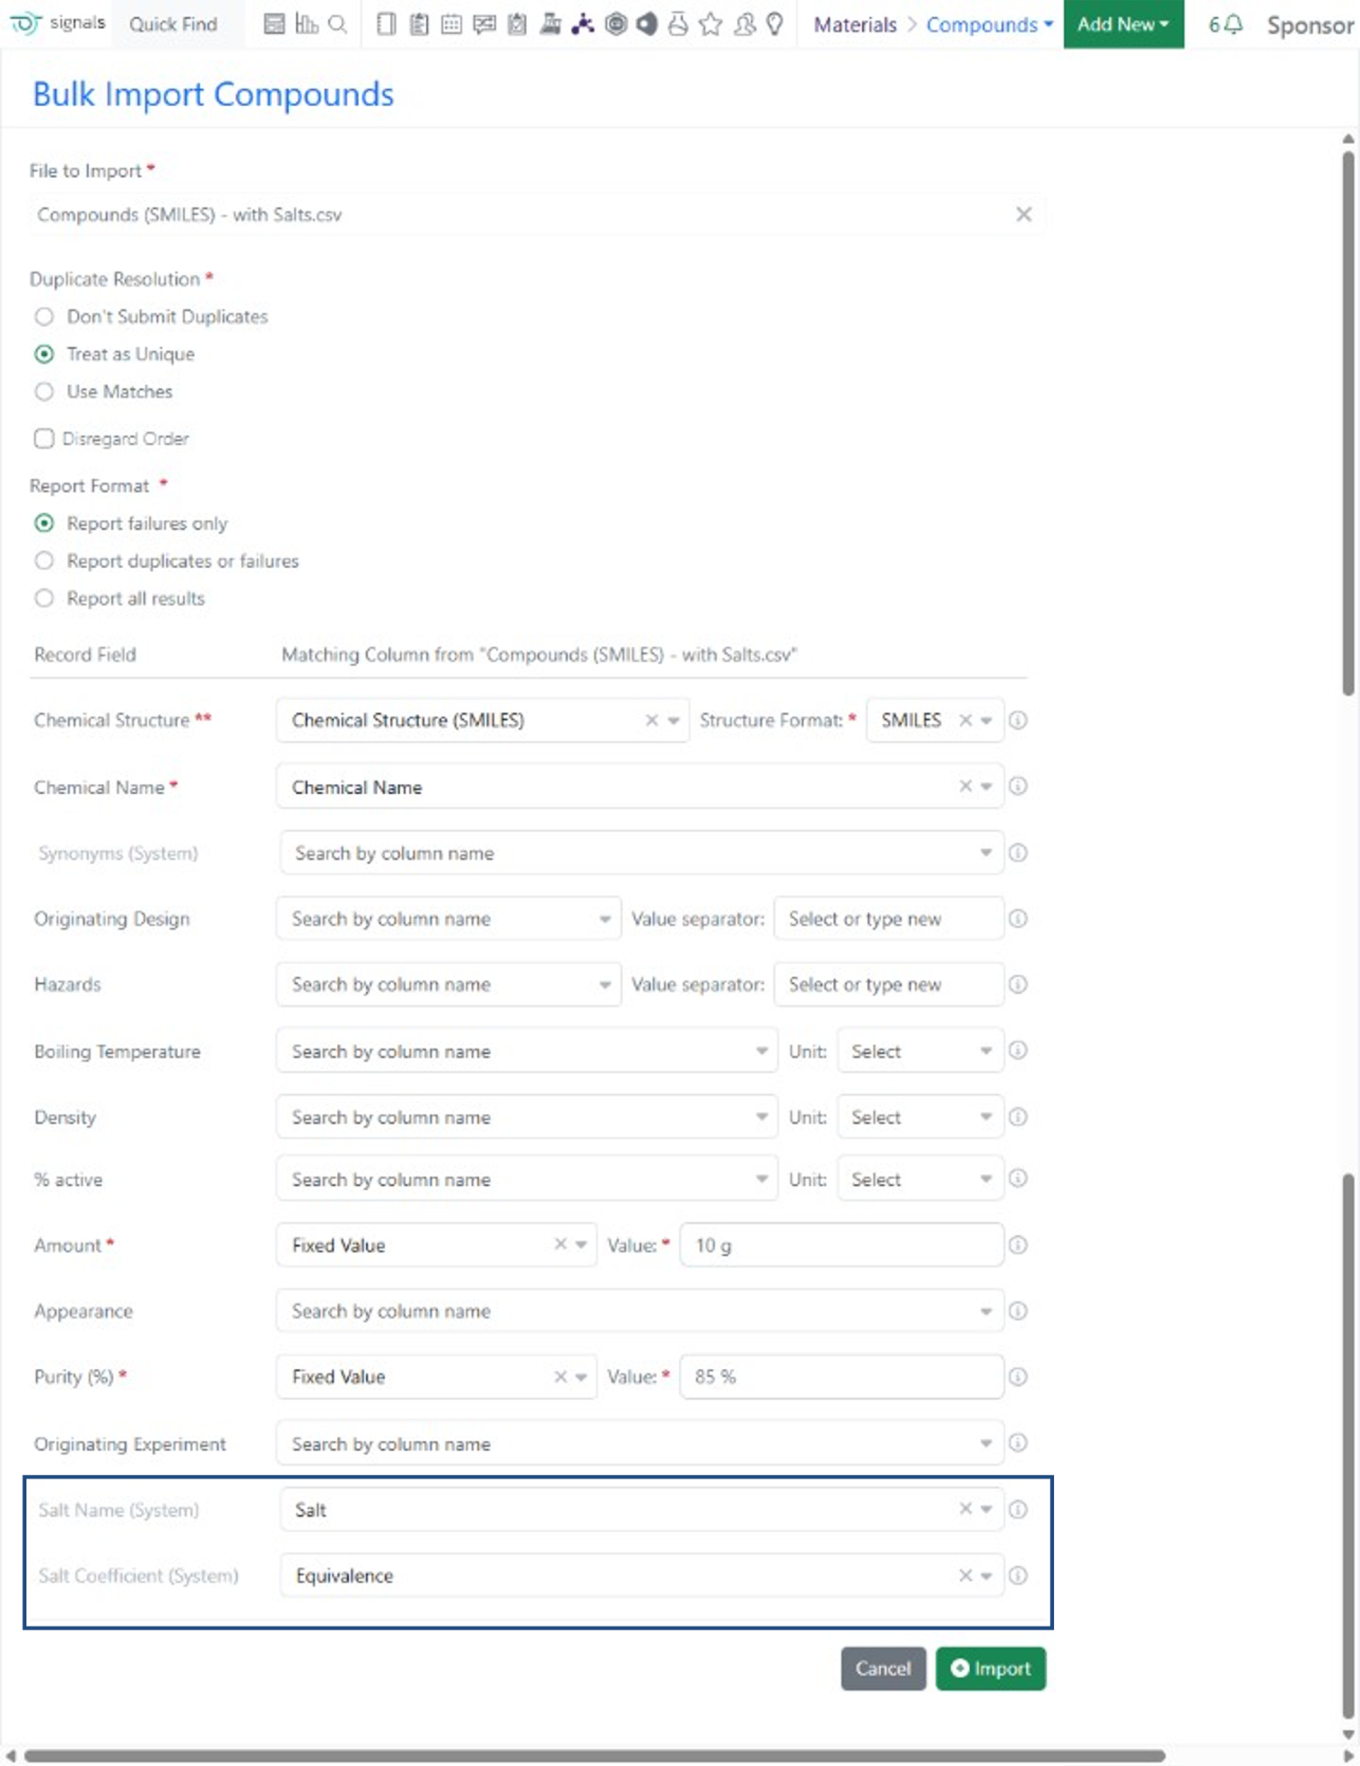
We have enhanced the stoichiometry fetch API to include salt stripping data for a Chemical Drawing. This is a new URL parameter (includeStrippedData) which when true will include the stripped structure and the salts that were stripped from the Chemical Drawing as data in the response.
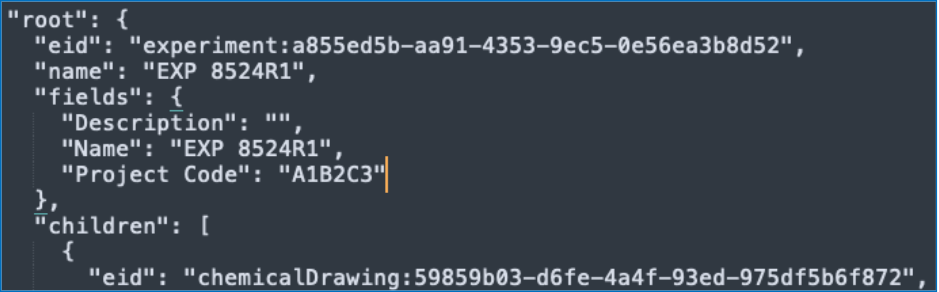
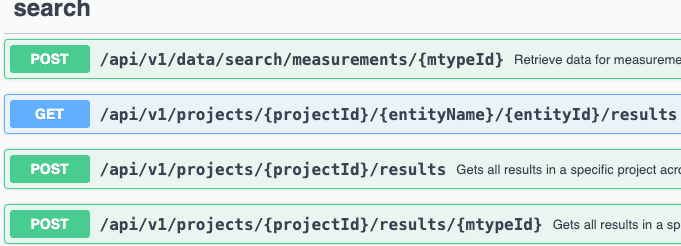
We have enhanced the API for bulk export of an entity to include the entities properties as part of the table of contents.

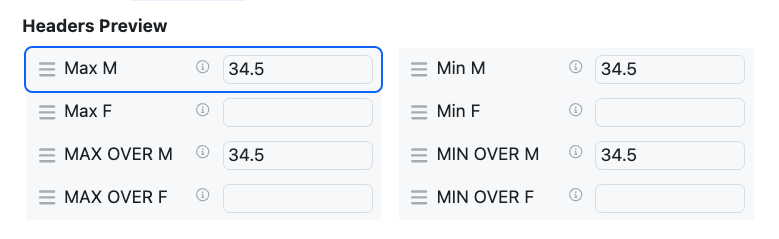
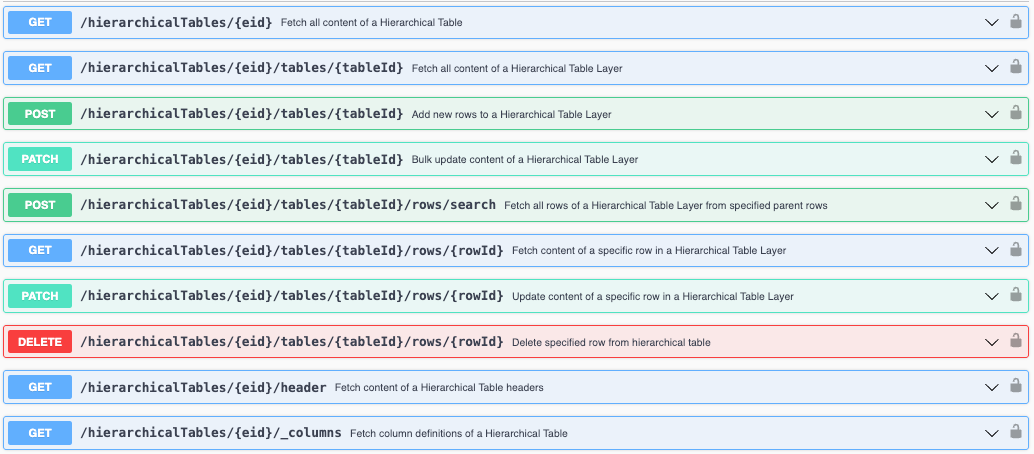
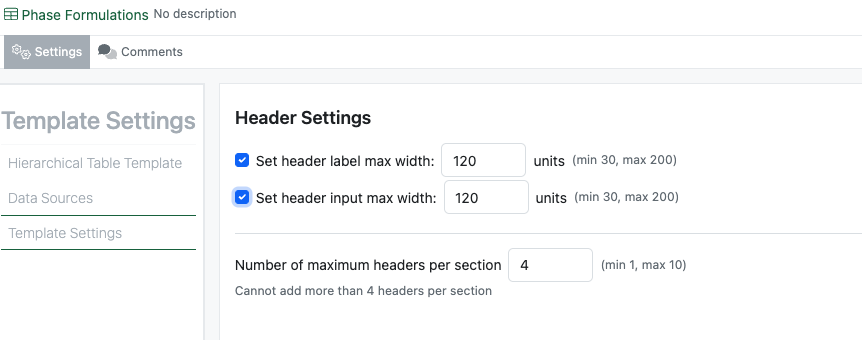
We have added a new API to allow patching of Hierarchical Table headers.
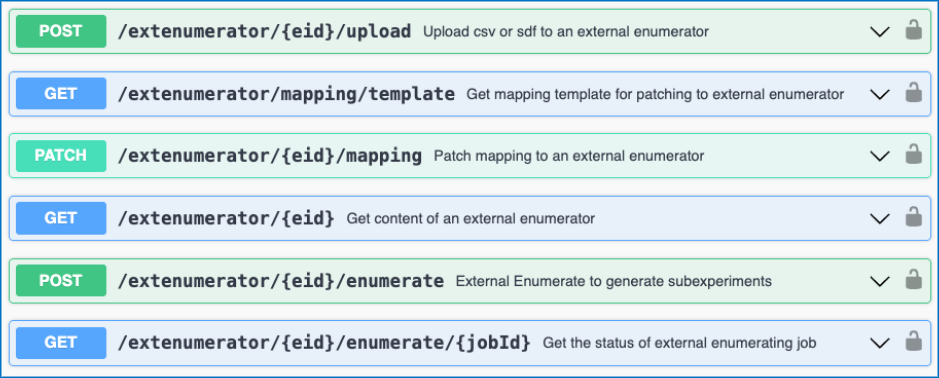
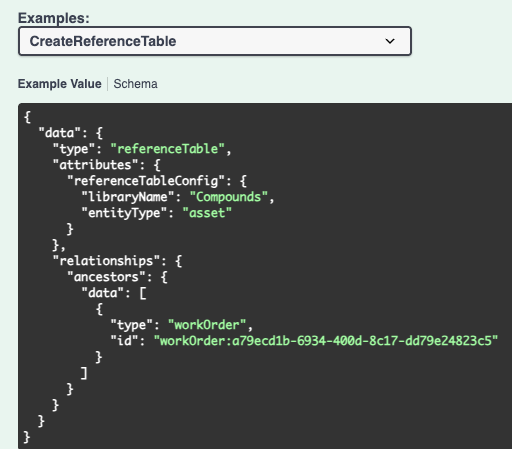
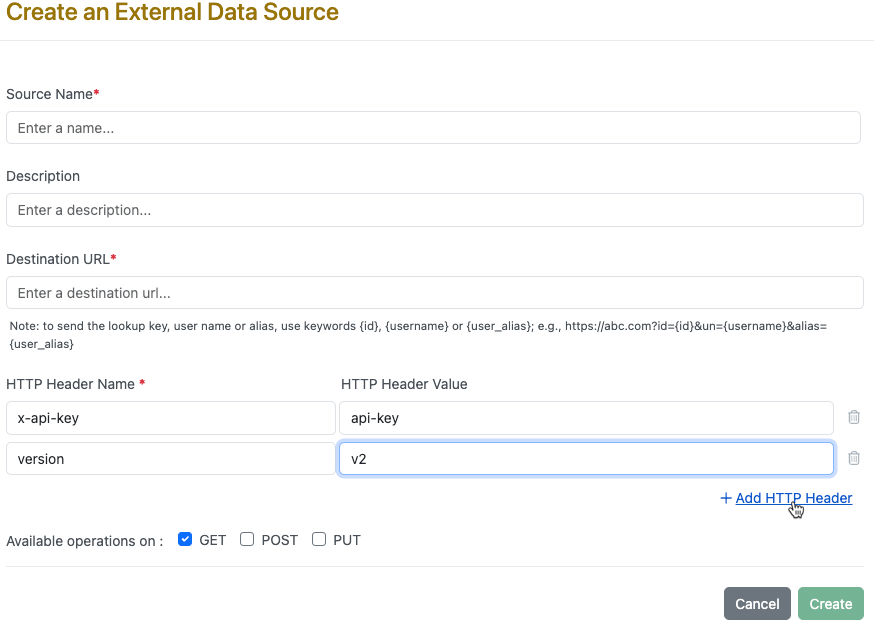
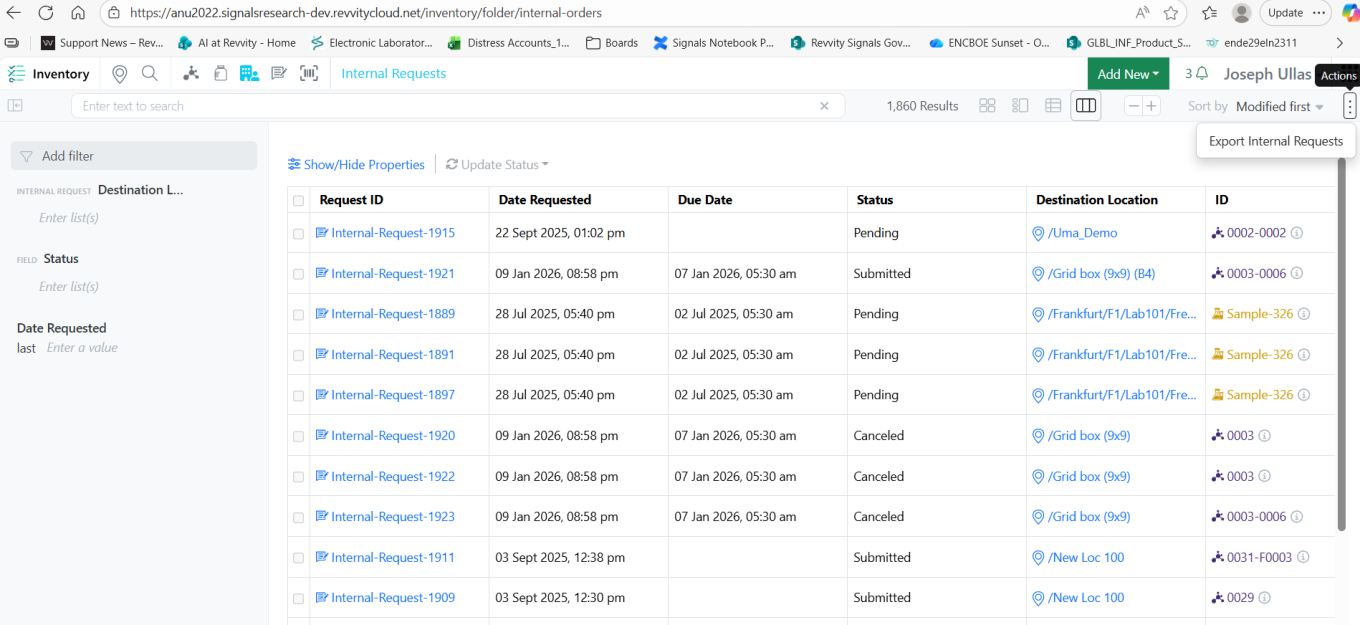
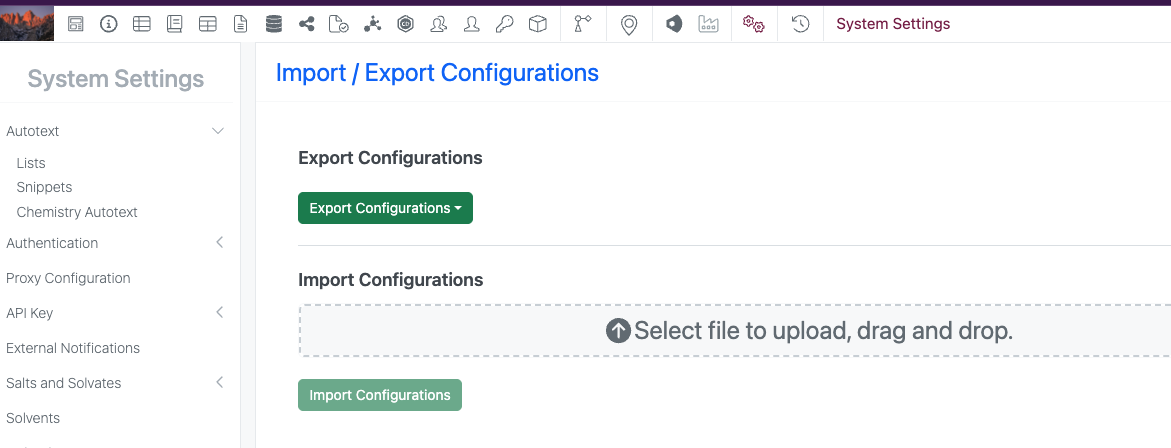
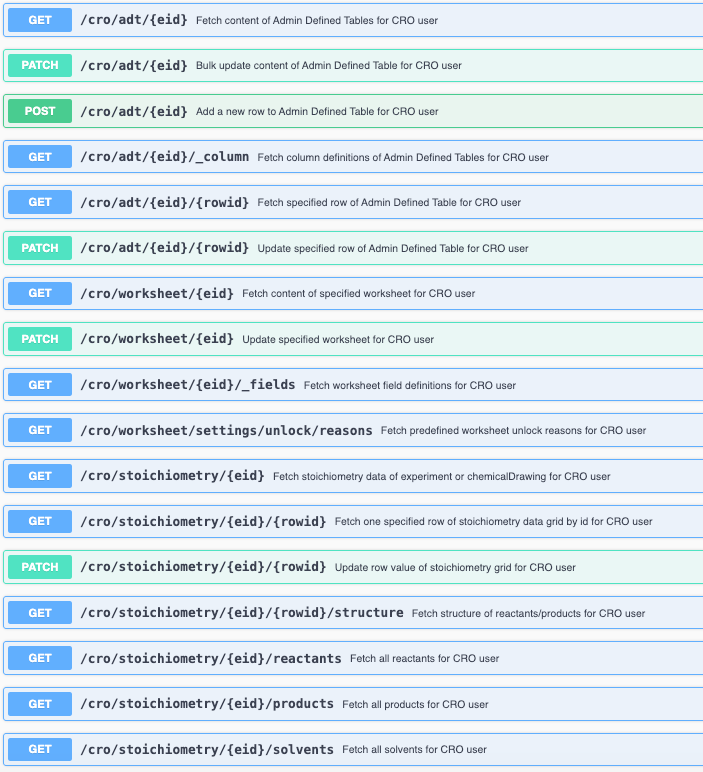
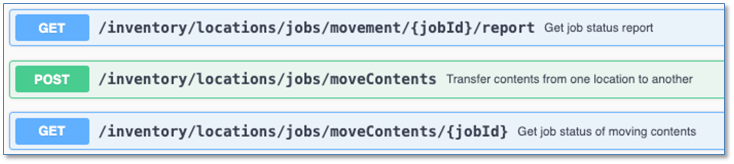
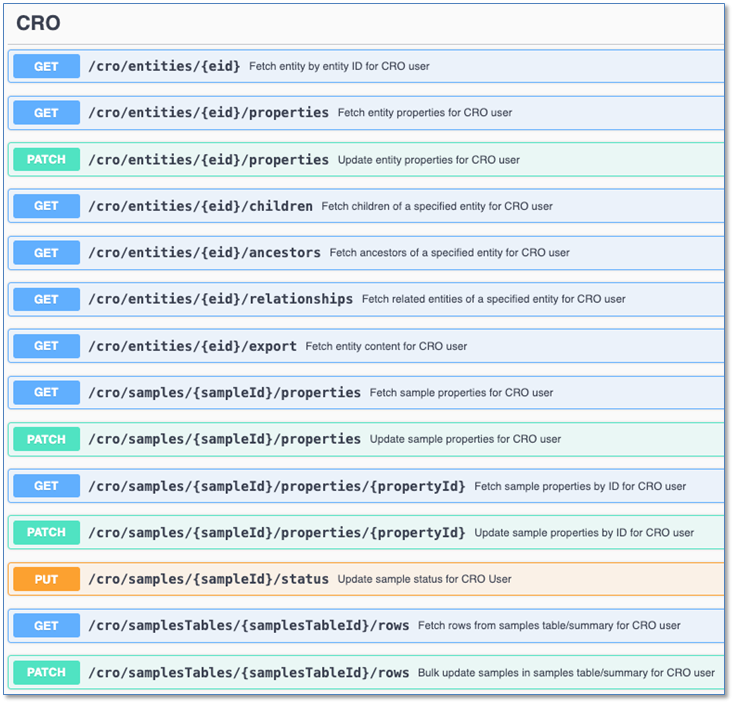
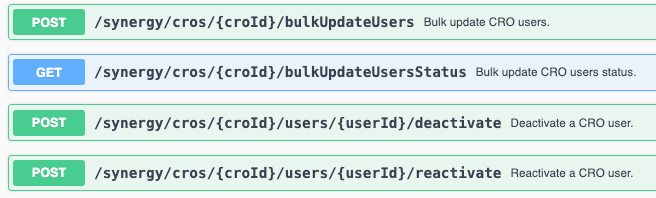
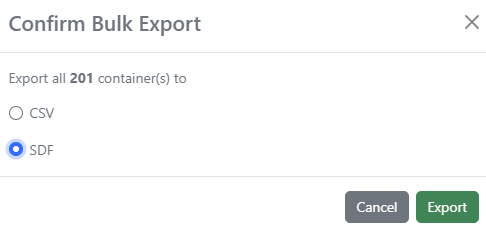
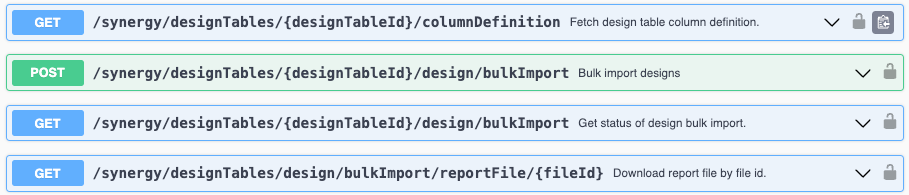
We have added new APIs to support the External Enumerator for Parallel Experiments. These APIs allow for usage of a csv or sdf file upload for use with the External Enumerator. There are APIs to fetch and update the mapping for the external enumerator. Lastly, there are APIs to kick off the enumeration and check its status.

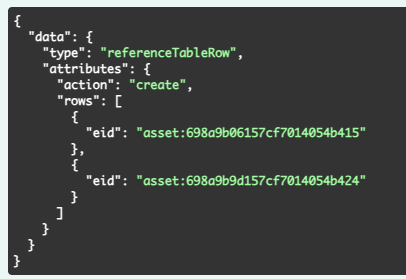
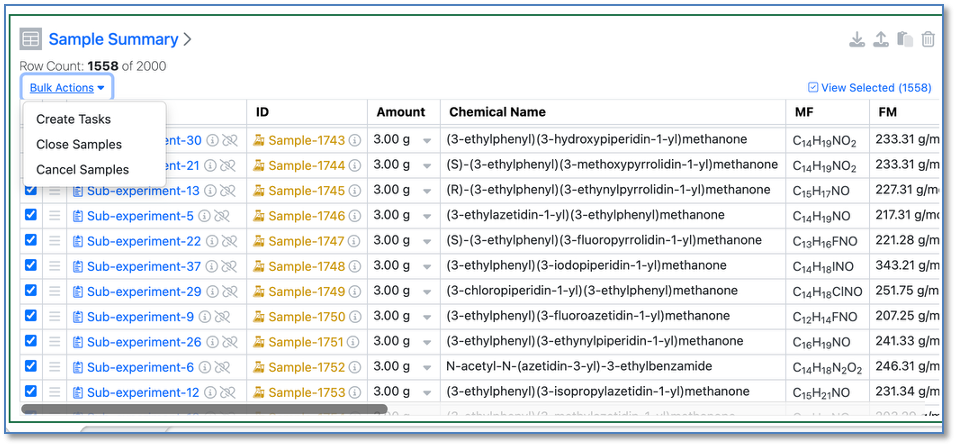
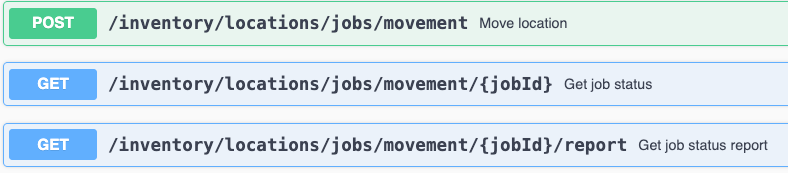
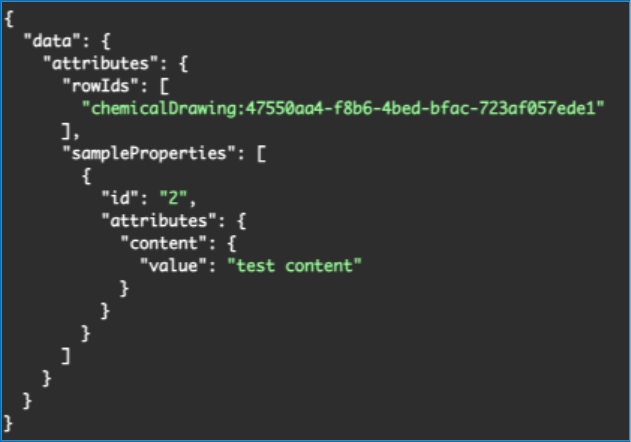
We have added new APIs to support the bulk creation of Samples in a Parallel Experiment Summary table. This is an asynchronous job which has two endpoints, first to create the job and second to check the status. There is a URL parameter to support creating multiple samples per row. The request body allows for specifying specific rowIds to create samples from, defaulting to all rows. You may also optionally specify sample properties for all samples created as part of the request body.
Beta Features
The following capabilities are in beta and are available for users, administrators and developers on the Signals platform upon request. Please contact your account representative or our support team if you would like access to the following features.
Fundamentals
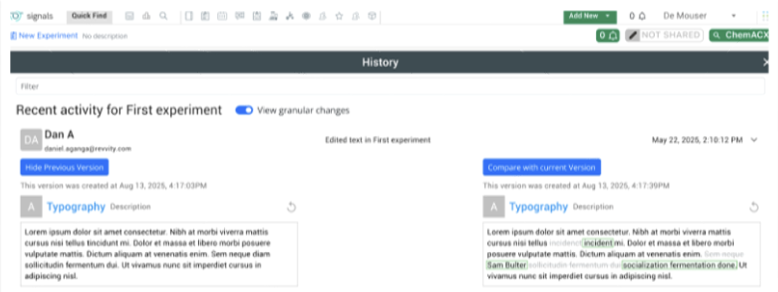
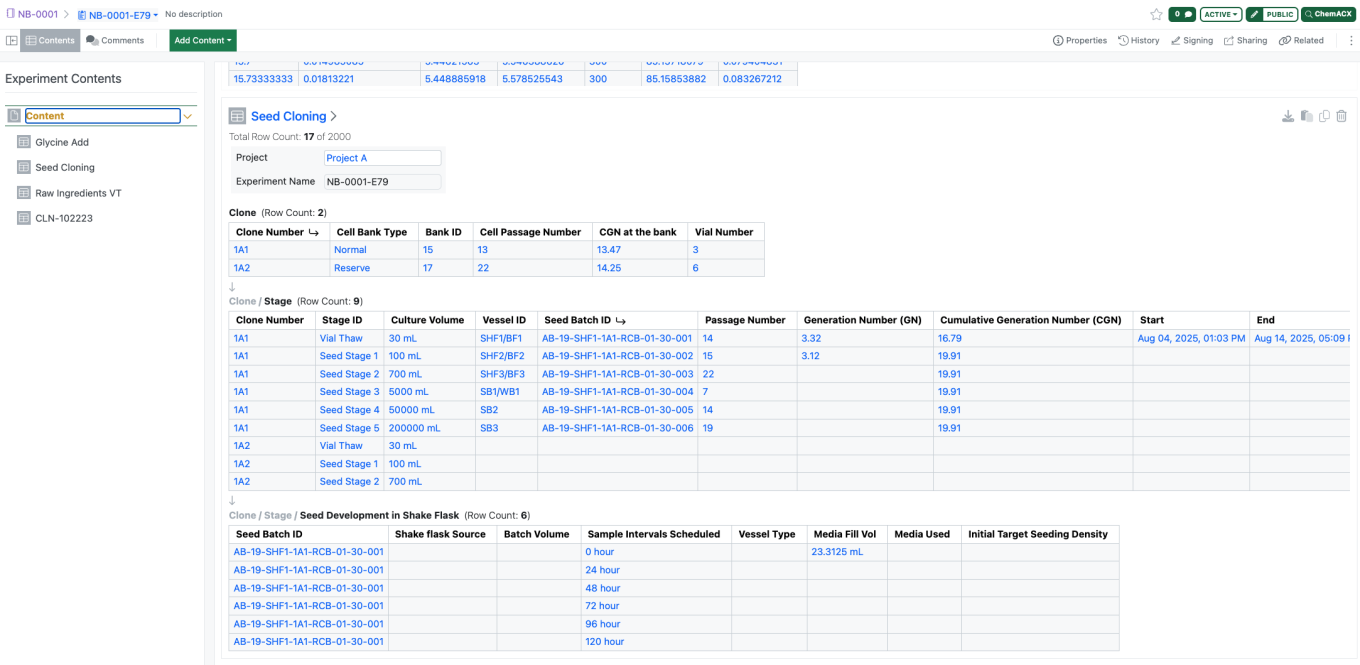
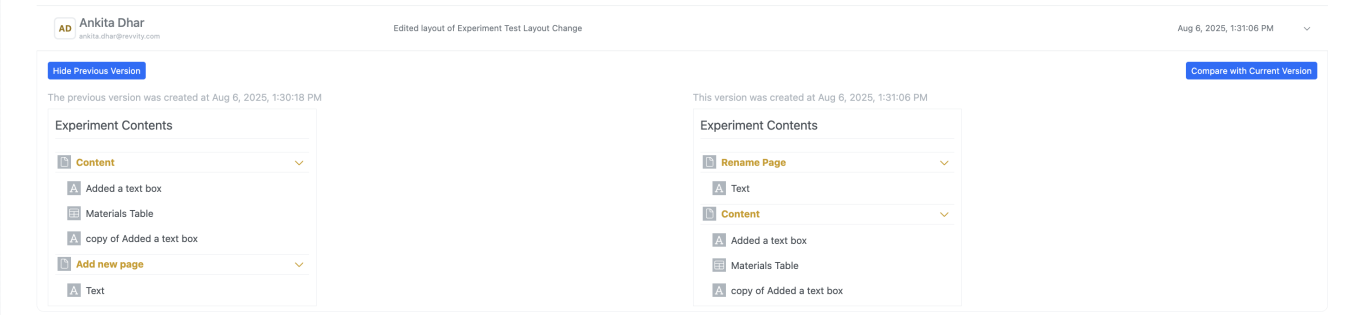
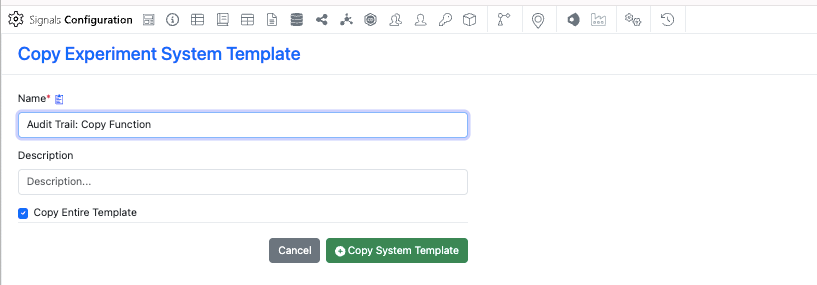
Audit trail displays highlighted granular changes within records for text elements in experiments and experiment-like objects. When users compare an audit record with a previous version, there is a "view granular changes" toggle. Selecting this toggle will show users a clear visual summary: gray highlighting shows text that was edited or removed and green highlighting shows newly added or updated text.
AI
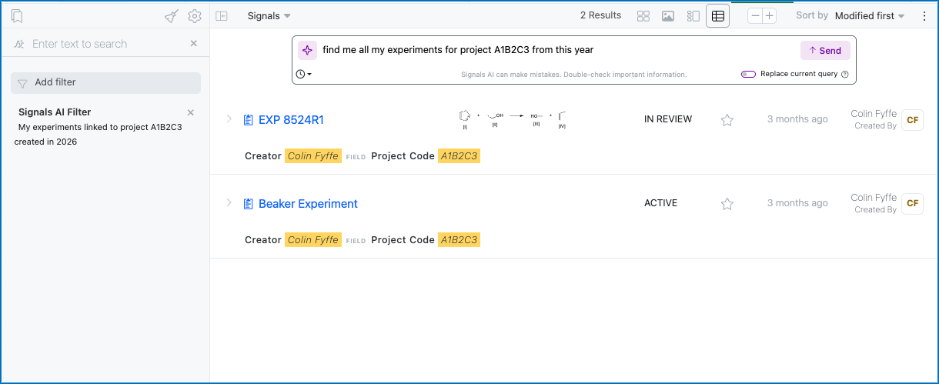
We have added a new Beta AI feature allowing a user in Advanced Search to create a filter using a natural language prompt. This filter will be added on top of your existing filters unless the toggle to replace your existing query is enabled. This is limited to Signals One customers.
Synergy
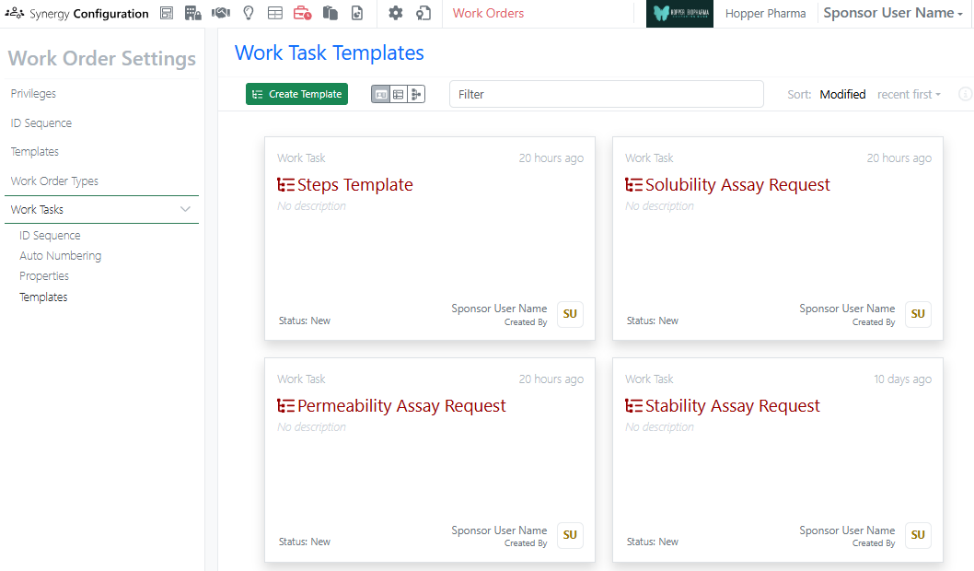
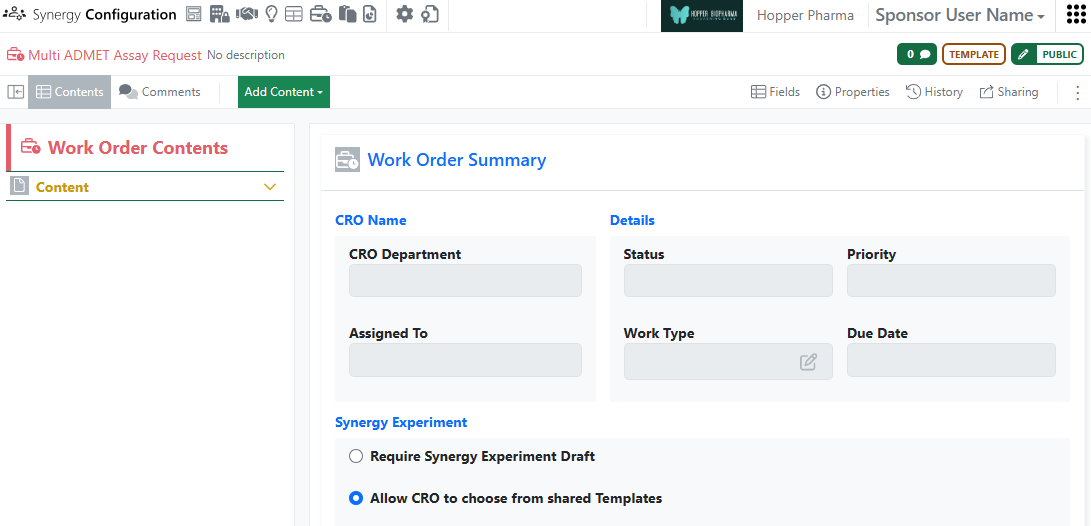
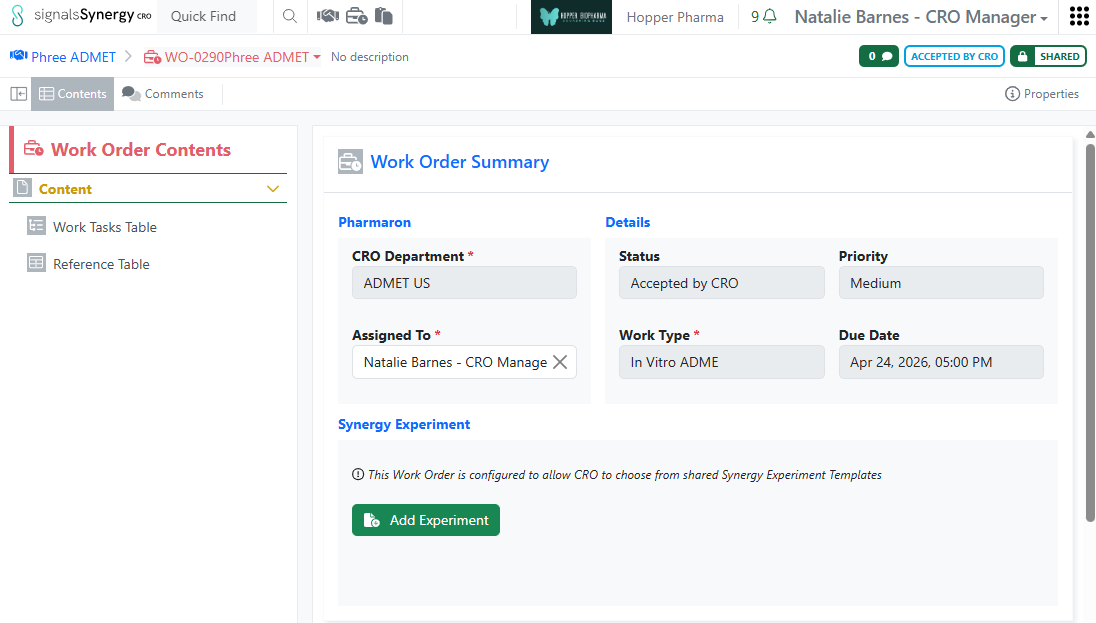
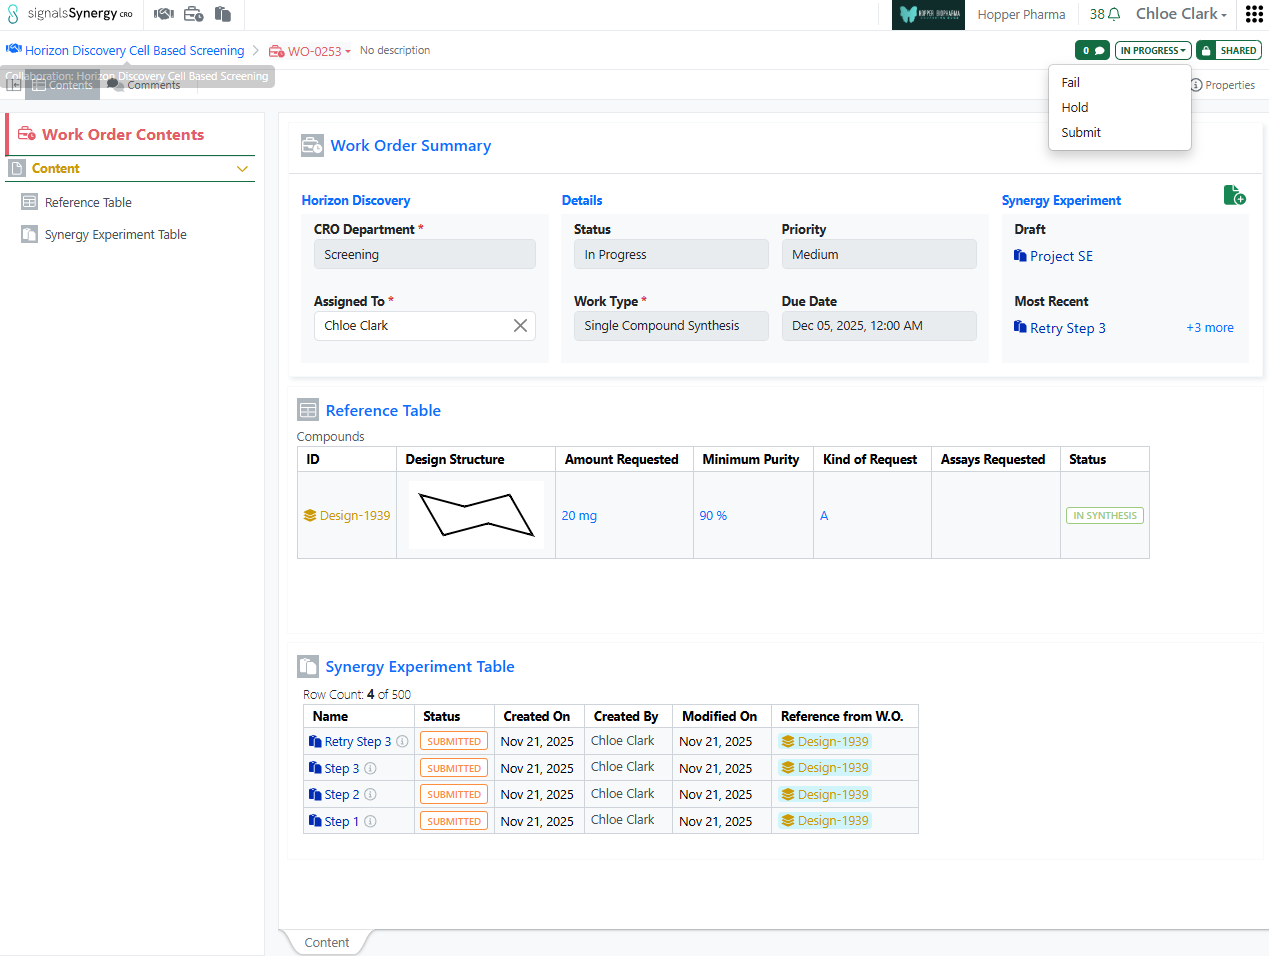
Works Tasks can now be configured and added to Work Orders to create a series of trackable, assignable, and templateable sub-tasks for a Work Order. Work Task properties and templates can be configured in Synergy Configuration > Work Orders > Work Tasks.
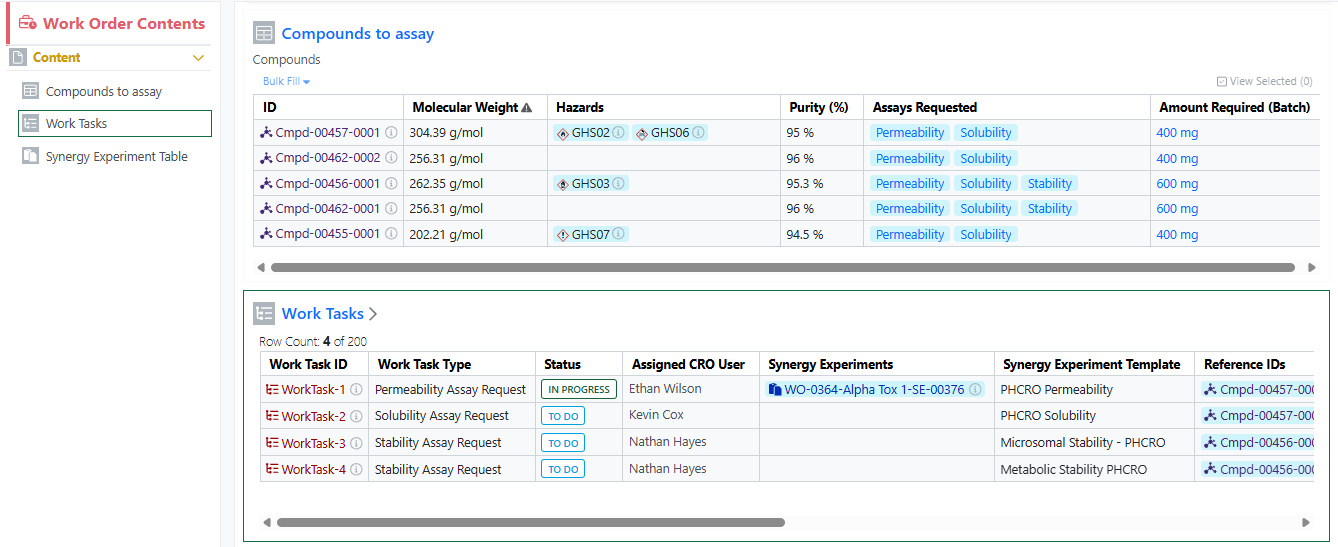
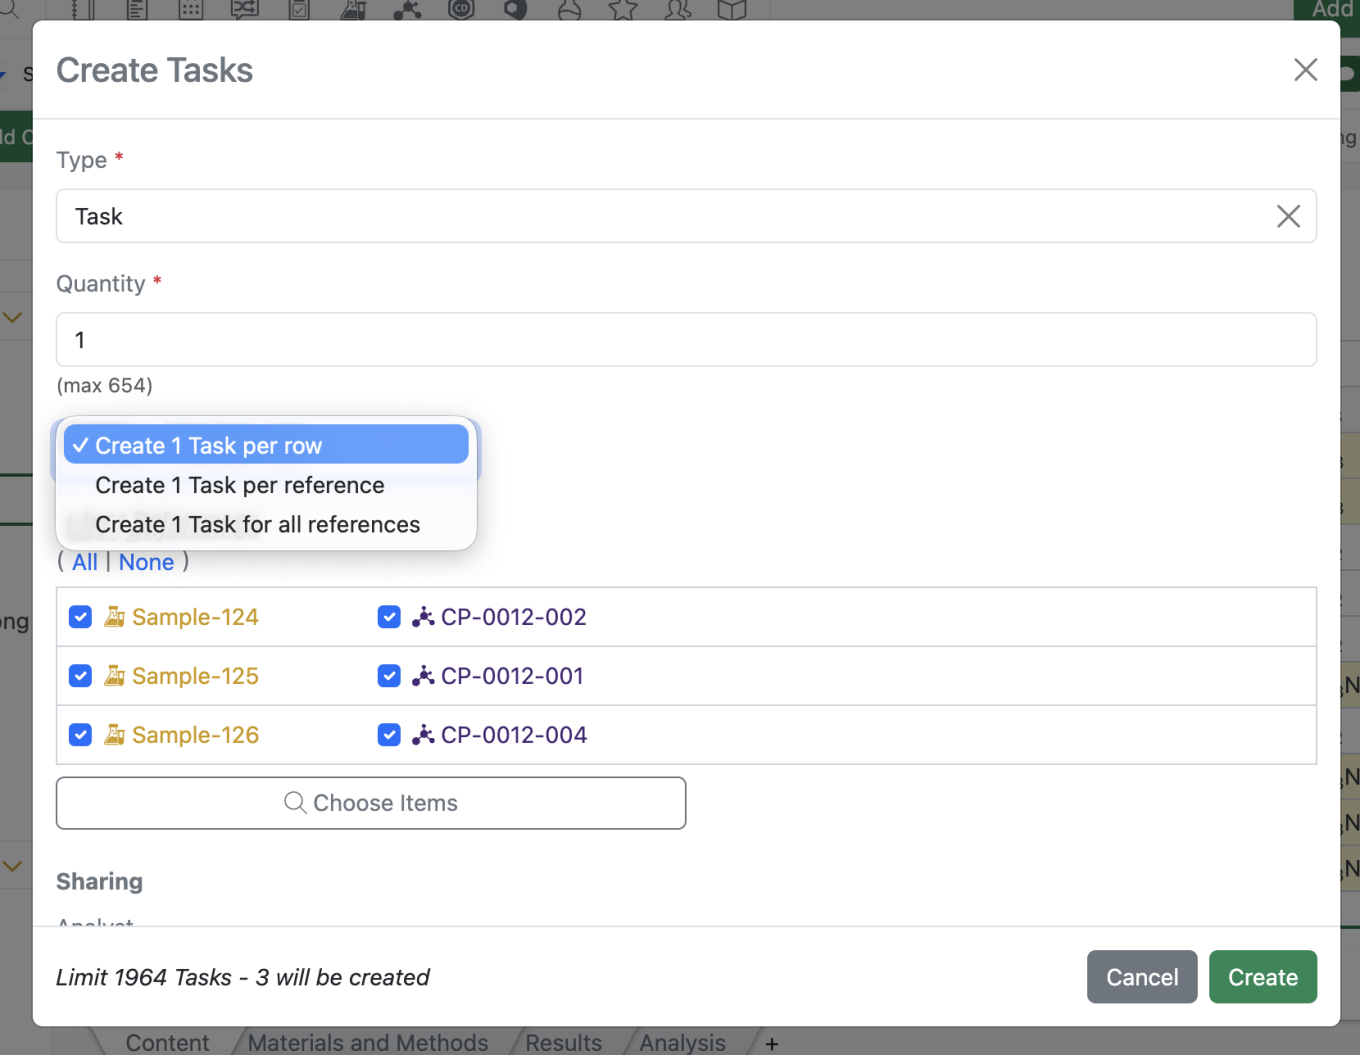
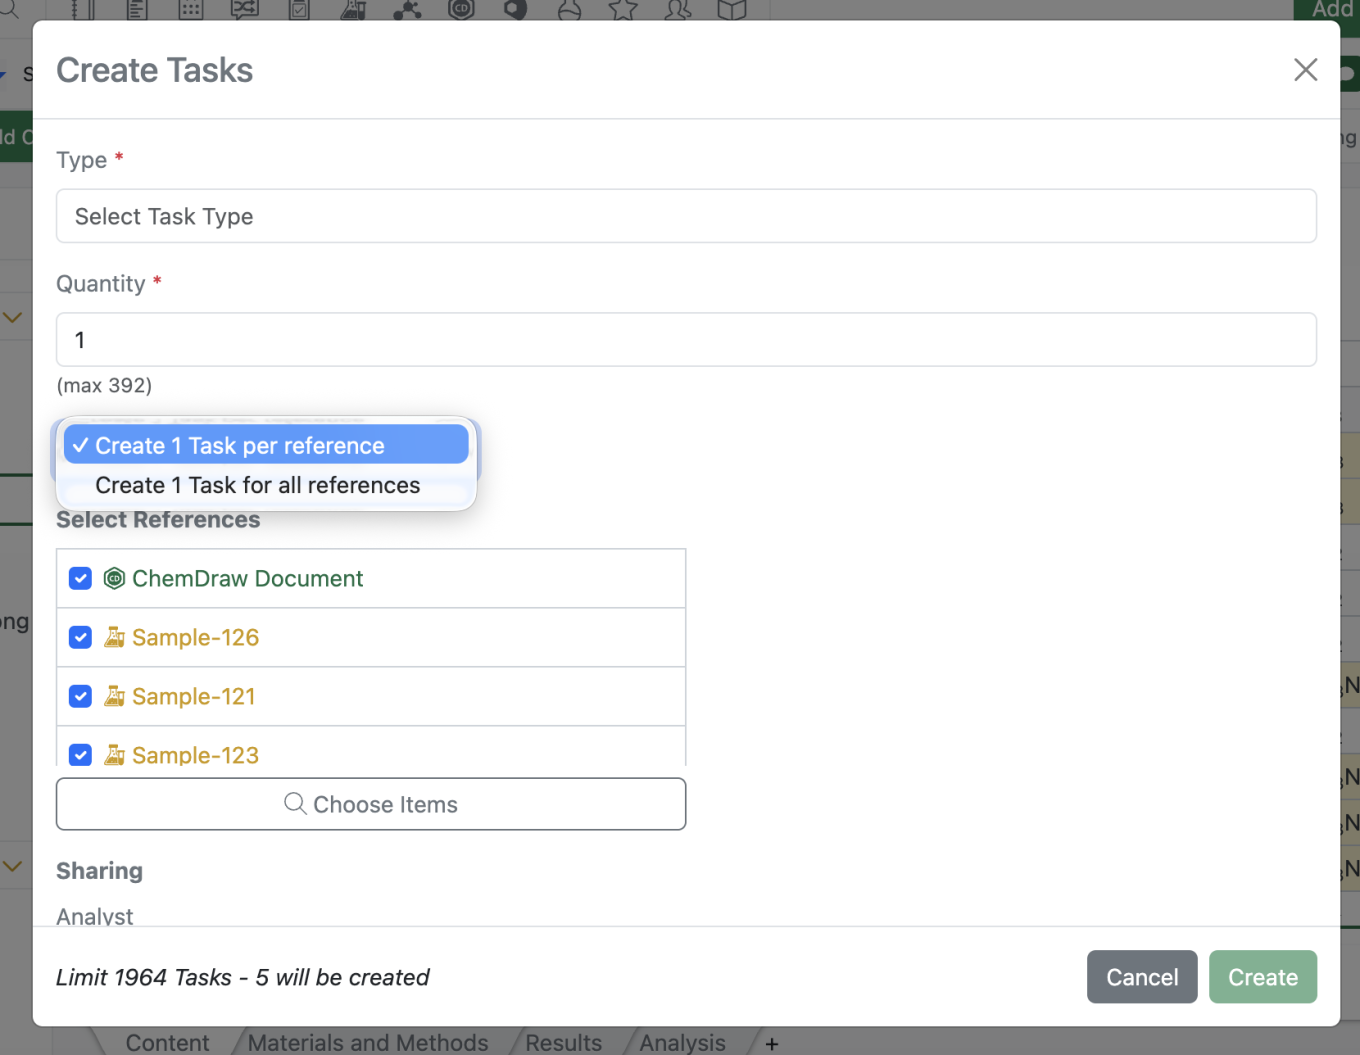
A Sponsor user can add a Work Task to a Work Order when the Work Order is in an editable status (Draft, To Do, On Hold). The Sponsor can optionally specify a Synergy Experiment Template to be used for the Work Task, as well as specify which References the Work Task applies to.
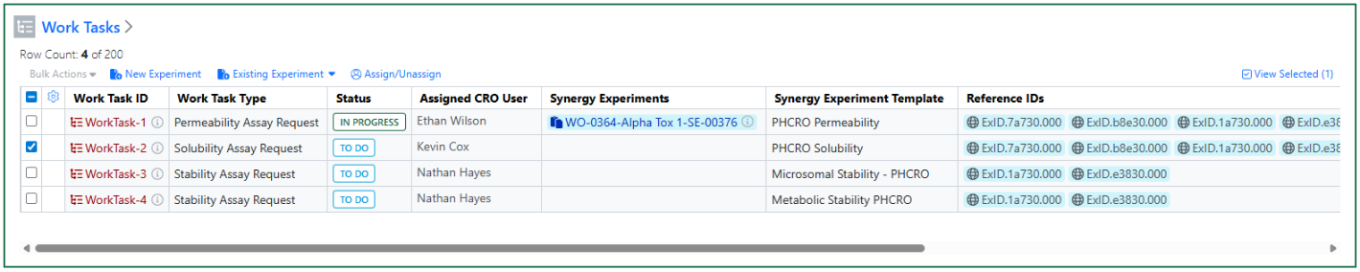
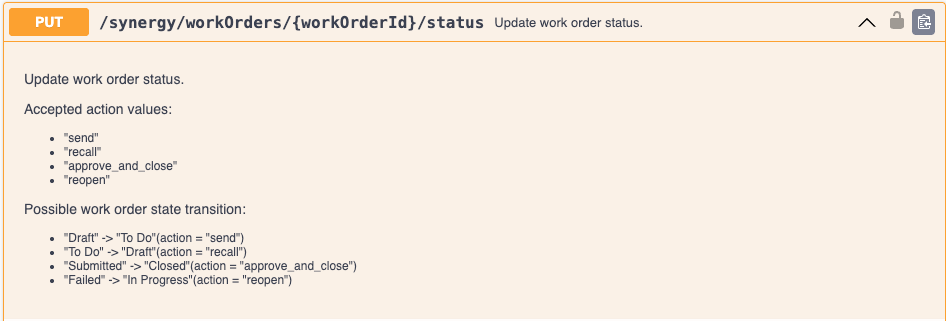
Once a Work Order is sent, Work Task(s) Status changes from New to To Do. A CRO Department manager can optionally assign the Work Task(s) to a CRO user. A CRO user can start one or more Work Tasks by selecting the Work Task(s) and creating a New Experiment or adding the Work Task to an Existing Experiment. The Work Task(s) Status then changes from To Do to In Progress.
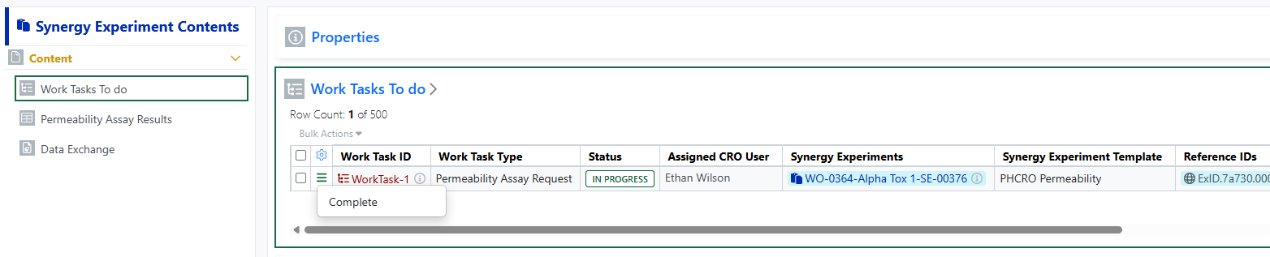
Note, when creating a New Experiment, the specified Synergy Experiment Template will be used when applicable. Also, each Work Task can have multiple Synergy Experiments associated, and additional Synergy Experiments can be added to an In Progress Work Task from the Work Task table in the Work Order.
Work Tasks display in a Work Tasks To Do table in each associated Synergy Experiment. When the task is done, the CRO user can Complete the Work Task. Work Task(s) must be Completed before submitting the Synergy Experiment.
Administration
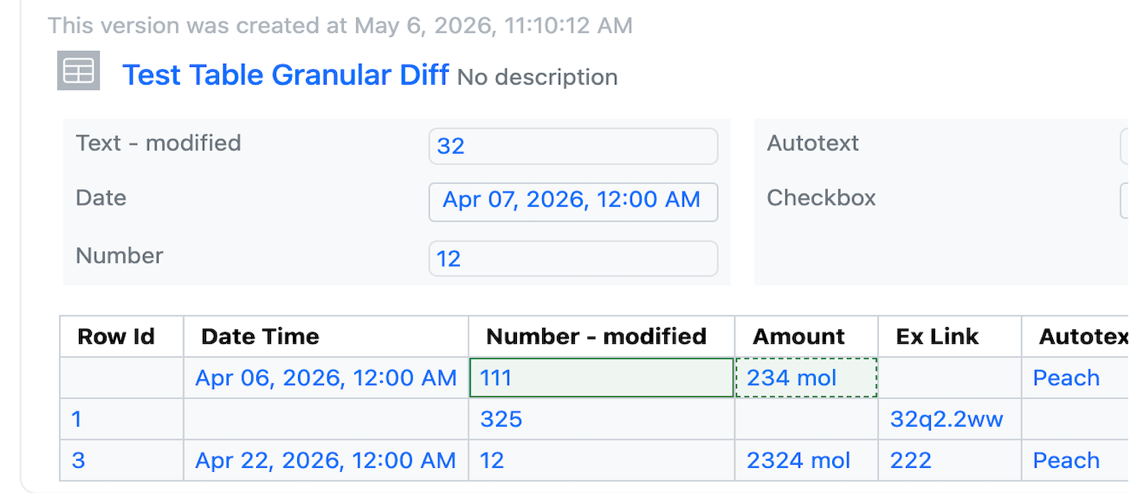
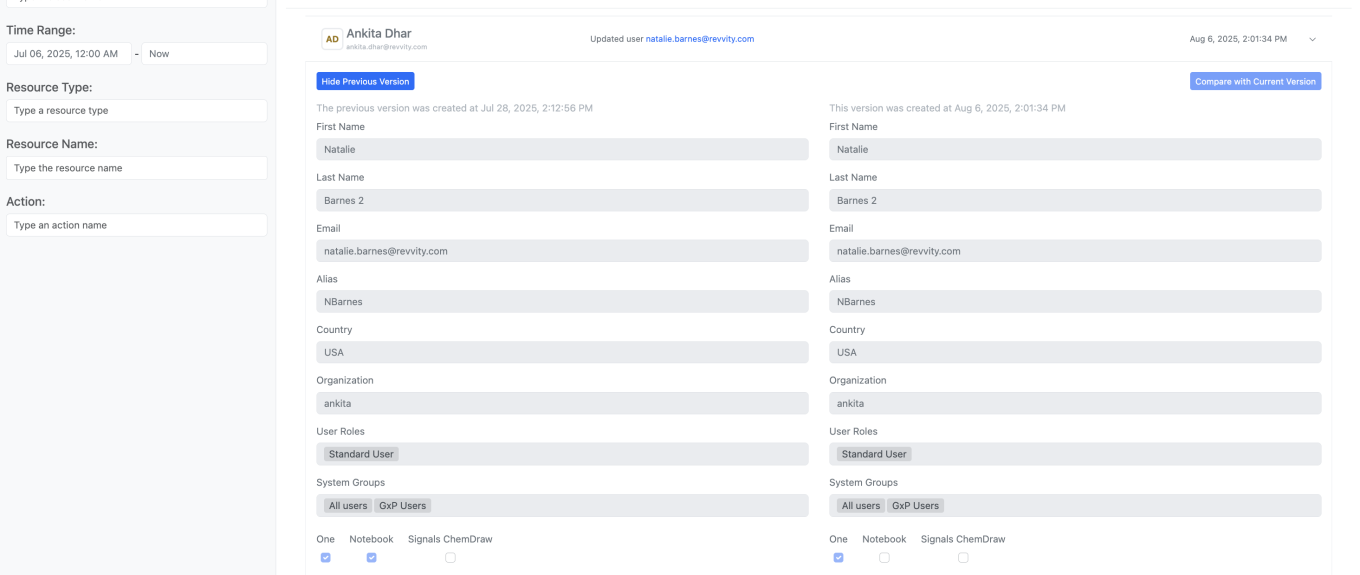
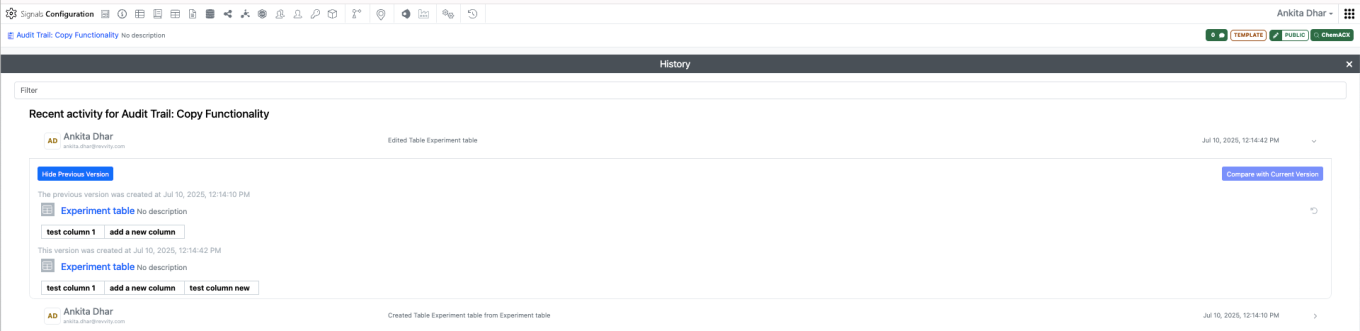
Audit trail displays highlighted granular changes within audit records for admin-defined tables. When admins or users compare a table audit record with a previous version, there is a "View granular changes" option. Selecting this toggle will show users a clear visual summary: gray highlighting shows data that was edited or removed and green highlighting surrounding table cells reflects newly added data. Green highlighting with a dashed border reflects text that was updated.