MS Workbook Suite™

Mass Spectrometry Software for Spectral Interpretation and Component Characterization

Streamline your mass spectrometry workflows and gain deeper insights.
MS Workbook Suite

Explore

One MS Software for All Your Mass Spectral Data Analysis and Management

Process MS, LC/MS, and GC/MS data acquired with instruments from any major vendor.

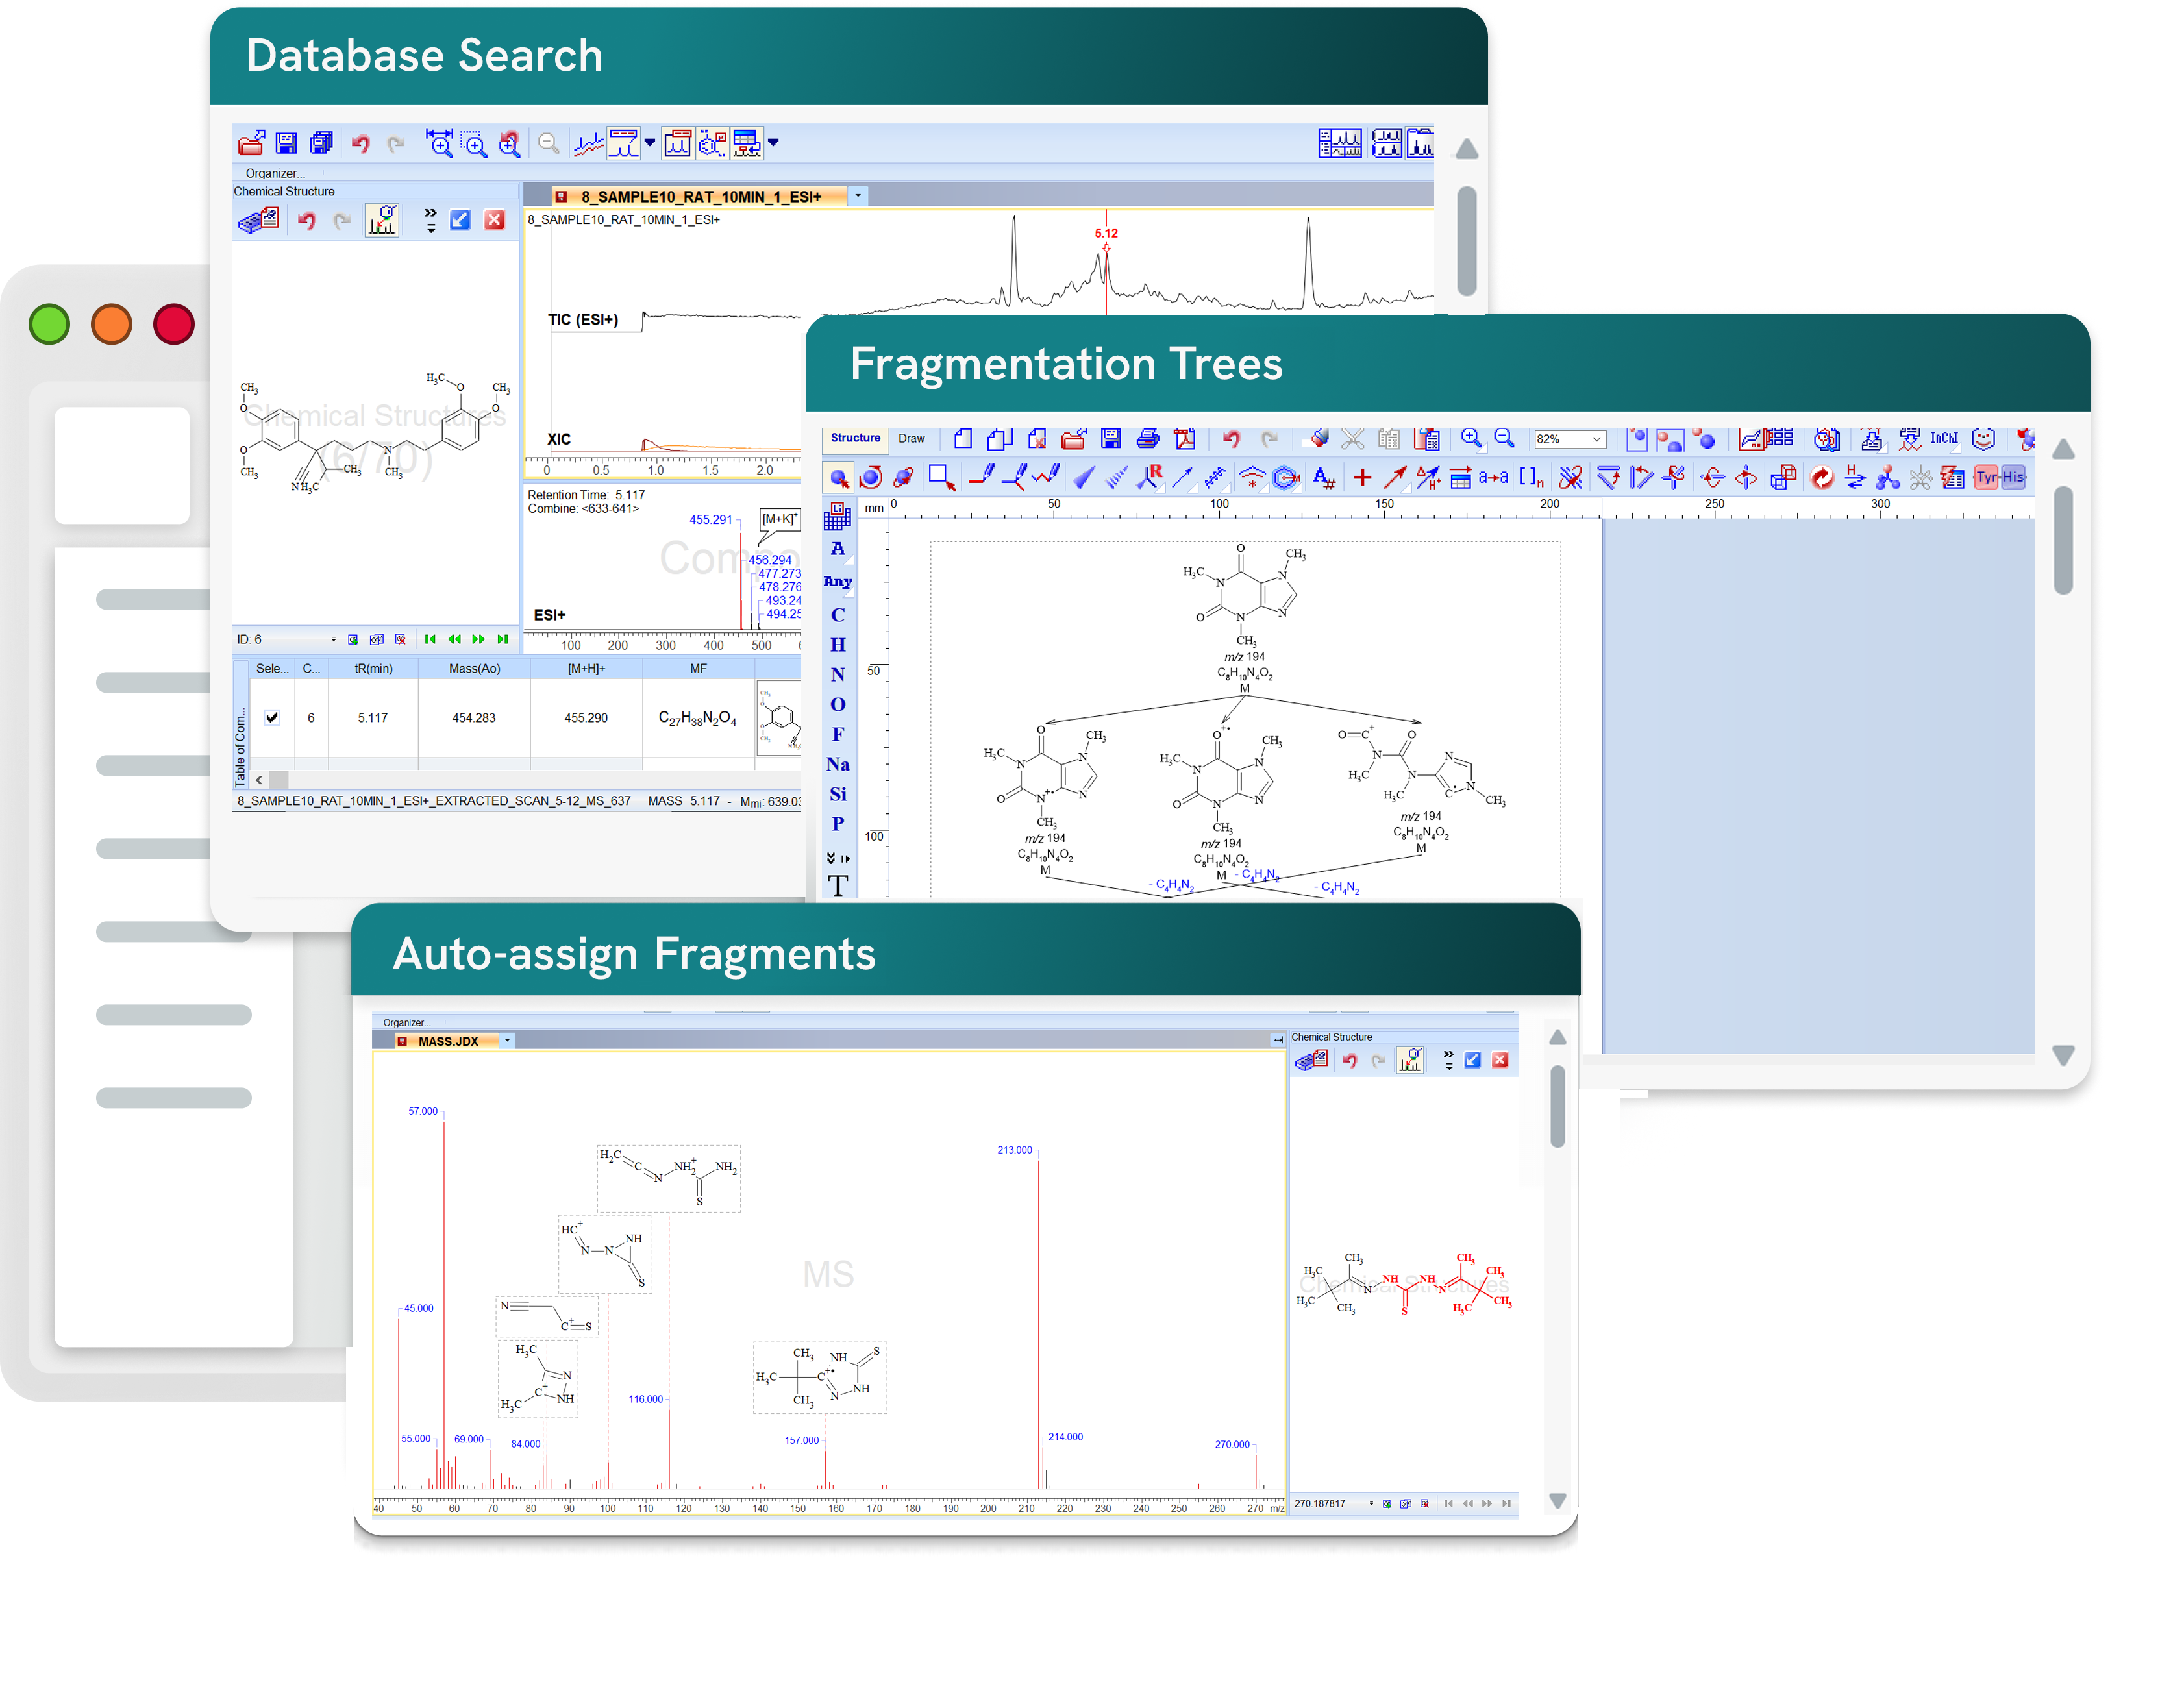
Auto-annotate peaks and associate them with compound structures.

Identify unknowns by deconvoluting spectra and searching databases for spectral matches.

Create easily shareable and searchable spectral databases.
Benefits

Complete All Your MS Processing in One Place

Auto-annotate mass spectra

  • Automatically annotate molecular, fragment, and adduct ion peaks.
  • Better understand your spectra and sample.

Identify compounds in complex samples

  • Deconvolute your LC/MS and GC/MS spectra in two clicks.
  • Identify known compounds, or putatively identify unknowns by searching commercial and proprietary libraries.

Confirm compound identity

  • Increase confidence in your structure assignment.
  • Compare predicted fragment ions to the experimental spectrum, and see the highlighted matches.

Connect mass spectra to chemistry

  • Don’t lose the context of your data.
  • Connect peaks to structures, so you’ll immediately know what you’re looking at when you come back to your files in the future.

Build your own database

  • Build a spectral database from all of your organization’s data, no matter what hardware it was collected on.
  • Everyone can find and reuse prior work, and discover if new unknowns match previous hits.

Industry Insights | Where Science Meets Strategy

Webinar

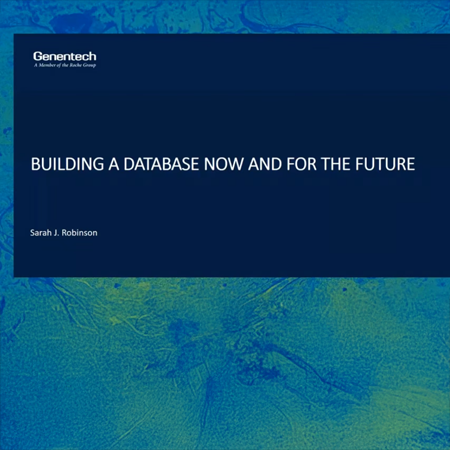
Building a Database Now and for the Future

Learn how Genentech transformed analytical data management with MS Workbook Suite, creating a centralized MS database for faster data capture, search, and reuse. Discover practical strategies to improve data accessibility, streamline structure verification, and build a scalable, AI-ready foundation that accelerates scientific decision-making and research productivity.

Case Study

Pfizer Streamlines LC/UV/MS Data Processing, Analysis, and Reporting

See how Pfizer improved LC/UV/MS workflows with MS Workbook Suite, reducing data processing time by over 50% through semi-automated analysis and reporting. Learn how standardized workflows, centralized data management, and automated processing increased productivity, improved data quality, and simplified sharing of analytical results across teams.

How it Works

An All-in-One Package for MS Data Handling

  1. Import MS, LC/MS, and GC/MS data from any major instrument vendor
  2. Deconvolute TICs into component XICs in two clicks
  3. Auto-assign spectral peaks to predicted mass fragments
  4. Automatically annotate mass spectra to mark molecular and adduct peaks
  5. Search spectral databases for any unknown component
  6. Report your results and upload them to a shared database

Features of MS Workbook Suite

    • Deconvolute LC/MS and GC/MS total ion chromatograms
      • IntelliXtract algorithm uses unique ion-thread technology to extract components
      • Automatically associate component mass spectra with each extracted peak
      • Detect components present at trace concentrations and distinguish co-eluting peaks
    • Screen for known compounds with the IntelliTarget algorithm
      • Identify expected components even at low concentrations or in complex samples
    • Identify known unknowns with the Intelligent Component Recognition workflow
      • Screen experimental MS spectra against internal or commercial libraries (e.g., Wiley, NIST)
    • Color-coded match-quality indicators rate matches by consistency of theoretical isotopic pattern with experimental data
    • Generate molecular formulae from molecular ion mass-to-charge values
    • See the full list of sample components in the Table of Components, including each compound’s retention time, mass-to-charge, structure (if available), mass spectrum, fragment ions, hit-quality indicators, and more
    • Import files in all major instrument-vendor formats
      Review the list of supported formats
    • Detect chromatographic peaks automatically
      • Adjust integration and peak-detection options or manually detect peaks to suit your data
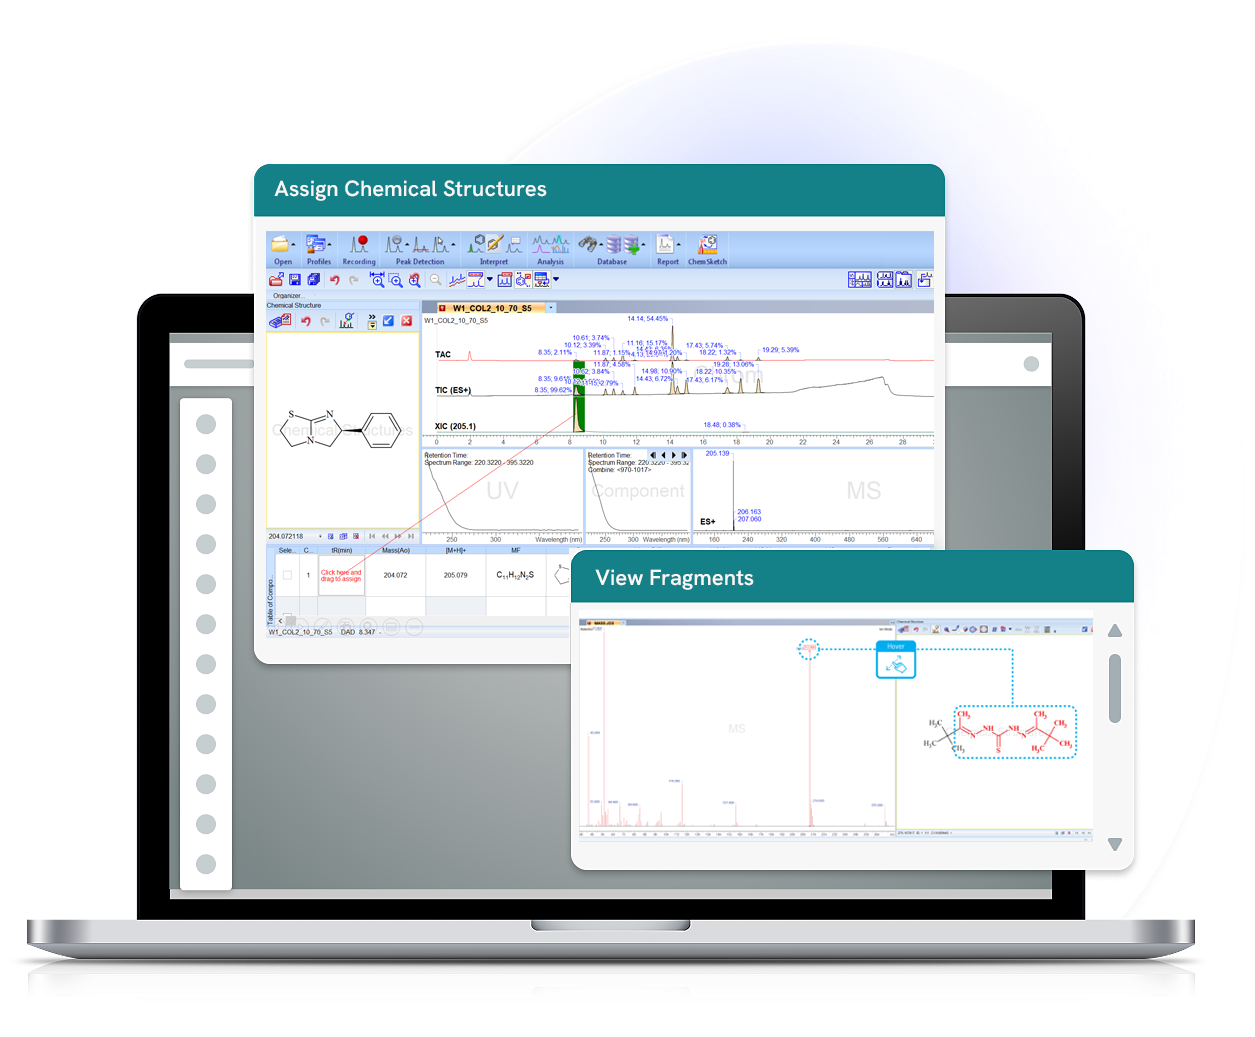
    • Assign chemical structures to chromatographic peaks (including Markush structures for ambiguous assignments)
    • Add tags to spectral features, such as isotopes, adducts, multimers, fragments, and more
    • Subtract average spectra from a total ion chromatogram, or subtract one mass spectrum from another, to remove background signals
    • Analyze data for neutral loss
      • Generate neutral-loss spectra
      • Search for peak pairs with a fixed mass difference
    • Simulate mass spectra from a molecular formula, accounting for isotopic pattern
    • Automate routine processing via macros
    • Quantify your LC/UV/MS data samples based on TIC (mass of compound), DAD (auto-extracted wavelength), or flat chromatogram (specific wavelength).
    • The quantitation tools provide curve fitting via linear regression with options to:
      • Simultaneously quantify several compounds
      • Process replicate samples
        • Plot the average and standard deviation represented by error bars
      • Option to quantify additional unknowns after the calibration project has been constructed
      • Create customizable reports containing calibration curve, compound metadata, summary table, statistics table, ANOVA table, and peaks table
      • Automatically add calibration projects and individual sample files to a database
    • Predict MS fragmentation pathways based on established literature rules
      • Estimate fragments for molecules containing up to 255 non-hydrogen atoms
    • Get results tailored to your experiment with extensive filtering options. Filter by:
      • Positive or negative ionization
      • Common fragmentation reactions (resonance reactions, ring formation, and hydride shift)
        Distonic-ion formation (hydrogen shift, double-bond cleavage, triple-bond cleavage, saturated-ring cleavage)
      • Type of bond cleaved (acrylic, non-aromatic, C-het aromatic, C-het cyclic)
      • Hydrogen rearrangements, skeletal rearrangements, oxygen loss, and neutral losses
    • View the results as a fragmentation tree
    • Review the prediction rules to learn about the mechanics behind fragmentation
    • Assign predicted fragment structures to peaks in an experimental spectrum
    • Create fully searchable, live databases containing spectra, chromatograms, spectral assignments, annotations, text notes, and more
      • Link associated documents (e.g, .docx, .xlsx, .pptx, .pdf, .txt)
    • Search databases by spectral, method, structural, and text parameters
      • Store your search history to rerun searches in multiple databases
    • Customize your database functions with scripting
    • Export data and analysis as customizable reports
    • Expand your analytical understanding by viewing data from different techniques side-by-side
    • Analyze data:
      • NMR: Fourier transform, calibrate, peak pick, integrate, and analyze multiplets
      • Optical techniques: Correct baselines, detect peaks, and smooth
        Automate basic processing workflows

    Product Comparison

    Capability MS Workbook Suite Third-Party Analytical Data Software (e.g. Mnova, Mass Analytica, Sirius) Experiment Execution Systems (e.g. Waters, Agilent, Thermo Fisher)
    Vendor Neutral Data Processing
    Intelligent Structure Assignment & Fragmentation Analysis 
    Integrated, Centralized Knowledge Management 
    Flexible, Customizable Workflows
    Structured AI/ML Ready Data
    Audit Trail & Data Integrity


    Yes   Partial/Limited   No

    What Our Customers Are Saying

    Quote from Patrick Arpino

    “[The software] can be applied to rapidly identify targeted molecules in complex mixtures, following a well-defined and validated analytical protocol. It is well adapted to rapid and automated analyses of large series of samples [and] improves and increases the selectivity performance of simple and low-cost LC/MS instruments.”

    Patrick Arpino LECIME

    Quote from David Foley

    “So we now have a gold-standard database of […] mass spectra, fully searchable. So [it] can be searched by [...] the Pfizer compound number, structure, and substructure, but also folks can do spectral matches, right? So they can input mass spectra and you say, 'Hey, is there is there a spectrum or compound in the database that matches closely?'”

    David Foley Pfizer

    Deployment/Integration Options

    Your lab probably has MS instruments from many manufacturers, and that’s not counting the NMR, IR, and other analytical equipment. We help you put all your data back together again.

    As the leader in vendor-agnostic chemistry software, we partner with dozens of vendors to support > 150 file types and thousands of instruments. So you can use the equipment you need, without worrying about having data in a dozen different formats.

    Compatible with Your Experimentation and Analysis Hardware

    MS Workbook Suite FAQs

    Ready to Take the Next Step?

    Talk to our Team

    Schedule a consultation with our experts to discuss your workflow, requirements, and implementation needs.

    Contact Us

    Take a Tour

    Discover how MS Workbook Suite can help you streamline MS data processing and improve confidence in spectral interpretation. 

    Request a Demo

    Stay up to Date

    Stay up to date on all the latest insights, research and product news from Revvity Signals.

    Stay up to Date