Spectrus Processor™

Process, Analyze, and Report All Your Analytical Data in One Interface

Work with analytical data from multiple techniques and data formats in a single environment.
 

Spectrus Processor

Explore

Streamline Multi-Technique Data Analysis

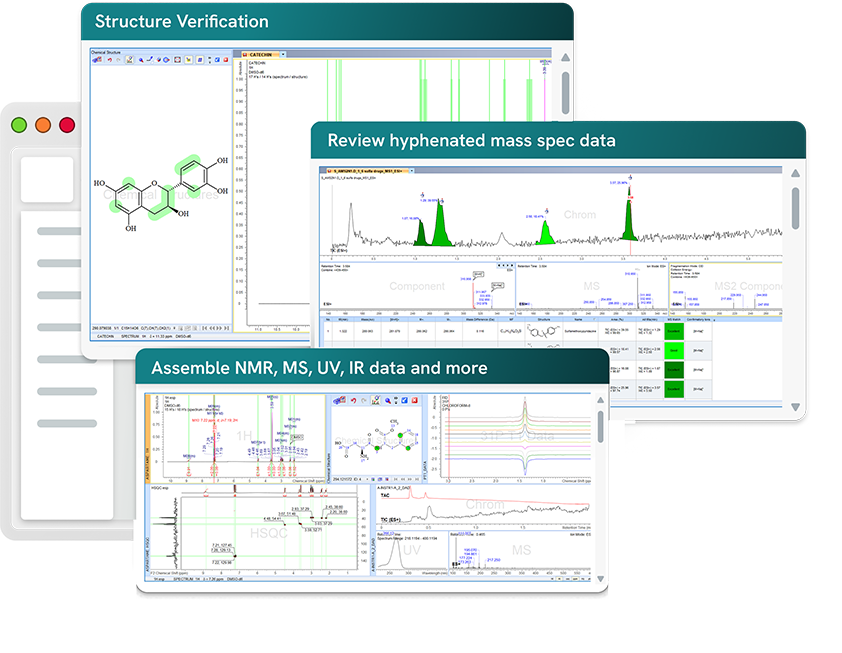
Spectrus Processor is a multi-technique, vendor-neutral software platform that processes and interprets all your spectrometric and spectroscopic data regardless of the instrument used to collect it. 

Use Spectrus Processor to:

Process analytical data from NMR, LC/MS, GC/MS, HPLC, IR, Raman, DSC, TGA, and more.

Interpret data quickly and efficiently with built-in processing, analysis, and reporting tools.

Assemble and review results from multiple experiments in a unified dashboard.

Search in-house and commercial spectral libraries, report results, and prepare publication-ready analytical data.
Benefits

Why Choose Spectrus Processor?

Work with Your Data from Anywhere

  • Conveniently process and re-process data away from the instrument
  • Simplify your software learning with just one interface to master for all your processing and analysis

Handle All Your Analytical Data in One Application

  • Import data from different analytical techniques—NMR, LC/MS, GC/MS, HPLC, IR, Raman, etc.
  • Support for most major instrument vendors, and industry-standard or open-source formats

Free-up Valuable Instrument Time for Data Acquisition

  • When you’re not tied to processing your data on the instrument software it leaves the instrument free for data acquisition

Confident Answers from Assembled Analytical Data

  • Easily assemble all related analytical and chemical information together
  • Conveniently review complimentary characterization data together for faster decisions

Accelerate Data Analysis with Database Searching

  • Search internally created and commercially available databases
  • Review search results overlaid on query spectra with colour-highlighted matching signals
  • Use chemically intelligent searches by structure, substructure, spectrum, or text

Report with Ease

  • Quickly create a comprehensive multi-technique report
  • Customize report templates to suit your needs
  • Assemble publication-ready data using popular journal templates

How it Works

Intuitive Tools for Working with 
All Your Analytical Data


  1. Drag and drop your data files into the interface
  2. Use the technique-specific functions to process your data—peak detect/peak pick, integrate, smooth, correct the baseline, generate XICs/TICs/TACs, and assign structure
  3. Evaluate structure/spectrum consistency for MS and NMR data
  4. Use included optical databases to assign peaks to structural fragments
  5. Report your analysis

Features of Spectrus Processor

    • Import data from >150 instrument vendor data formats
      Review the list of supported formats
    • Perform manual and/or automatic data processing
    • Assisted analysis and interpretation of spectral and spectrometric data
    • Search commercial libraries or internally created databases (in ACD/Labs format)
    • Create comprehensive multi-technique reports, with a single click
      • Include annotated spectra and chromatograms, peak tables, interpretation/analysis notes, zoomed spectral regions of interest, chemical structures/structure fragments, reaction schema, and more
      • Export results to Adobe PDF or copy/paste to Microsoft Word and PowerPoint
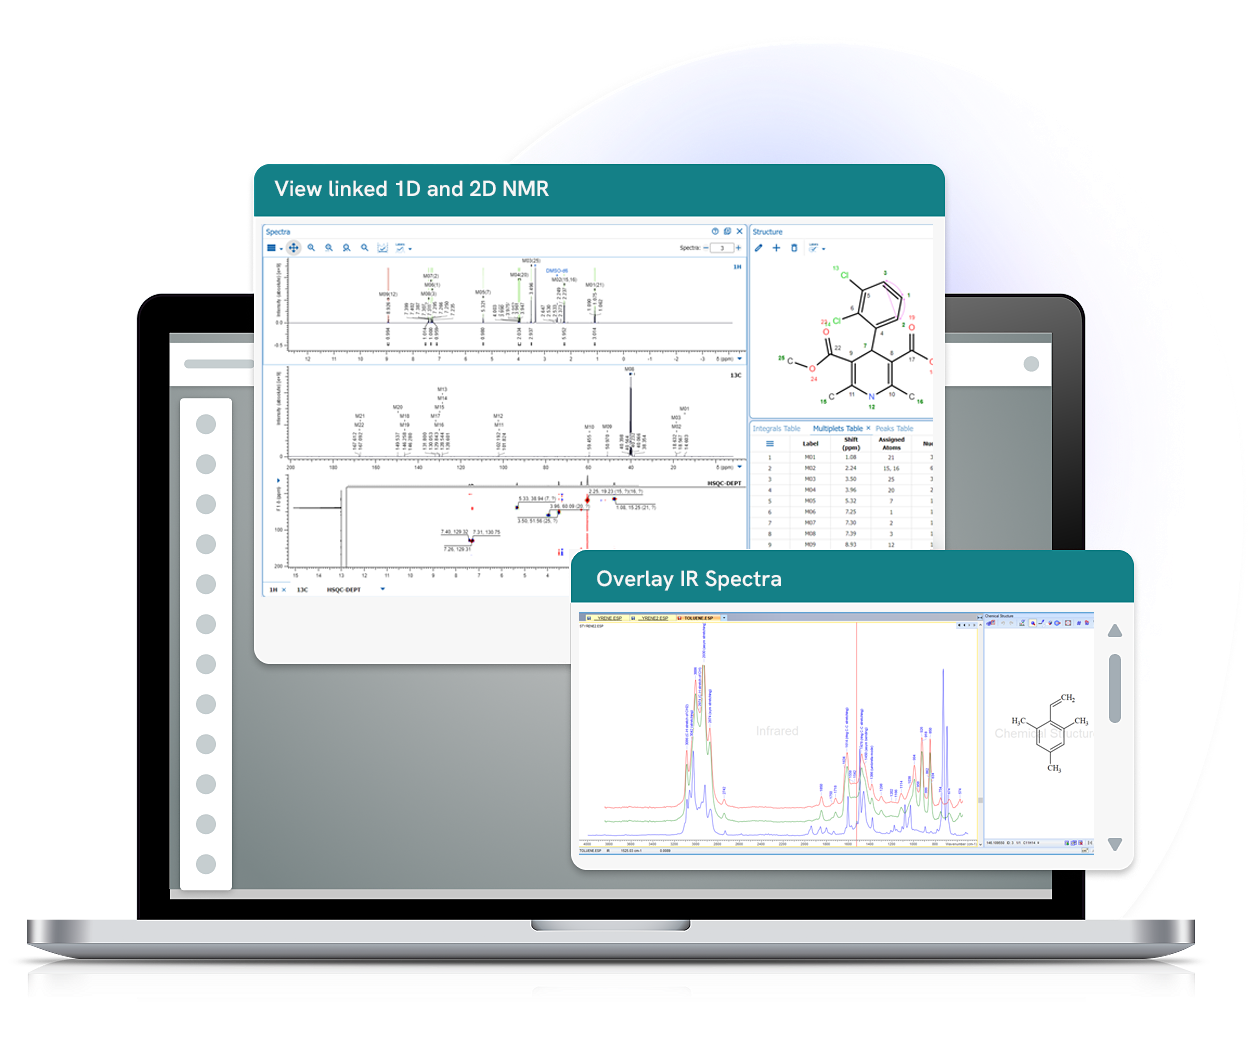
    • Import 1D NMR data (1H, 13C, DEPT, etc.) and 2D NMR data (COSY, TOCSY, HMQC/HSQC/HMBC, NOESY, HETCOR etc.) from Bruker, Agilent/Varian, JEOL, and more
    • Fourier transform, calibrate, peak pick, integrate, and carry out multiplet analysis
    • Attach chemical structures to a spectrum for real-time visual feedback on peak/atom assignments
    • Evaluate spectrum/structure consistency using quantitative NMR Match Factor values
    • Search commercial spectral libraries or use the Known Structure Add-on for fast and efficient compound identification
    • Generate formatted multiplet reports on the fly
    • Import LC/MS, LC/UV/MS, and GC/MS data from Agilent, Bruker, LECO, PerkinElmer, SCIEX, Shimadzu, Thermo Scientific, Waters, and more
    • Detect peaks and generate extracted ion chromatograms (XICs), total ion chromatograms (TICs), and total absorbance chromatograms (TACs)
    • Automatic extraction of relevant chromatogram from structure/formula/mass
    • Automatic confirmation of mass/molecular formula
    • Attach chemical structures and structure fragments to chromatographic peaks to evaluate consistency through color-coded ‘MS Match’
      • Annotate spectral peaks with structure fragments
    • Screen peaks/total spectra against spectral libraries to accelerate compound identification
    • Comprehensive one-click reports, including annotated chromatograms and spectra
    • Import chromatographic data from Agilent, Bruker, PerkinElmer, SCIEX, Shimadzu, Thermo Scientific, Waters, and more
    • Peak detect, smooth, correct the baseline, and calculate peak areas
      • Conveniently visualize chromatograms in a series
      • Assign chemical structures to chromatographic peaks
    • Create reports with structure assignments, method parameters, peak tables, annotations, and chromatograms
    • Process and interpret data from a variety of optical techniques including:
      • Infra-red spectroscopy (IR, NIR, FIR, MIR, UV-Vis)
      • Absorption
      • Raman
      • Reflectance
      • Fluorescence
      • Phosphorescence
      • Circular dichroism (CD)
      • Spectroscopic ellipsometry
    • Import data from Bruker, JASCO, PerkinElmer, Shimadzu, Thermo Scientific (Nicolet, Galactic), and more
    • Process single and multiple spectra: baseline correct, peak pick, smooth
    • Conveniently visualize spectral series
    • Attach chemical structures to spectra and assign peaks to structural fragments
    • Verify chemical structures using the knowledgebase of spectra-structure correlations or included content databases
      • ST Japan IR Demo Library
      • IRDEMO
      • IR Assigned Polymers
      • Raman Assigned Amino Acids
    • One-click reports display key elements of your analysis
    • Handle a wide range of analytical data, including:
      • EELS (Electron Energy Loss Spectra)
      • Thermal analysis (DSC, DTA, TGA)
      • DMA
      • Calorimetry
      • Titrimetric methods
      • Voltametric methods
      • X-ray methods (powder diffraction, fluorescence, and photoelectron)
      • ESR spectroscopy
      • Kinetics
    • Perform various X- and Y-axis conversions and data manipulation manually or automatically
    • Attach chemical structures to curves
    • Conveniently visualize and compare series of related spectra
    • Perform spectral based database searches
    • Report your analysis with a single click

    Product Comparison

    Capability Spectrus Processor Third-Party Analytical Data Software Instrument Vendor Software
    Unified Multi-technique Data Processing
    Half_Bullet.svg
    Half_Bullet.svg
    Vendor Neutral
    Empty_Bullet.svg
    Structure Verification
    Half_Bullet.svg
    Empty_Bullet.svg
    Integrated Chemical Structures
    Half_Bullet.svg
    Empty_Bullet.svg
    One-click, Multi-technique Reports
    Half_Bullet.svg
    Empty_Bullet.svg
    Database Search Capabilities
    Half_Bullet.svg
    Half_Bullet.svg
    Structured, AI-ready data
    Half_Bullet.svg
    Half_Bullet.svg


    Yes     Partial/Limited     No


    What Our Customers Are Saying About Spectrus Processor

    Quote from Matthew Jones

    “All our routine analyses are being processed and reported using Spectrus Processor...it’s fairly intuitive and the users have been happy with it. In the short time I played with the IR tools I was able to get more out of the data than with the original instrument vendor software.”

    Matthew Jones Takeda

    Quote from Dr. Rainer Ebel

    “Spectrus Processor is a really powerful tool for processing NMR, MS, IR, and chromatographic data. It is very user-friendly and intuitive. One of its major strengths is that it is independent of the instrument manufacturer.”

    Dr. Rainer Ebel University of Aberdeen

    Quote from Dr. Amin Mirza

    "We provide our medicinal chemists with a dozen LC/MS, LC/UV, and NMR instruments from various vendors including Agilent, Bruker, Gilson, Thermo, and Waters. Using one tool to process and analyze all this data, instead of a suite of five or more, will certainly streamline the efforts of my group."

    Dr. Amin Mirza Institute of Cancer Research

    Quote from Dr. Karen Yuen

    "We have been using Spectrus Processor to analyze our chemical and analytical data. The ability to review data from multiple analytical techniques in a single environment has been most beneficial for us. The interface is very user-friendly and the transition from our previous combinations of software was exceptionally smooth."

    Dr. Karen Yuen OTI Lumionics Inc.

    Compatible with All Your Instruments and Techniques

    Spectrus Processor FAQs

    Ready to take the next step?

    Request a Quote

    Spectrus Processor helps with routine and advanced multi-technique data processing, analysis, and reporting. Get more info on pricing options.

    Get a Quote

    Take a Tour

    See how Spectrus Processor helps you process, compare, and report results in one interface.

    Take a Tour

    Stay up to date

    Stay up-to-date on all the latest insights, research and product news from Revvity Signals.

    Stay up to date