
What’s New
We are delighted to release our new version of AutoChrom®, Version 2026.
Highlighted Features
- Accelerate method development with end-to-end automation.
- Create composite chromatograms.
- Improved searchability of method parameters in database.
Administrators are recommended to subscribe to the channels within our support news site found at https://support.revvitysignals.com/hc/en-us/categories/360004446171-Support-News which contains more information about releases and other pertinent product information.
Further Details
Version 2026 adds new features including end-to-end automation of method development. There are also improvements to reporting, and more.
Data Analysis & Processing
Accelerate Method Development with End-to-End Automation
New end-to-end automation capabilities streamline method development workflows. You can now automate the entire method development lifecycle from screening through optimization, reducing hands-on time, minimizing human error, and enabling unattended execution of routine workflows, so methods can run overnight or in the background.
- The new Auto-Proceed feature automates almost every step of a standard method development workflow (excluding data processing), saving time and improving workflow consistency.
Create Composite Chromatograms
You can now create a single composite chromatogram by combining multiple experimental chromatograms acquired using the same chromatographic method, to provide a clearer representation of the expected separation when method suitability criteria are met.
- Composite chromatograms are automatically labeled with an asterisk (*) after the original chromatogram name, helping you to quickly identify combined data in your project.
-
Two experimental chromatograms can be merged when:
-
All optimization factor values are defined and identical between chromatograms
-
Chromatograms use the same detector parameters
-
Easier Interpretation of Method Optimization Results
- You can now view the calculated Method Operable Design Region (MODR) as both a graphical rectangle and numeric text in the status bar of the Resolution Map window, making it easier to interpret optimization results and identify suitable operating conditions.
Simplified Configuration of Autonomous Processing
- You can now edit the configuration settings for Autonomous Processing in a dedicated dialog box, making it easier to configure, save, and reuse processing parameters.
Component Spectrum Flexibility
- You can now create component spectra based on the most abundant adduct ion ([M+H]+, [M+NH4]+, [M+K]+, etc.) This is particularly useful when the [M+H]+ ion is weak or exhibits a very low intensity.
Better Handling of Peptide Structures
- Peptides can now be displayed in a simplified form in the Table of Components, making it easier to distinguish and interpret individual structures.
Import Components without Retention Time Assignments
- You can now use existing datafiles to generate target lists (.sdf) for more streamlined batch processing. Components can be imported with or without existing retention times, reducing erroneous assignments and enabling reuse of component files across targeted analysis and other workflows.
Display Combined Retention Time
- You can now display the combined retention time (tR) instead of scan numbers for clearer interpretation of chromatographic data.
Databasing
Improved Searchability of Method Parameters in Database
Enhancements to method parameter management in the database minimizes time-consuming manual searches and removes the need to recreate project files. You can now expect greater ease in searching and maintaining LC Simulator projects with the ability to:
- Add LC Simulator files (.lc7) to the database, enabling rapid retrieval and comparison of method parameters across projects
- Maintain and update stored method information without recreating project files by editing/updating stored .lc7 files, including chemical structures, selection mode, and prediction mode, preserving your existing work and streamlining ongoing method management.
More Convenient Review of LC Simulator Project Records
Managing and reviewing LC Simulator projects is now faster and more intuitive. You now have a ready-to-use database template and improved navigation that reduces the time spent searching for and switching between related projects. You can now edit and update LC Simulator (.lc7) files in Spectrus databases.
- A new example Spectrus DB database record containing the LC Simulator Project screen form provides a ready-to-use template for creating local or remote LC Simulator project databases, eliminating the need to build project structures from scratch.
- Improved navigation allows you to move between multiple LC Simulator projects stored on the same parent record more quickly and easily, reducing review time and keeping your workflow moving.
- You can now create a Spectrus DB screen form for convenient review of LC Simulator Project records.
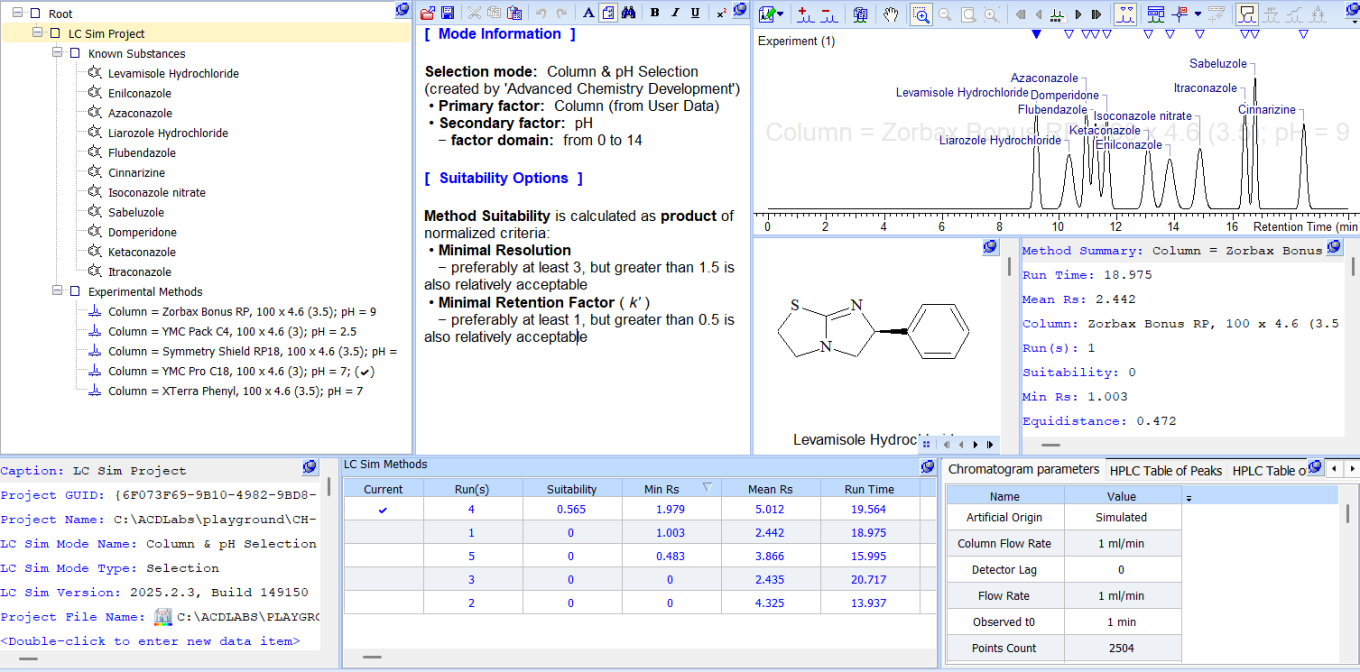
Handle LC Simulator files in database view.
Ease of Use
- Choose to hide the “Custom Screen Form” toolbar for greater screen real-estate.
- You now have a new option to visualize the stereochemical configuration of select stereocenters in database records. Previously you could either display or hide all stereocenters.
Reporting
Greater Flexibility and Consistency Across Reporting
Reporting templates have been enhanced to provide greater flexibility and consistency across products.
- The reporting template now supports gradient substitution, MODR substitution for the current variable gradient parameter, and custom defined gradient parameters.
These enhancements simplify report creation and enable more comprehensive presentation of method development results.
Select Components for Reporting
- You can now choose which components from the Table of Components are included in reports when using the Component/Peak Layout Organizer.
Simplified Peptide Reporting
- You can now report peptides in a simplified form for clearer presentation in reports.
Ease of Use
- You can now more easily locate and configure frequently used settings with the simplified Component Interpretation Options dialog box.
Data Import & Export
Improved MS & Chrom Data Import
- Improved import filters for Thermo UVPD MSn data.
Include Structure Information in Data Exported in JSON Format
- You can now include structure information in records/databases exported in JSON format via .mol files.
Processing NMR Data
Data Analysis & Processing
Internal Standard qNMR Concentration Calculation Now Included Out of the Box
- Internal standard qNMR calculations are now available in the interface, similar to the external standard workflow (previously available as a script provided upon request).
Conveniently Calculate Similarity Score Between Two 1D Spectra
- You can now calculate the Hit Quality Index (HQI) between two 1D spectra of the same nucleus without the need for the reference spectrum to be in a database. This can provide a quick quantification of the match between the current sample spectrum and that of a standard.
Better Peak Handling for 19F Spectra with Strong Couplings
- You can now automatically pick and assign peaks in 19F spectra of structures containing CHF2 groups more accurately. When the proposed structure contains these groups, the software checks the spectrum for peaks associated with a typical AB spin system for F atoms (two strongly coupled doublets with an evident ‘roof’ effect).
Expanded 1H-31P Coupling Ranges in Auto Assignment
-
You can now more accurately assign and verify structures whose spectra contain large 1H-31P coupling constants with increased upper limits for JHP. The new expanded ranges are:
-
3–20 Hz for 2JHP
-
0–20 Hz for 3JHP
-
0–6 Hz for 4JHP
-
Define Parameters Once for All Replicates in External Standard qNMR
- You can now define parameters including pulse angle, scans, and receiver gain once and have them applied to all selected spectra in external standard qNMR workflows with replicates when they cannot be automatically extracted from the raw data files.
Reporting
Set the Relative Height of “Median” Peak in Report
- You can now better control the “Fit” option for dynamic Y-scaling of the 1D spectra in the reporting templates with the new Ratio parameter that allows you to specify the relative height of the “median” peak in the report.
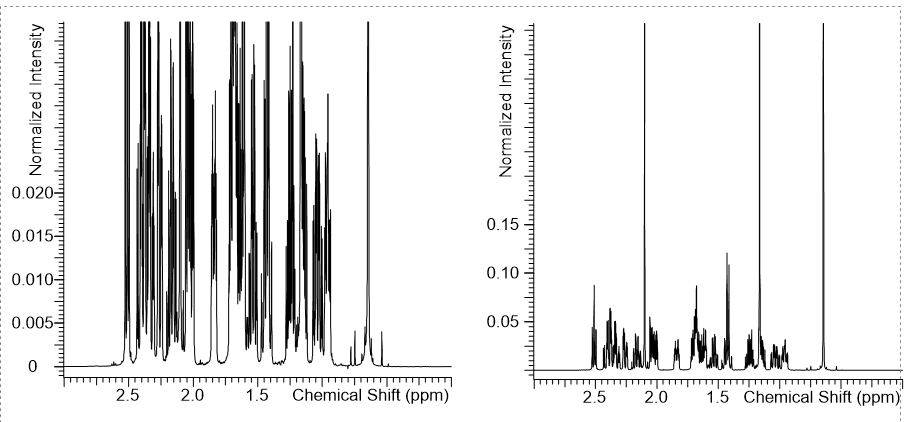
Use the new ratio parameter for dynamic y-scaling of 1D spectra.
Left spectrum has a fit = 90%, right = 10%