Search

Your Notifications (0)

There are currently no notifications. You're all set!

What's New

Explore recent and historical product updates for Revvity Signals' Cloud Native SaaS Software 

Clear All Collapse All

5 releases — this page expanded. Collapse

What's New

We are delighted to release our new version of Signals, 26.3. This release brings enhancements in In Vitro Analysis, Synergy, Inventory, and Chemistry amongst others. We have extended beta capabilities around graphing in tables and curve fit definitions. The beta capabilities around calculated properties for protein complexes are now available to all systems. Finally, we have also fixed a number of small bugs.

The following improvements are available for users, administrators and developers on the Signals platform. Certain features may only be available with appropriate licensing and/or with enablement by an administrator. 

  • Fundamentals
    – The PDF export of experiments can be converted to local time in ISO 8601 format
  • Data Workflows & Analytics*
    – Personal Templates support in the In Vitro Analysis
    – Initial support for custom curve fit definitions and publication (beta)
  • Synergy†
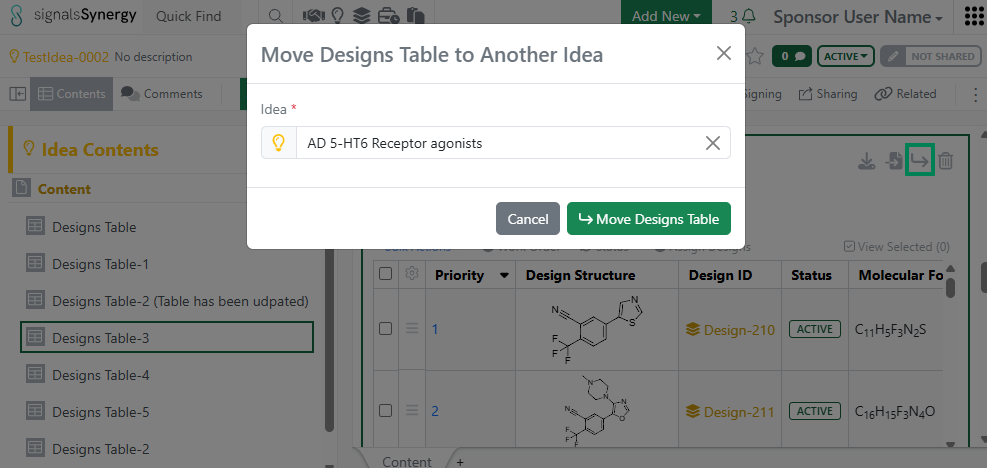
    – Move Designs Table to different Idea
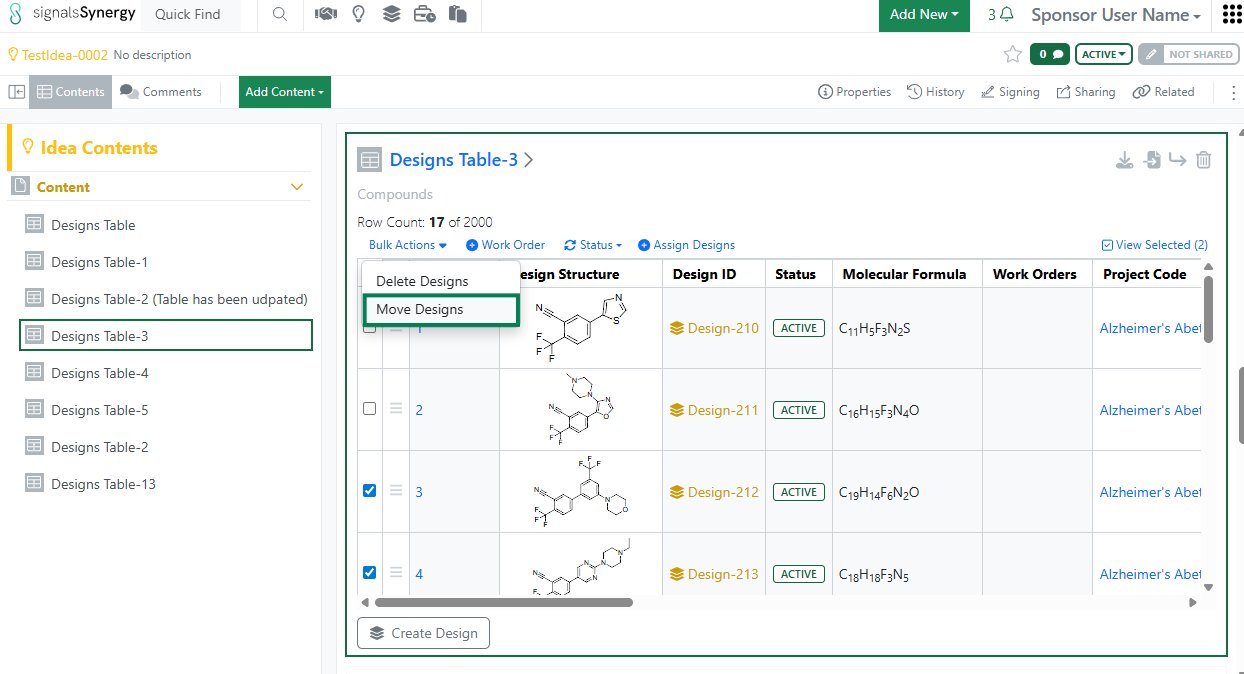
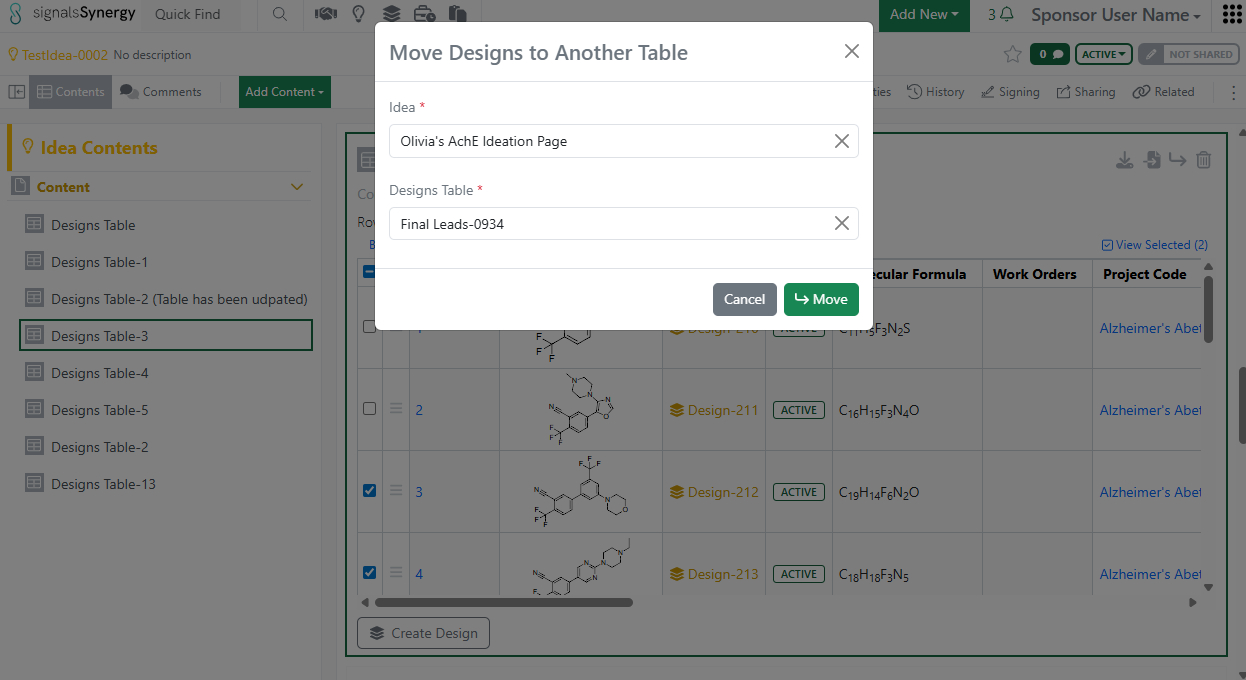
    – Move Design(s) to different Designs Table or Idea
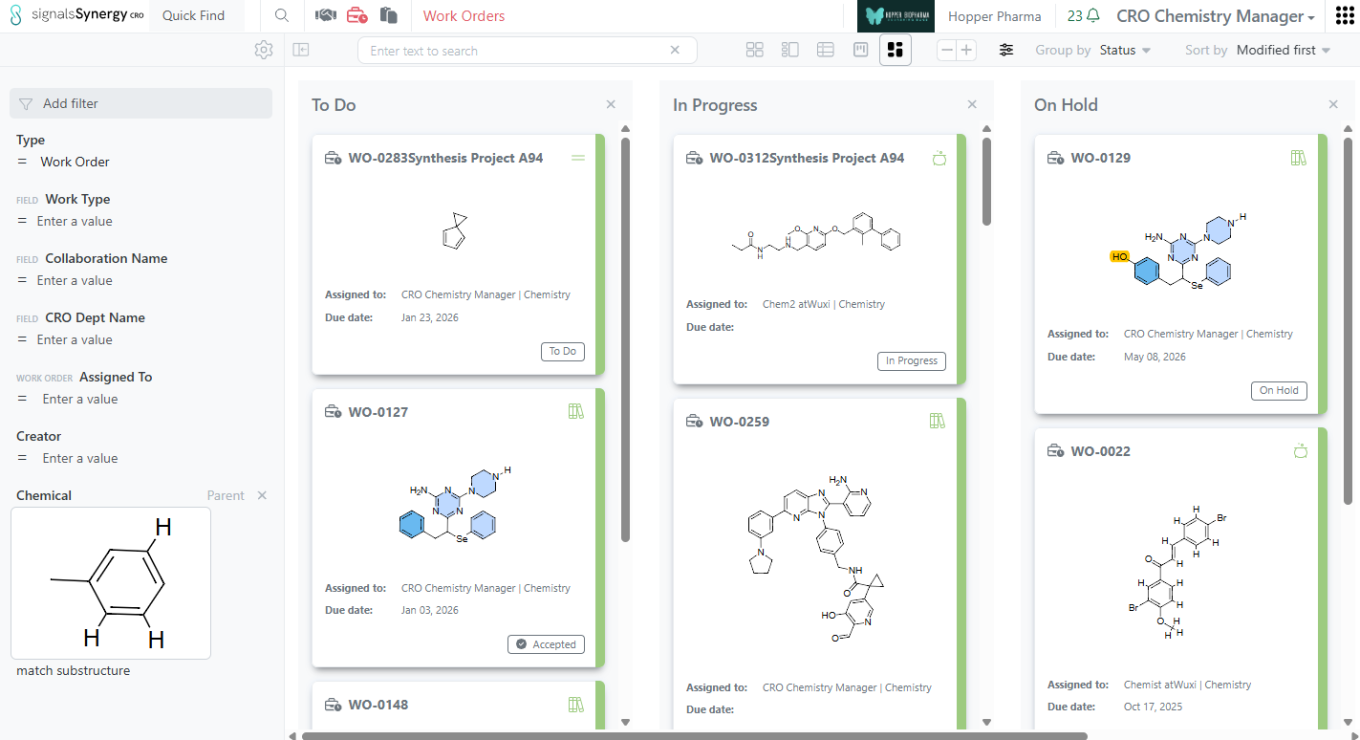
    – Chemical Search for shared Chemical/Design Structures in Reference Tables for Sponsor and CRO
    – Reference Table property search for Sponsor and CRO
  • Chemistry
    – Support for pairing of multiple RNA/DNA strands to a single sequence
    – Structure searching for monomers in HELM Monomer Curation application
  • Tables
    – End user adjustment of Scatter Plots (beta) *
    – Export of image from Scatter Plots (beta) *
    – Highlight selected rows or points in the Scatter Plot and Table (beta) *
    – Conditional calculations can be contained within conditional calculations
    – Increase component limit from 30 to 50 in the Variation Table
  • Samples
    – Empty Sample tables in Templates
  • Inventory
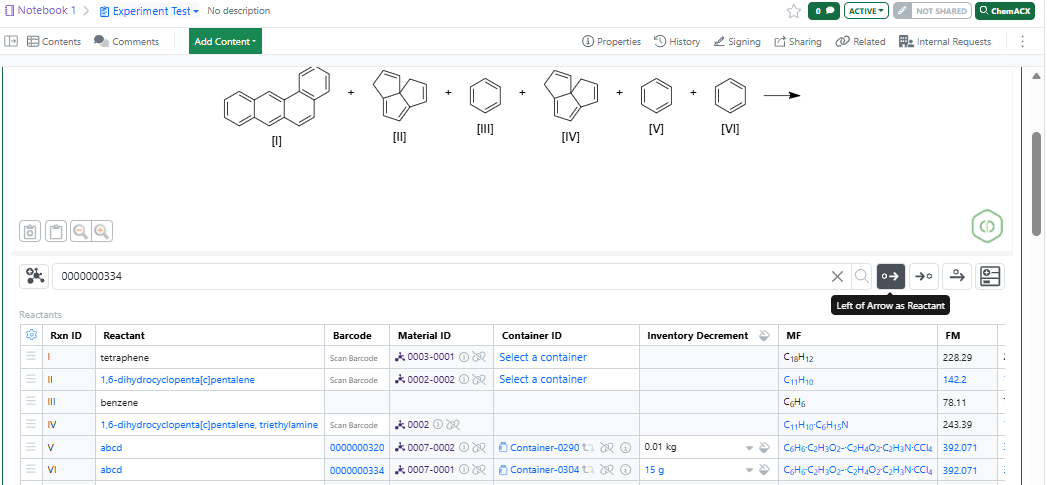
    – Allow Multiple Additions of the Same Container in Materials Table and Stoichiometry Table
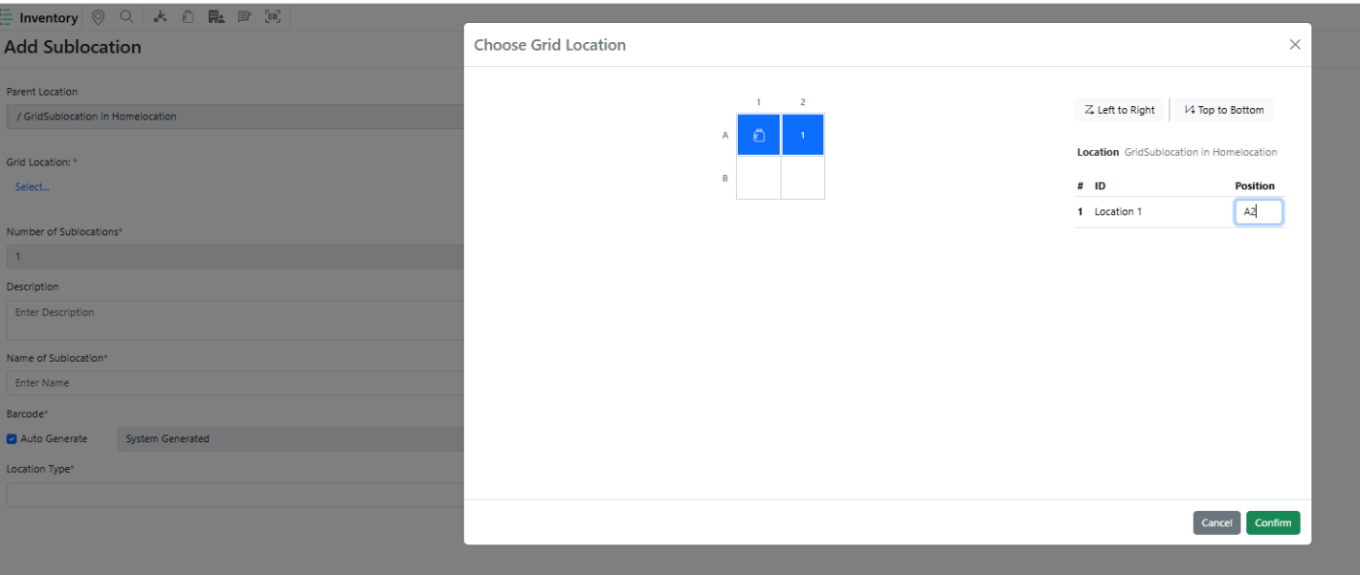
    – Add multiple (same) sublocations to a parent location easily
    – New Labels
  • InventoryGo ‡
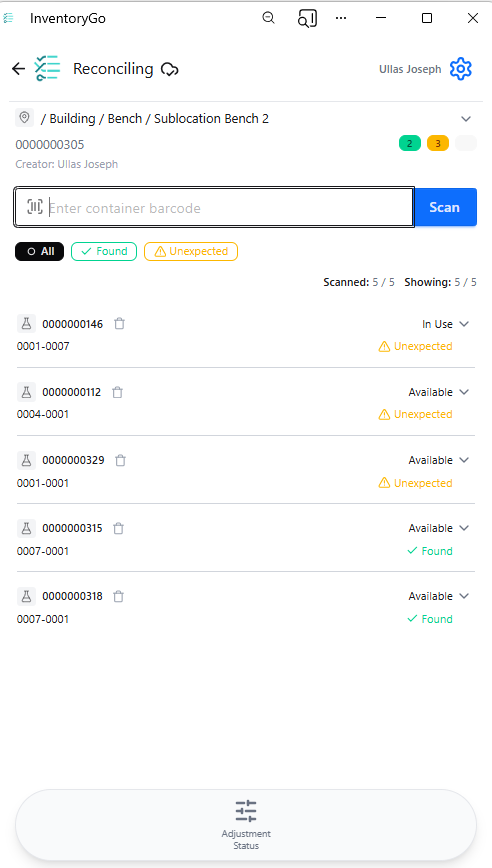
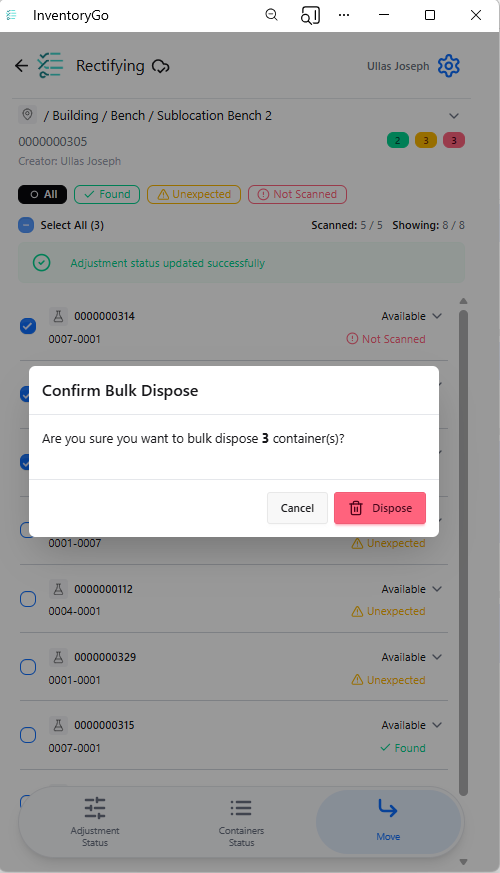
    – Reconciliation and Rectification
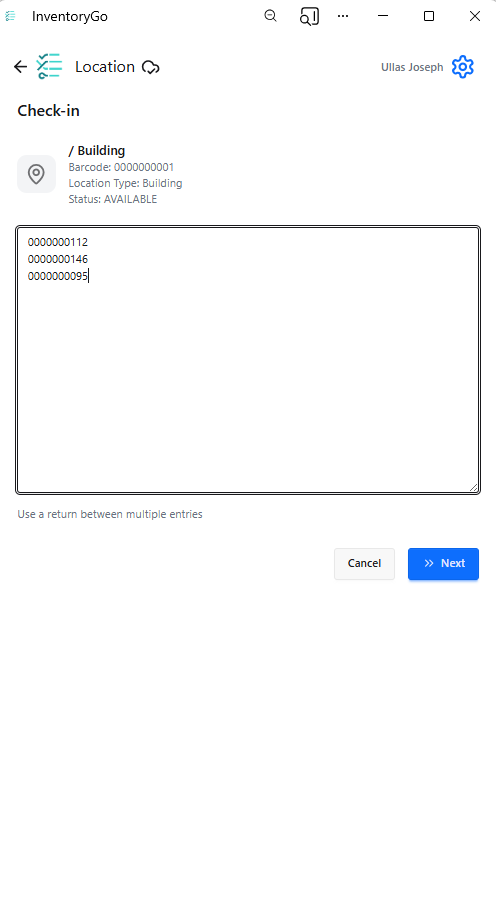
    – Move
    – Consume
  • Materials
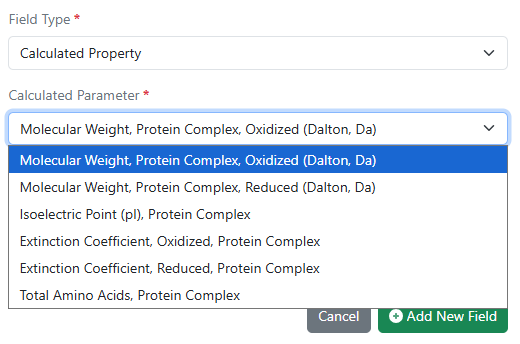
    – Calculated properties for protein complexes available to all systems
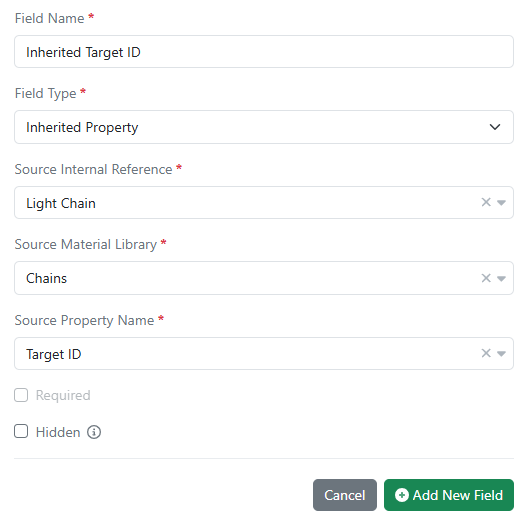
    – Inherited Properties for materials available to all systems
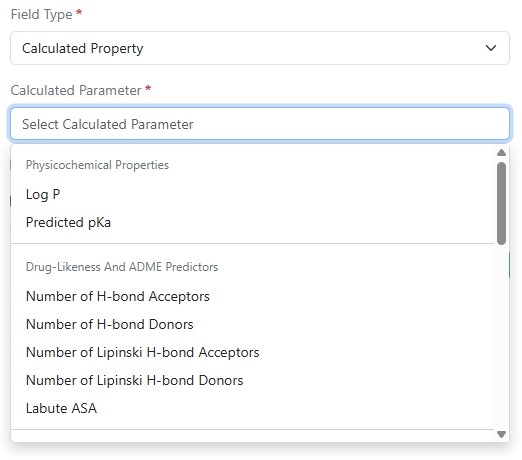
    – Log P, predicted pKa, and additional compound calculated properties
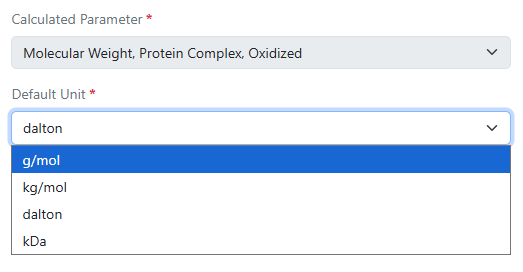
    – Configurable display units for calculated molecular weights
  • Search
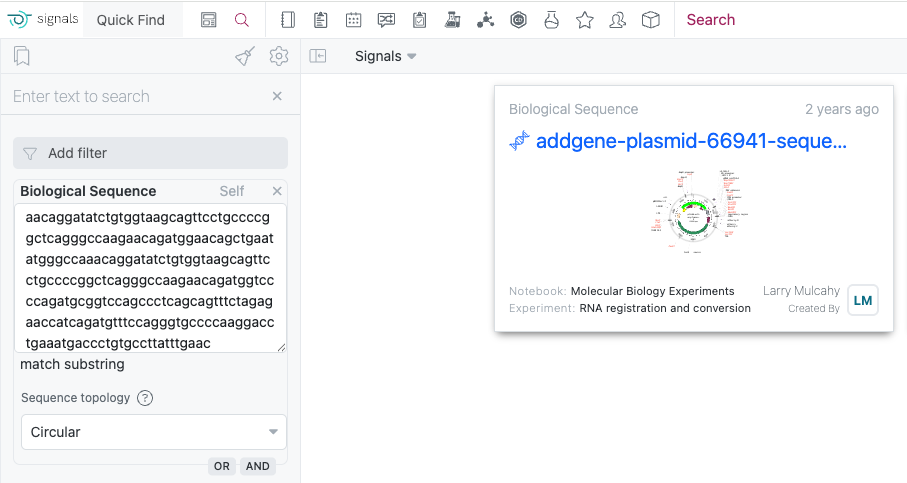
    – New options for circular and linear Biological sequence searches
  • Administration
    – The 'created at' field in the system audit trail CSV export can be converted to local time in ISO 8601 format
    – Spotfire for Signals Custom Apps Configuration available for Private Cloud exports Spotfire for Signals Online Debug Logs *
  • Integrations & APIs
    – Selected rows in an Hierarchical Table can be identified in an External Action *
    – External Action for Edit Reviewers
    – API to create a Reference Table in a Work Order
    – API to add a reference(s) to a Reference Table
    – API for date based data extraction for SDF
    – Additional Chemical Structure formats for updating Materials
    – PKCE Support for Bearer Token Exchange

* Requires Signals One license
† Requires Signals Synergy license
‡ Requires InventoryGo license
 

We also fixed several small bugs in this release. Details of the enhancements are described below.

Administrators should be aware that we have retired most of the In Vivo Apps from the Signals One App Store in Spotfire. Specifically the following Apps are no longer available: Study Designer, Dose Preparation, Baseline Capture, Sequence Of Events, Sequence File Generator, Mass Spec, Dose Verification, Business Rules, and Data Model Designer. The PK Parameters App continues to be supported and will remain in the Signals App in Spotfire in Signals One.

Administrators should be aware that we will have retired the CRAIS Checker capability from Signals Notebook and Signals One. This capability, which was only available via request, was built to allow integration specifically to the Patcore CRAIS Checker database. Such workflows have been superseded by the Chemical "External Checking" capability which can be used against any chemical compliance database.

Data Factory Administrators should note that legacy Data Factory projects will be fully deprecated in a future release. A straightforward migration path will be provided in an upcoming release to support this transition.

Data Factory administrators should also note that the Advanced Security policies in Inventa apply an "AND" logic across all user groups, restricting access if any groups lack permissions. This behavior differs from the standard Signals security model and will be fixed to align with the standard in a future release.

Administrators are recommended to subscribe to the channels within our support news site found at https://support.revvitysignals.com/hc/en-us/categories/360004446171-Support-News which contains more information about releases and other pertinent product information.

This content is anticipated for release on our Production E3 environments, and for Private Cloud customers on our deferred release schedule, in July 2026.

Further Details 

The following improvements are available for users, administrators and developers on the Signals platform. Certain features may only be available with appropriate licensing and/or with enablement by an administrator.

Fundamentals
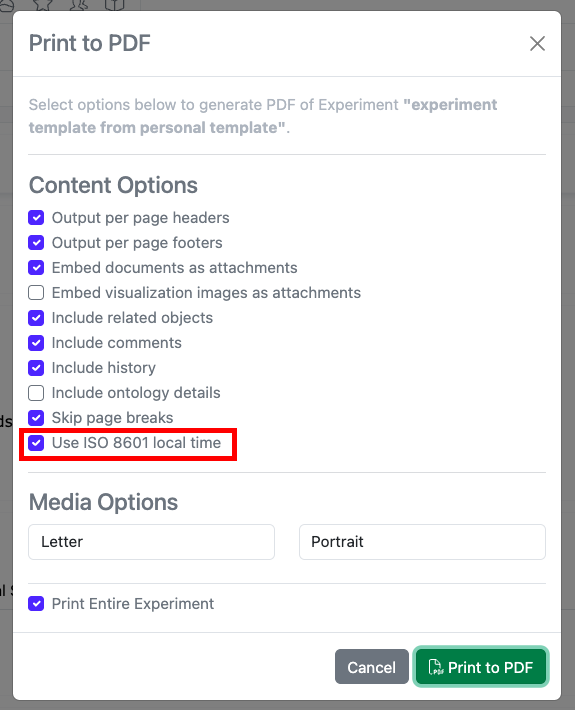
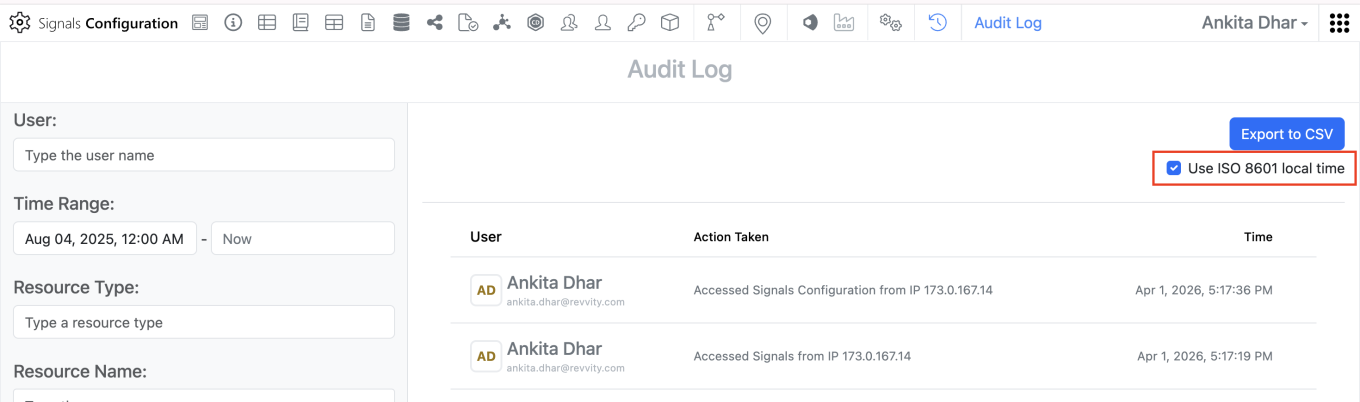
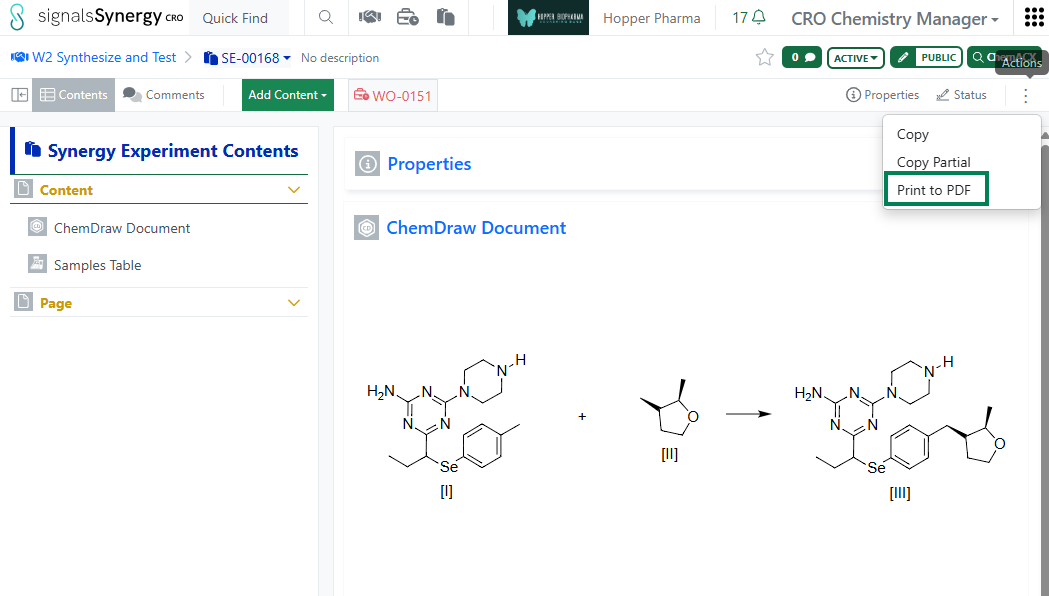
The PDF export of experiments can be converted to local time in ISO 8601 format. When end users select the ‘Print to PDF’ option in an experiment, a new setting can be selected to “Use ISO 8601 local time” which will convert timestamps throughout the PDF to local military time with a UTC offset. 

Data Workflows & Analytics

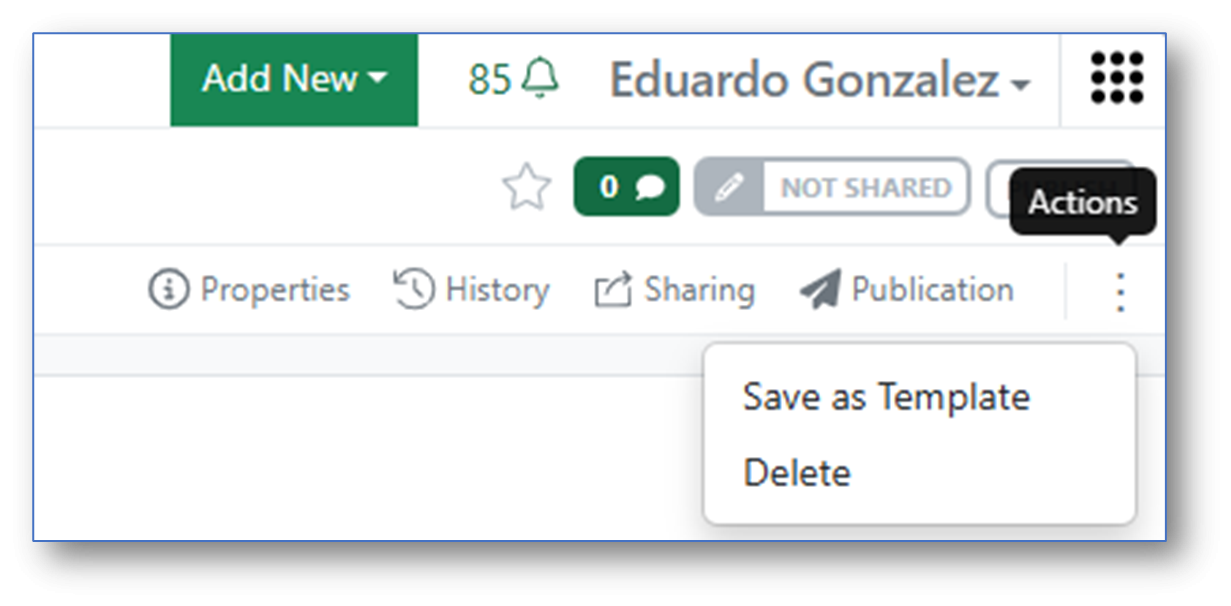
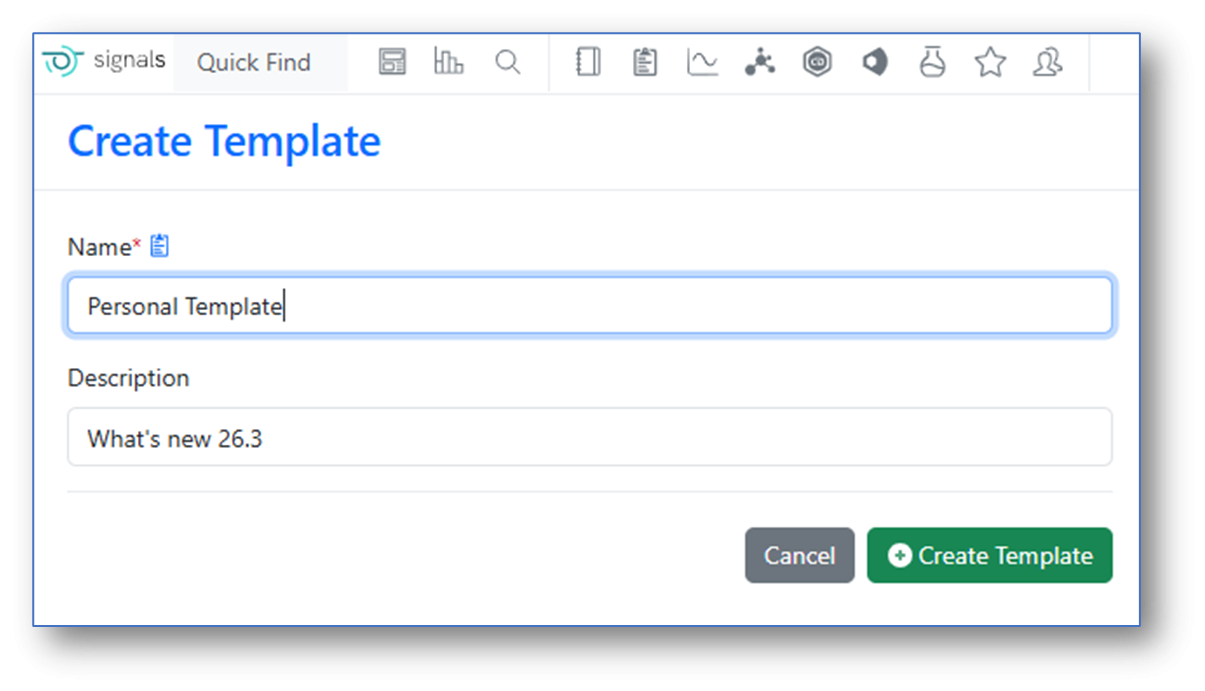
In Signals One, In Vitro Analysis users can now save an instance of an In Vitro Analysis object as a personal Template:

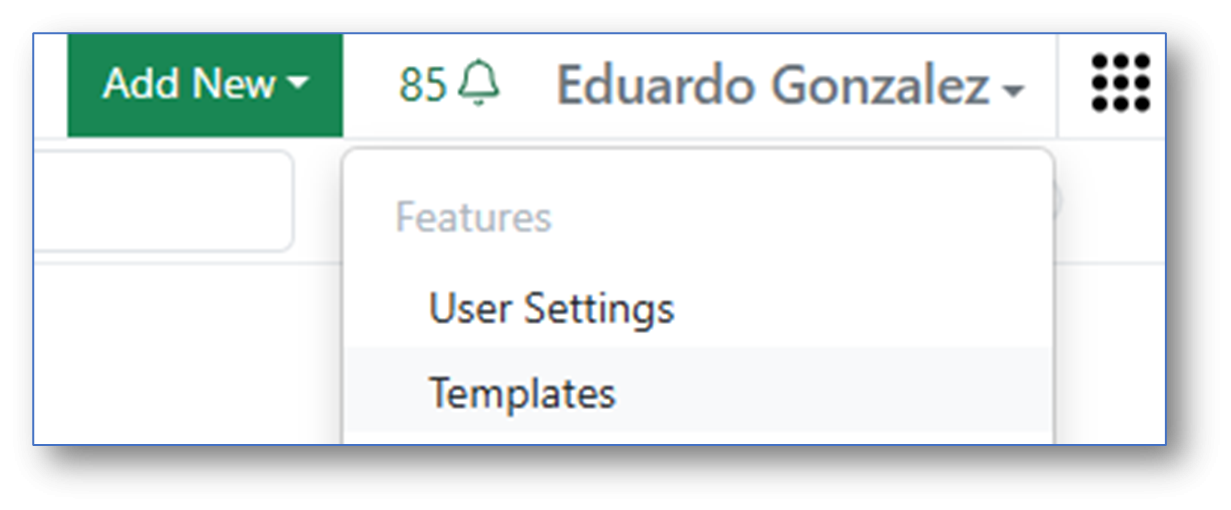
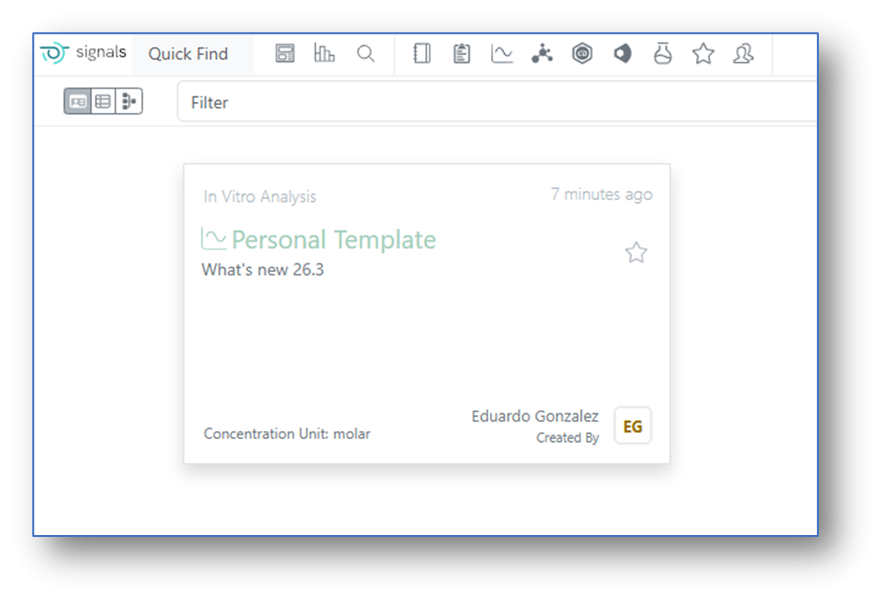
Saved In Vitro Analysis personal Templates become then available for the user for subsequent new analysis.

Synergy

Given the new privilege to Move Designs, a Sponsor user can now move a Designs Table to a different Idea or move selected Design(s) to a different Designs Table. The user must have Full Control to an Idea in order to move Designs. 

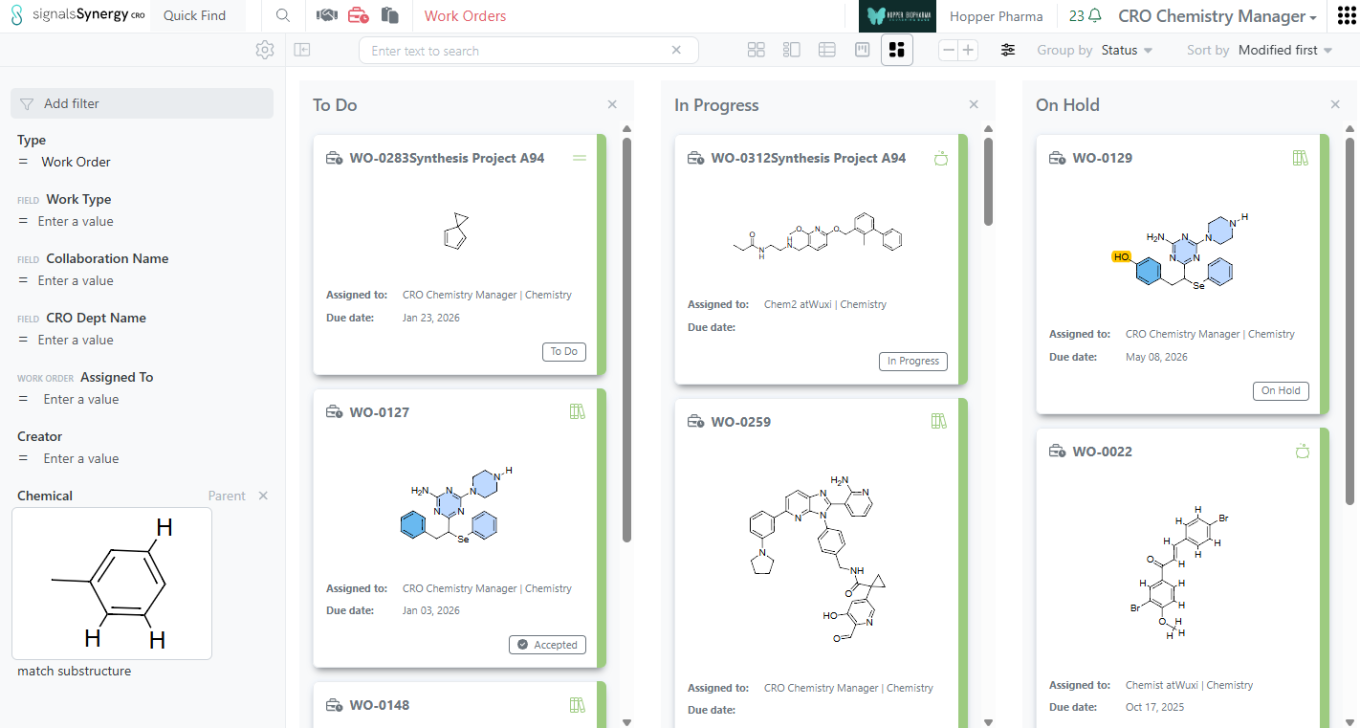
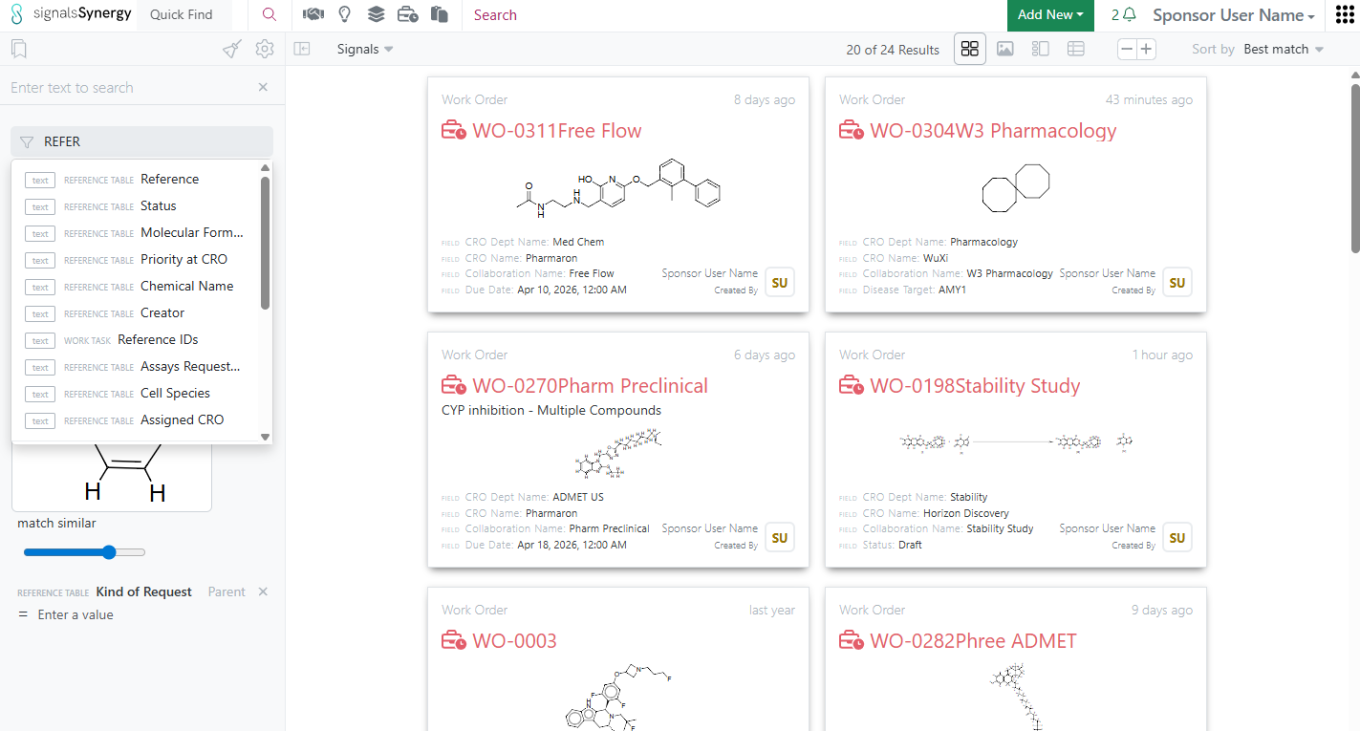
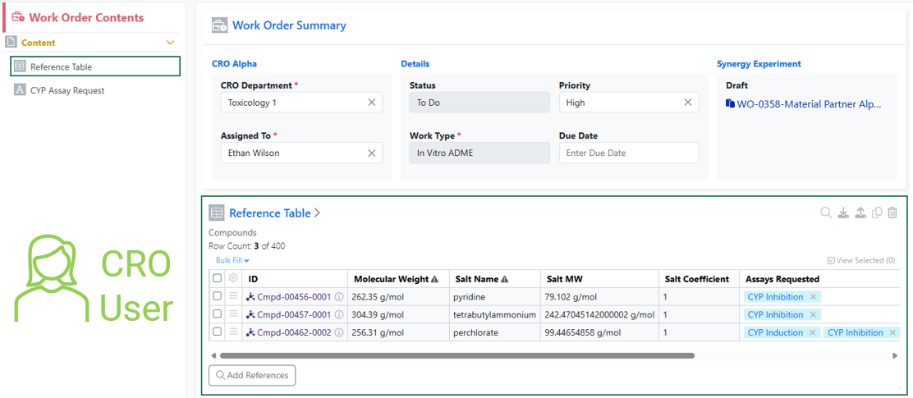
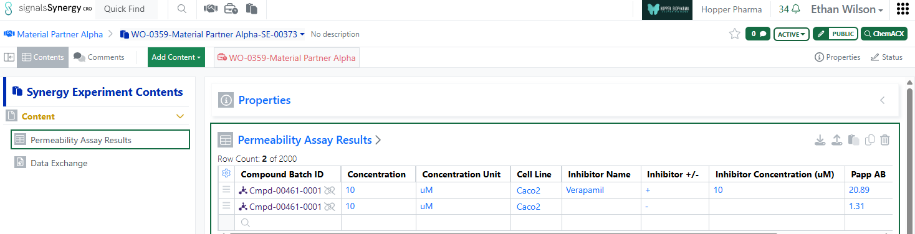
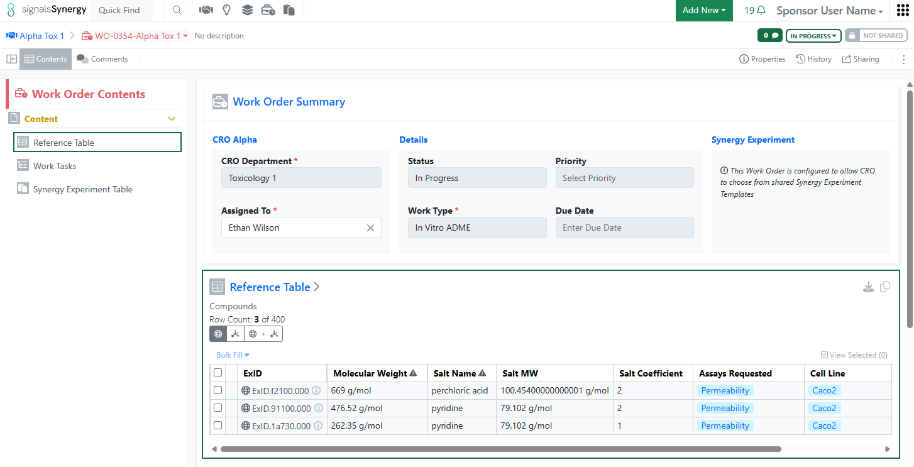
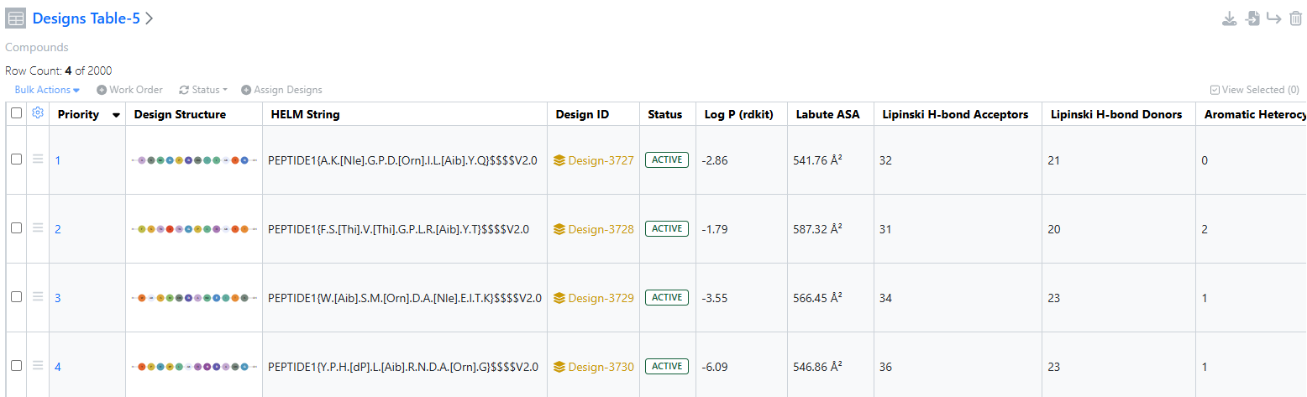
As a Sponsor or CRO user, I can now search for my Work Orders based on the content of the Reference Table (e.g., list of Designs to be made or batches to be tested). Reference Tables allows the Sponsor to selectively share a sub-set of Design or Material Asset or Batch properties when requesting Design synthesis or assays to be run. If a Design Structure or Chemical Structure is included in the properties shared to the CRO, the Sponsor and CRO can use Chemical search to find the Work Orders containing a specific structure or sub-structure within Advanced Search or the Work Order Smart Folder. Note that the Chemical filter should be set to Parent to ensure that the Work Order containing the Reference Table is found. 

In addition, non-structure properties shared in the Reference Table can also be used when searching for Work Orders within Advanced Search or the Work Order Smart Folder.

Chemistry

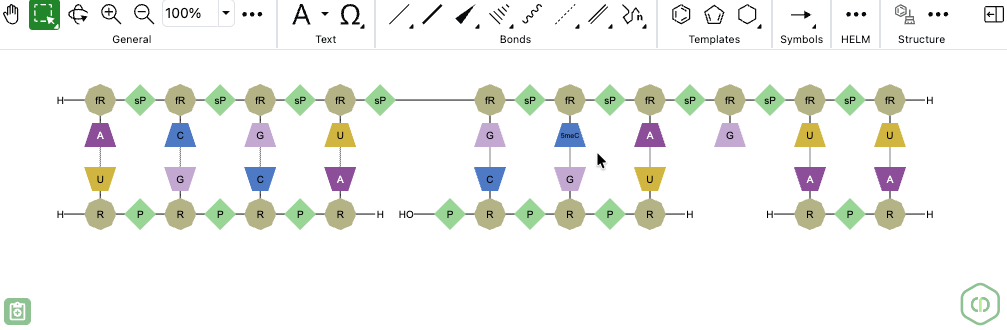
ChemDraw now allows users to draw biopolymers with multiple complementary RNA strands for a single sense strand. When a set of hydrogen-bonded RNA sequences is created, ChemDraw detects the sense strand, identifies each first-degree complementary strand, and automatically places each complement beneath the sense strand according to hydrogen bond positions. The sense backbone is stretched as needed to minimize overlap, enabling side-by-side display of complements with proper alignment.

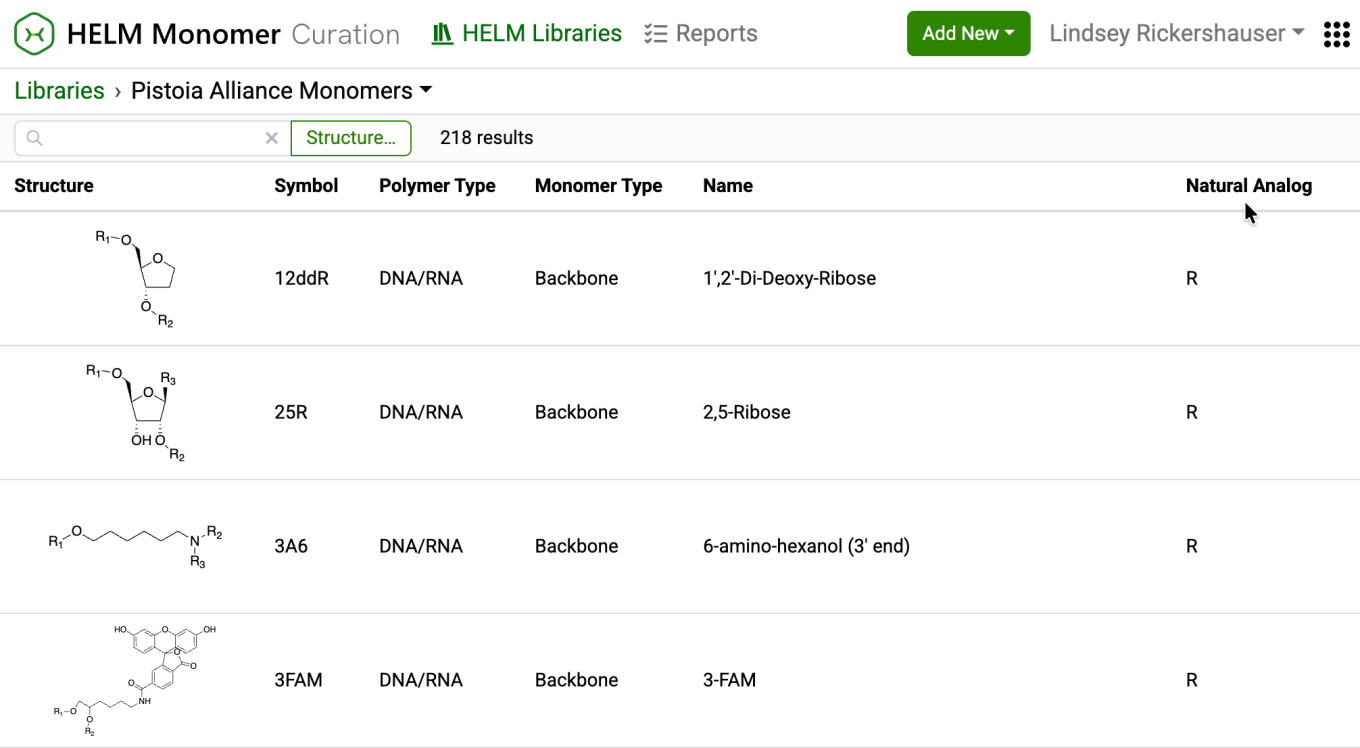
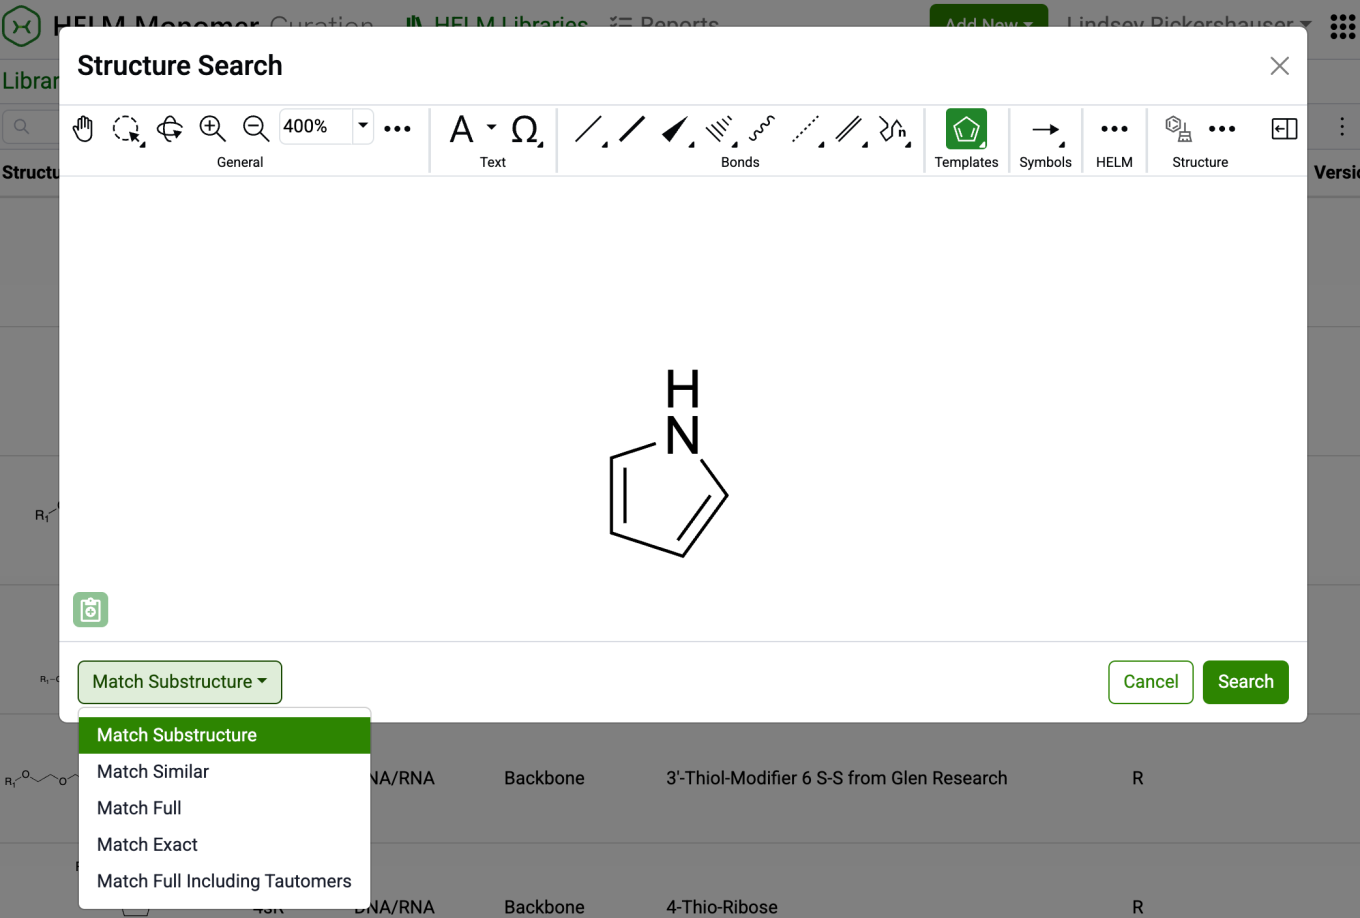
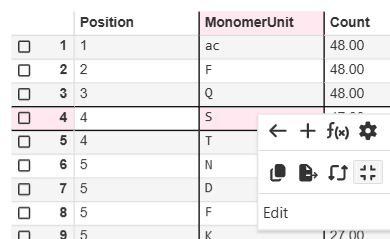
New capabilities have been added to the HELM Monomer Curation application for filtering and searching monomers based on chemical structures. Available as a button next to the text search field in the HELM Libraries list view, the ‘Structure…’ button opens a structure editor. 

After drawing a structure, users can select from substructure, similarity, full, and exact search options. Selecting ‘Search’ will then initiate the search filter. 

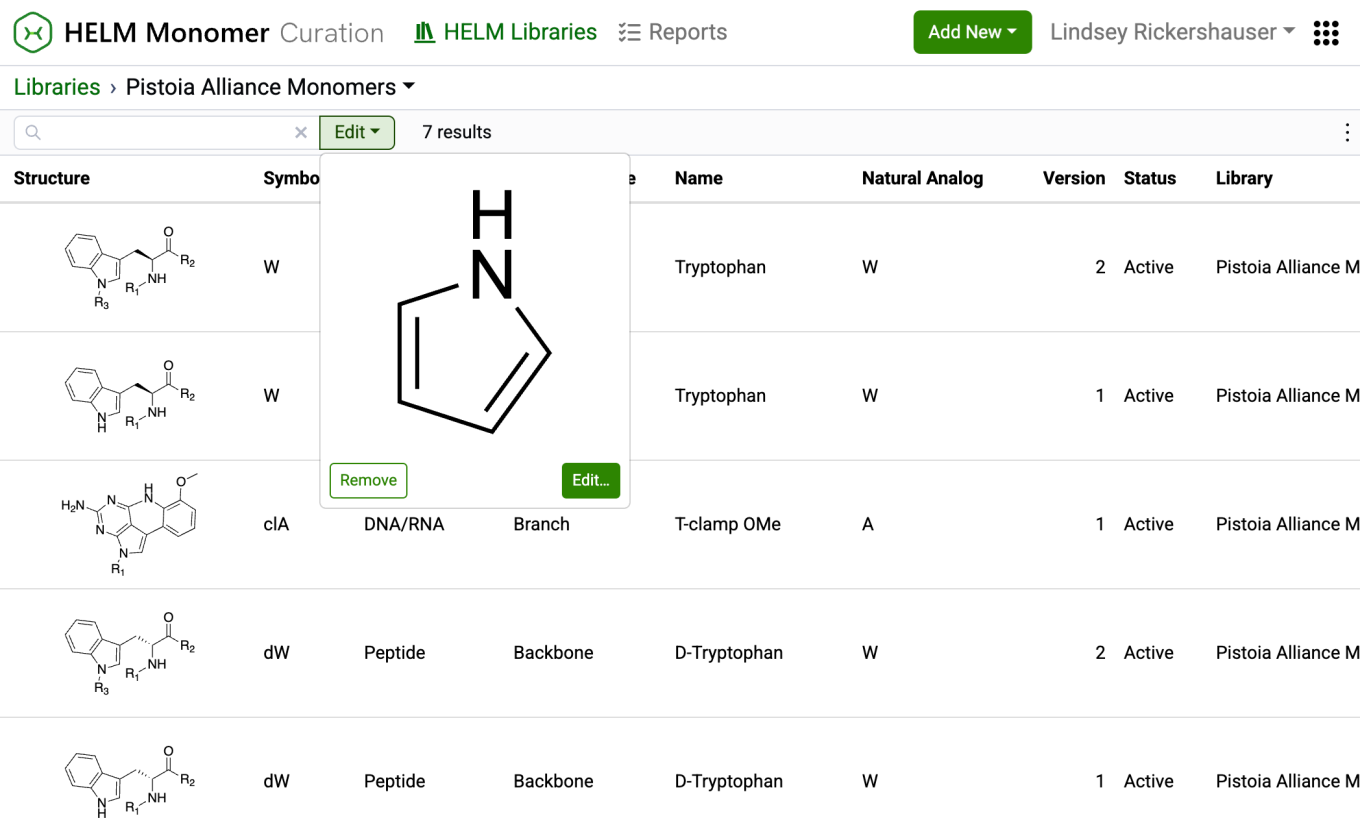
After completing a structure search, the ‘Structure…’ button transforms into an ‘Edit’ button. Selecting this button allows for previewing the structure, making changes to it, or removing it from the search filter. Structure searches can be combined with text-based searches to refine results even further.

Tables

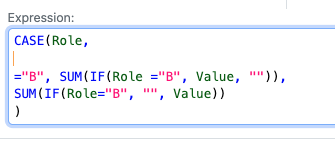
Conditional calculations are now allowed to be used within other conditional calculations, such as within a CASE statement. For example a CASE statement can use another conditional statement such as an IF for each clause. A use case is to enact specific aggregate calculations over restricted values, such as if the sum of a given component in a formulation, such as water, is needed for an additional calculation.

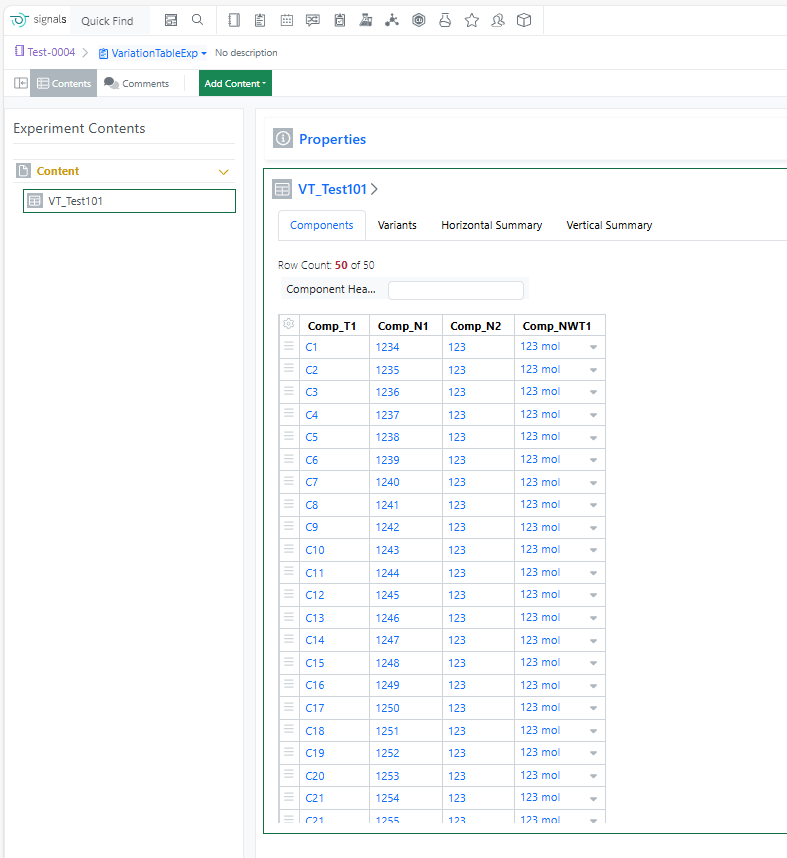
The component limit in the Variation Table has been increased from 30 to 50, enabling more complex experimental designs and reducing the need to split large variations across multiple tables.

Samples

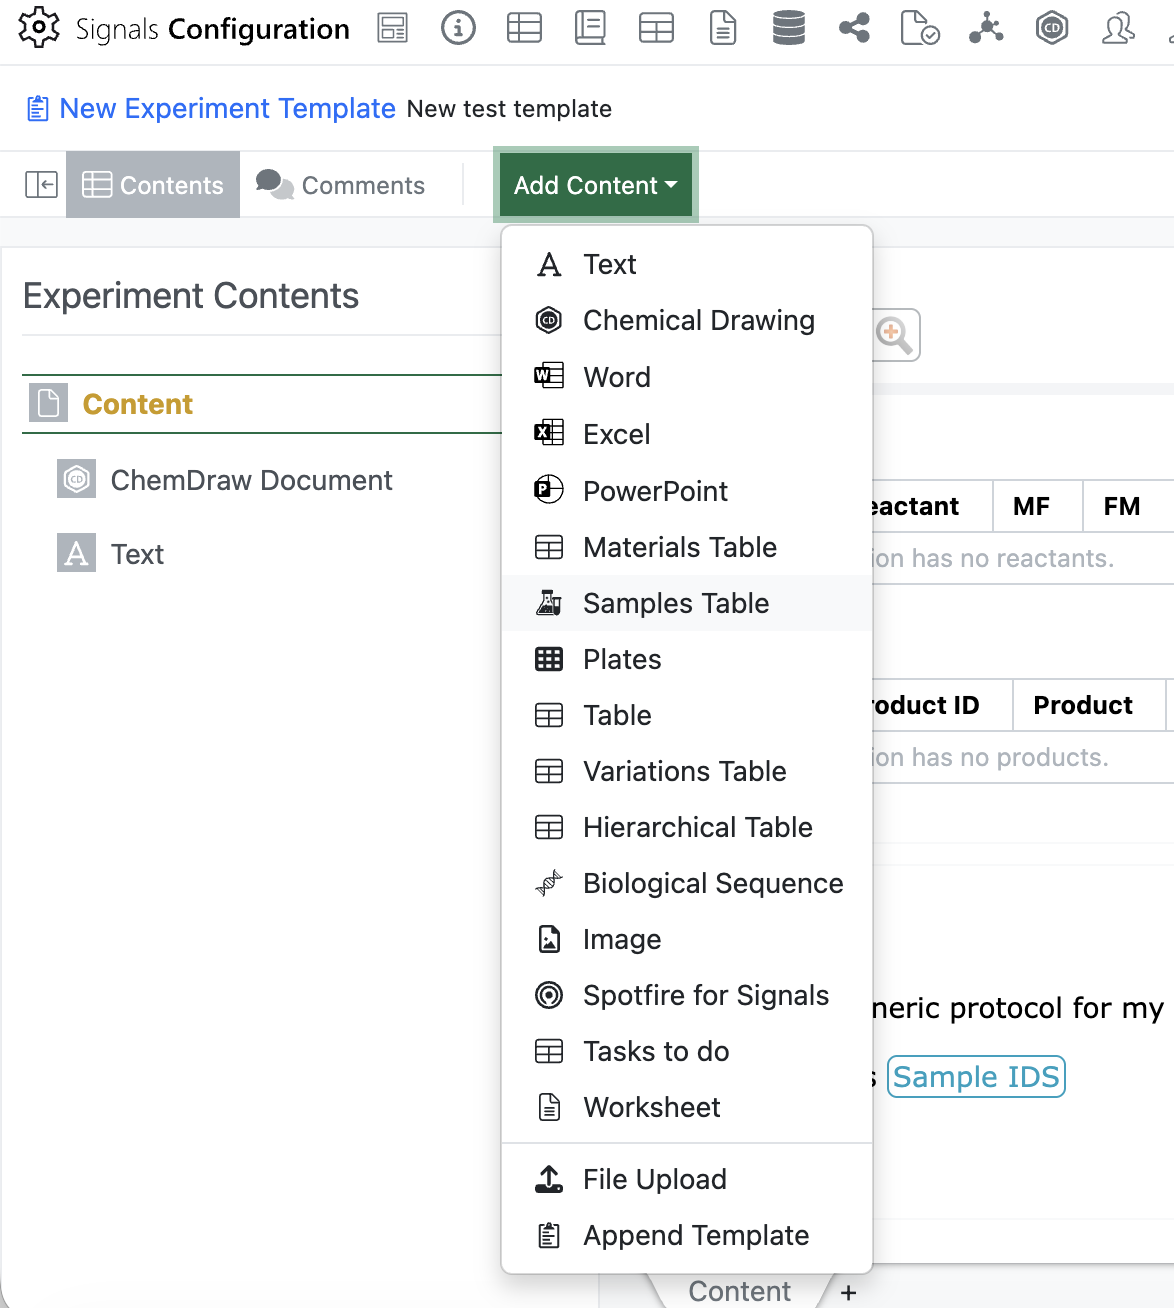
Admins will now be able to add an empty Sample Table to an Experiment or Experiment-like object template using the “Add Content” menu. Only one sample table is allowed in each template, once the sample table has been inserted it will be removed from the “Add Content” menu.

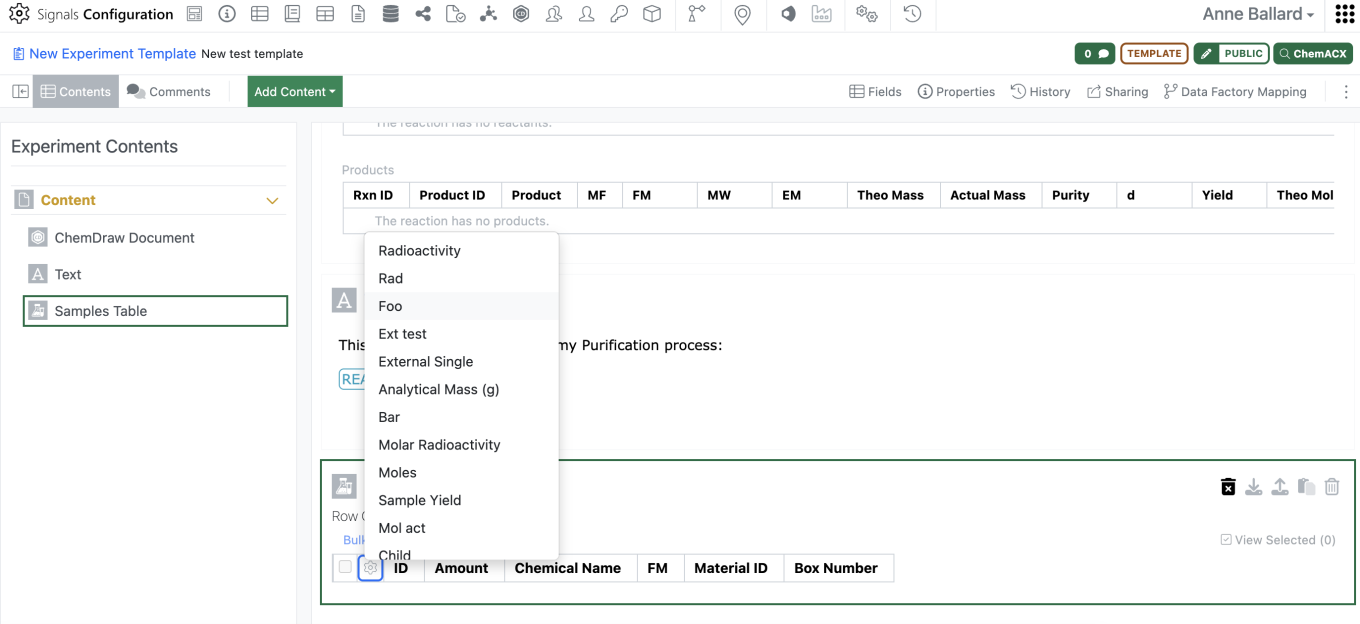
Admins should be able to then move the empty sample table to wherever in the template they would like to have the Sample table. Admins are also able to preselect the columns for the sample table in the template using the gear icon in the left corner.

For an end user, when creating the experiment, if there is an empty sample table in the template the empty sample table will appear in the experiment. When the user adds a sample, it will be added to the existing sample table with the selected columns as defined in the template. This will allow admins to vary which sample columns are shown from template to template without utilizing multiple sample templates.

If a user deletes all samples from the sample table, they will now need to delete the empty sample table with an additional click. The empty sample table can be included in the experiment copy function without including the samples.

Inventory

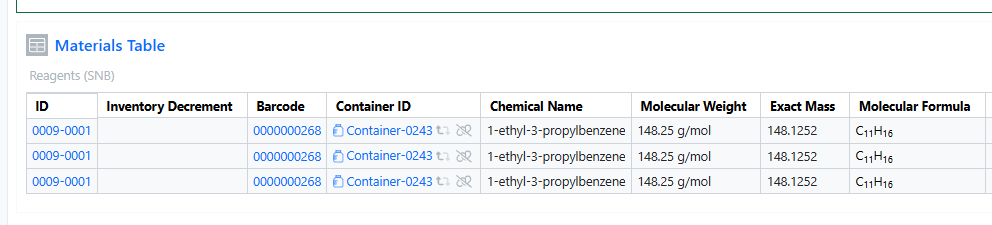
You can now add the same container multiple times in both the Materials and Stoichiometry tables. This enhancement improves procedure documentation clarity, stoichiometric accuracy, and inventory traceability, especially for workflows involving repeated dosing, split additions, or multi‑step reactions.

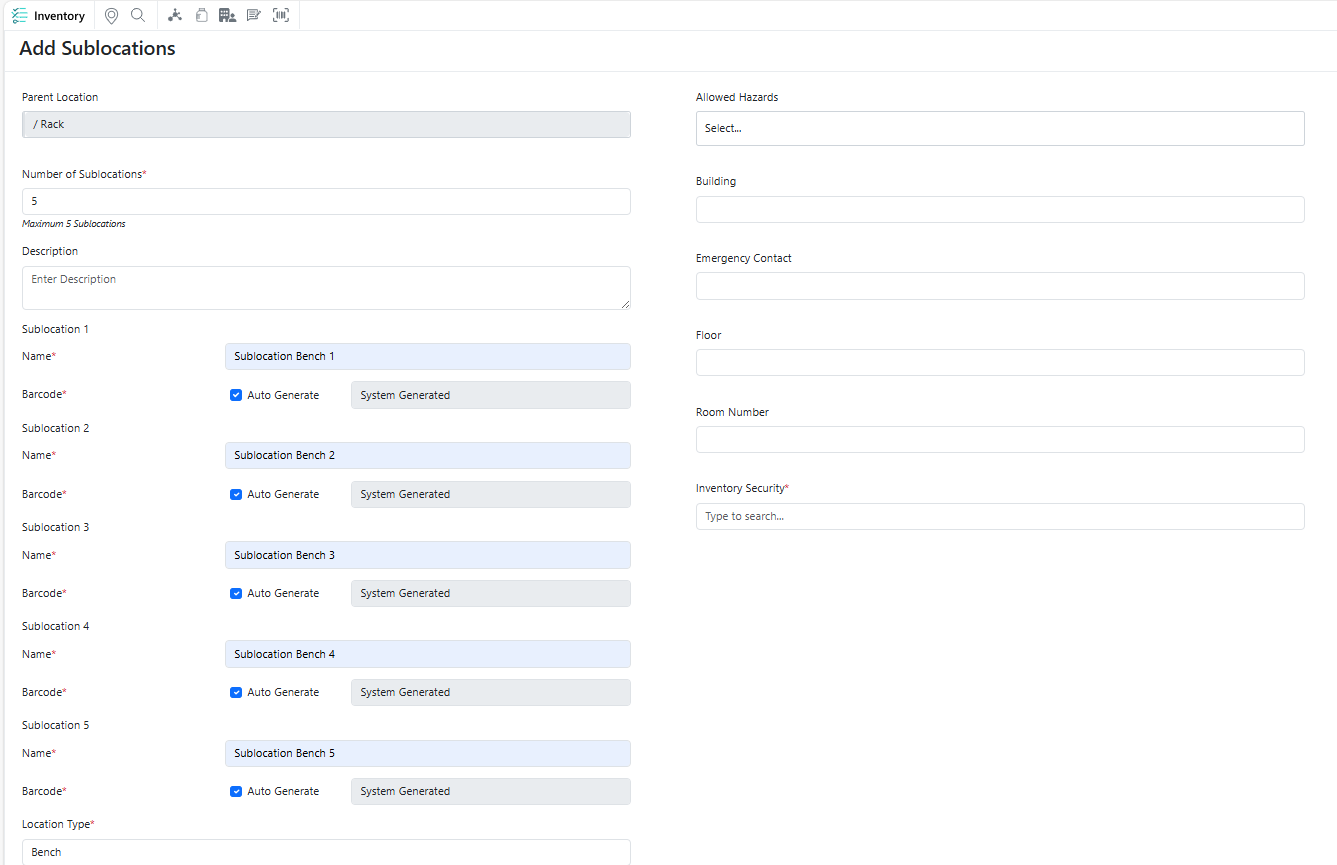
You can now quickly create multiple identical sublocations under a single parent location, making it easier to build and manage hierarchical location structures at scale while reducing repetitive setup effort.

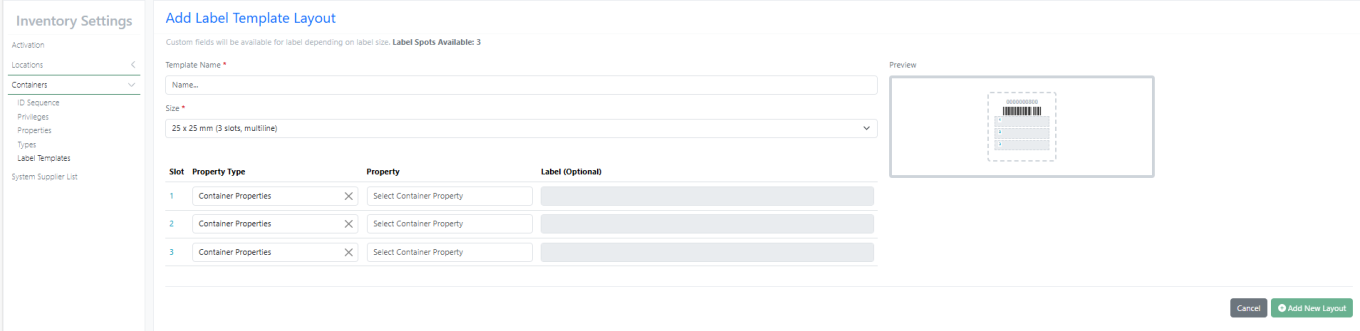
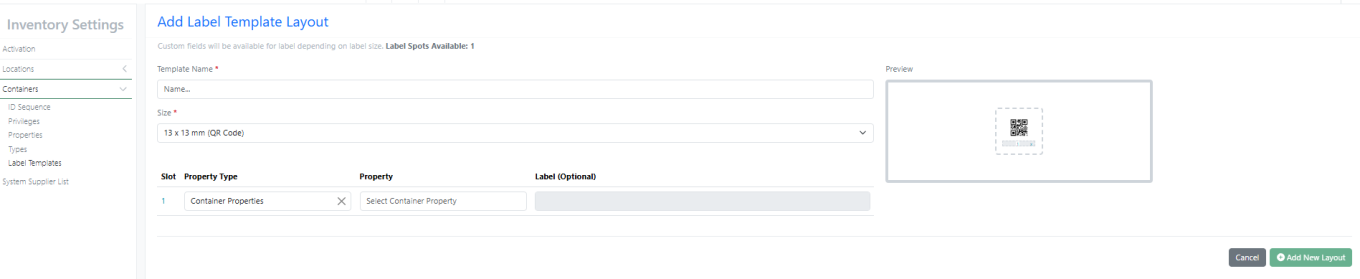
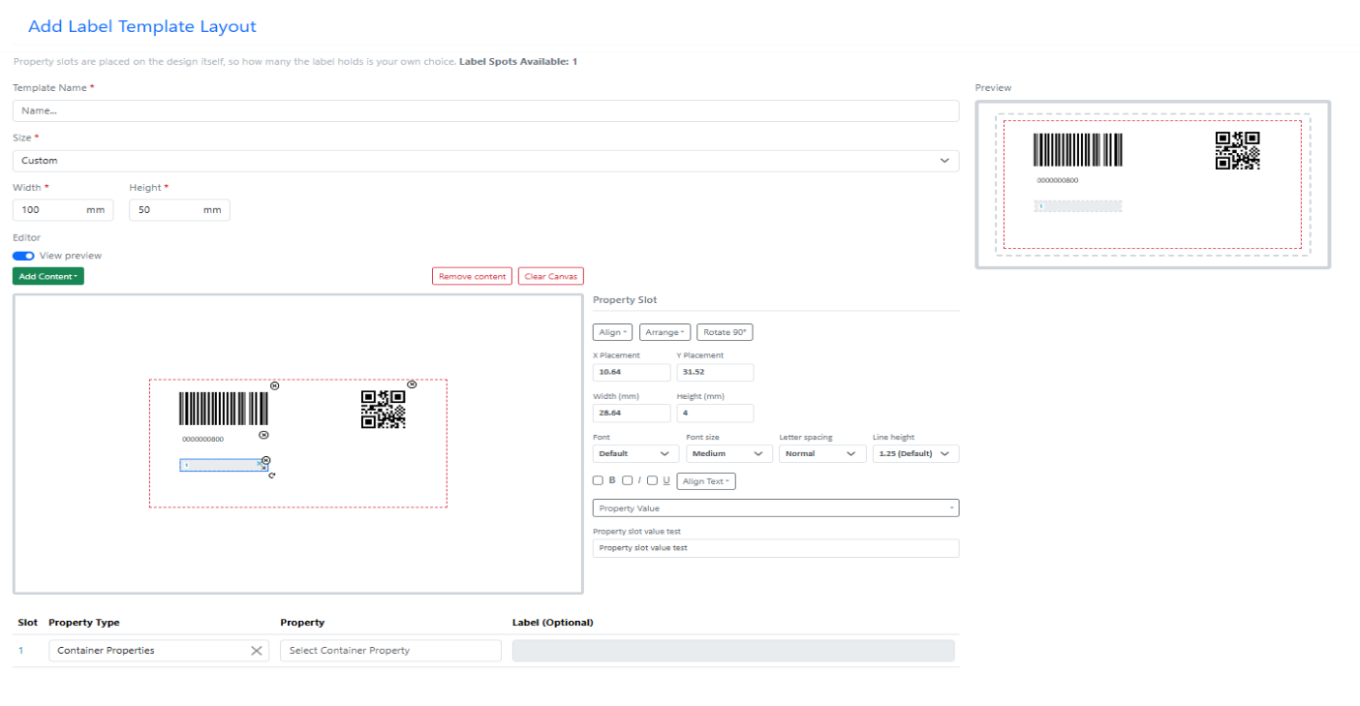
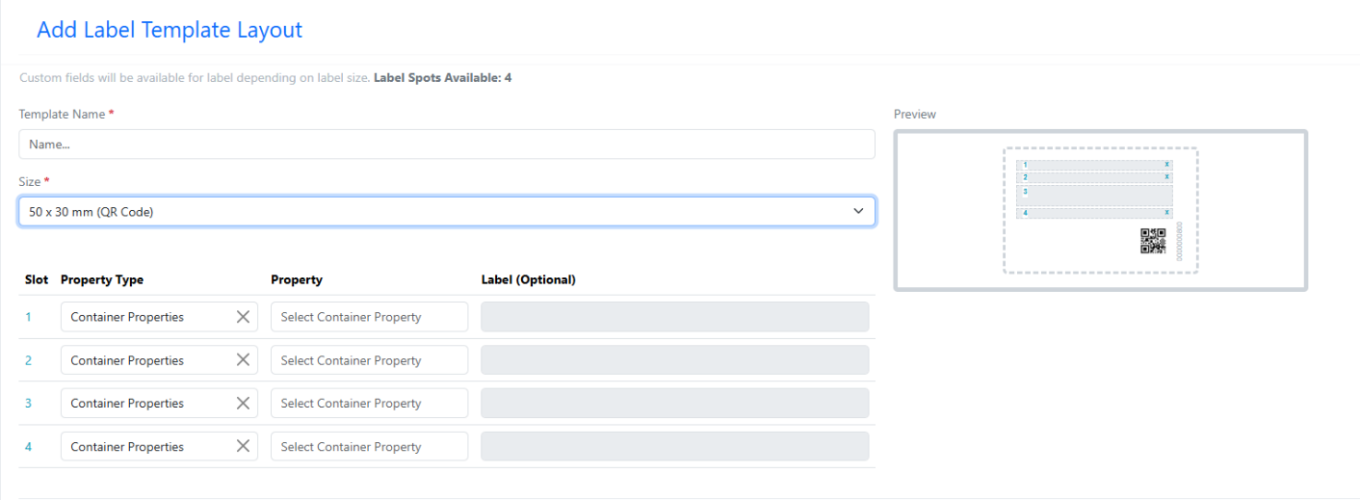
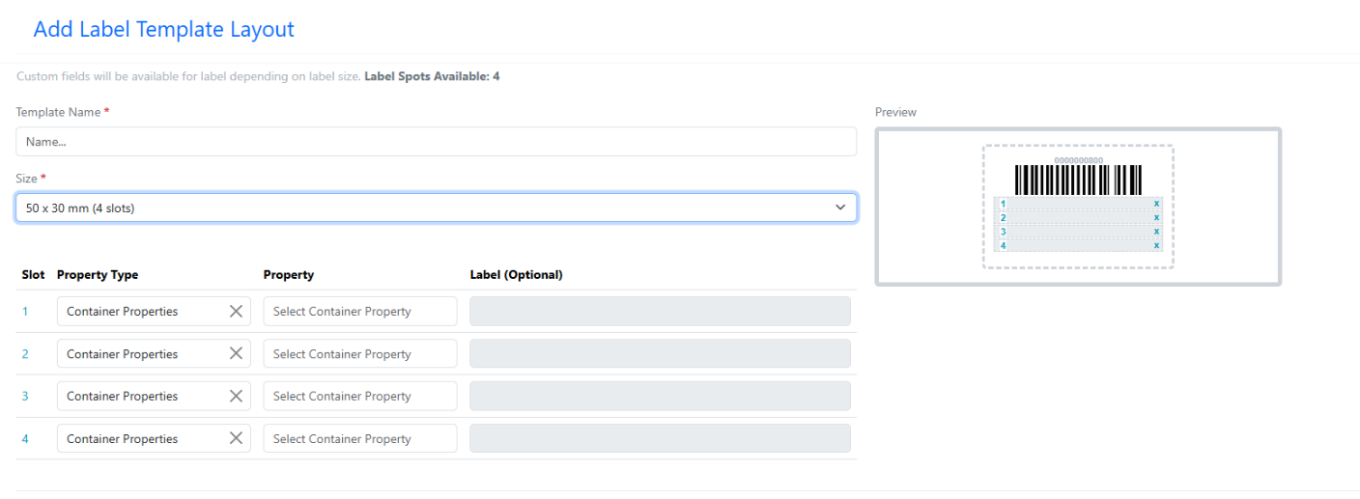
New Label – 25 X 25 mm (3 slots, multiline) supports multiline with font size 6

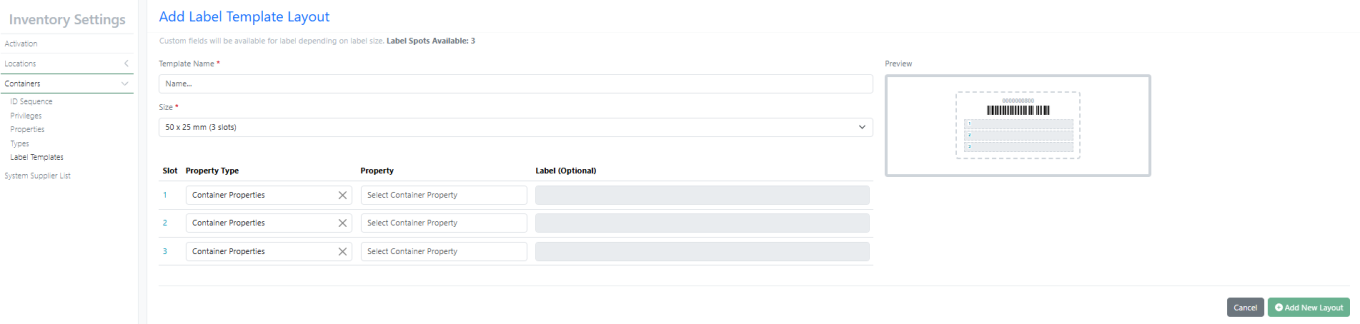
New Label – 50 X 25 mm (3 slots) supports multiline with font size 8

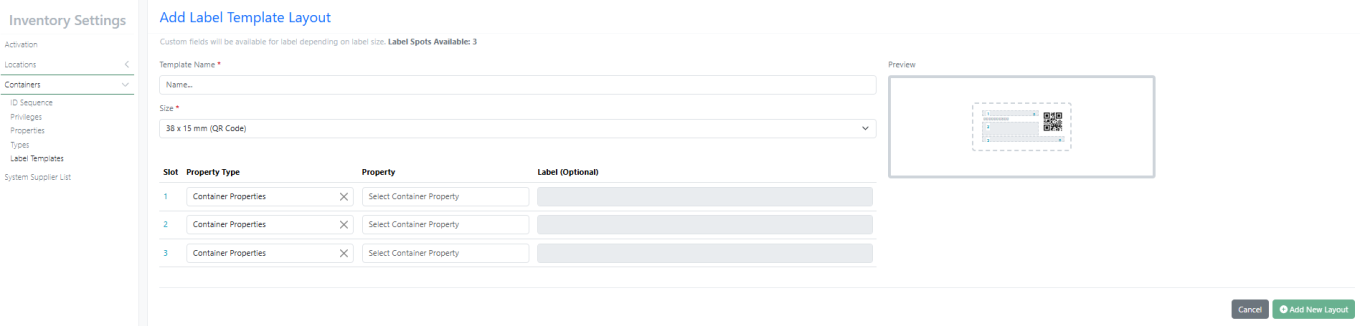
New Label – 38 X 15 mm (QR Code)

New Label – 13 X 13 mm (QR Code)

InventoryGo

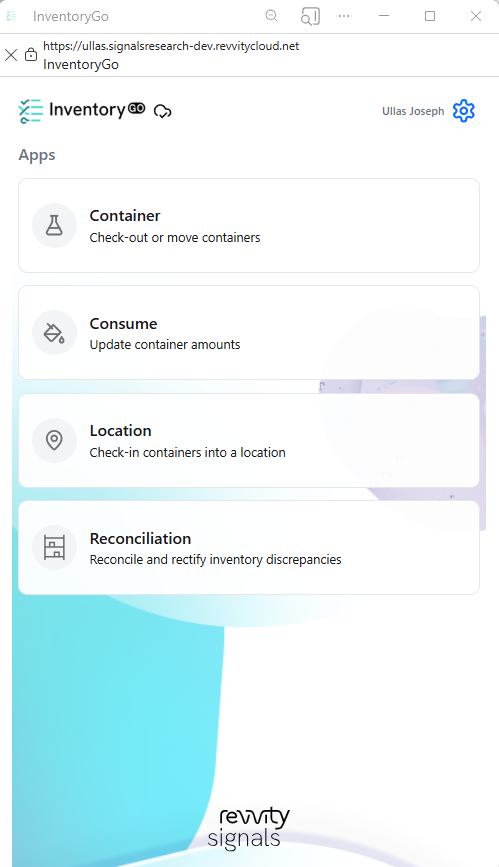
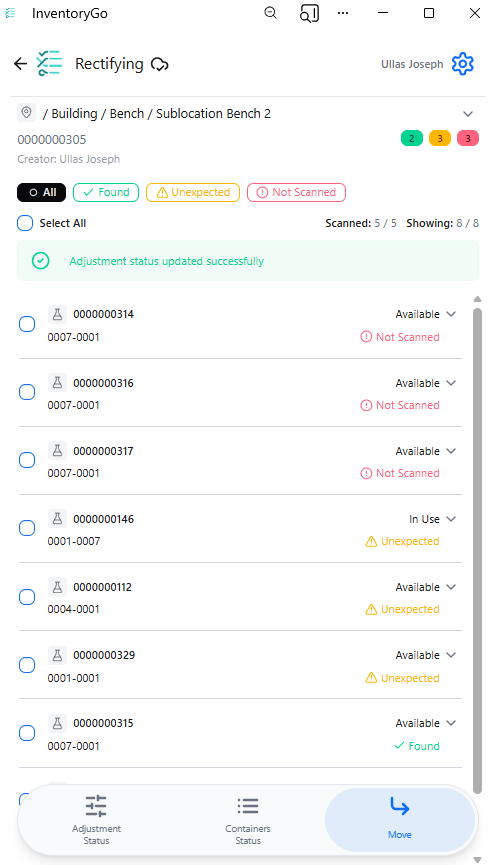
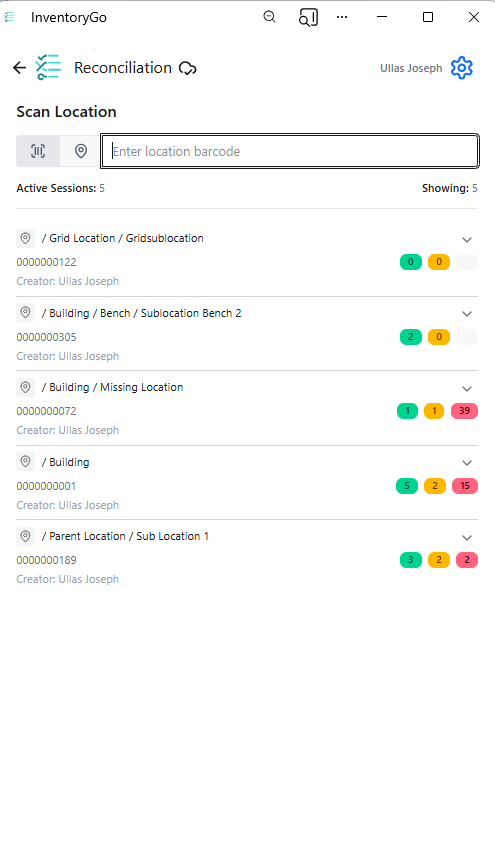
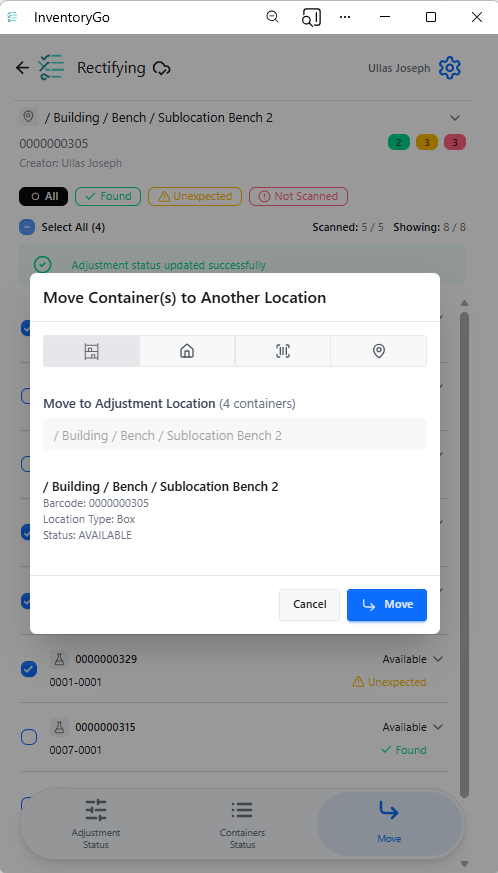
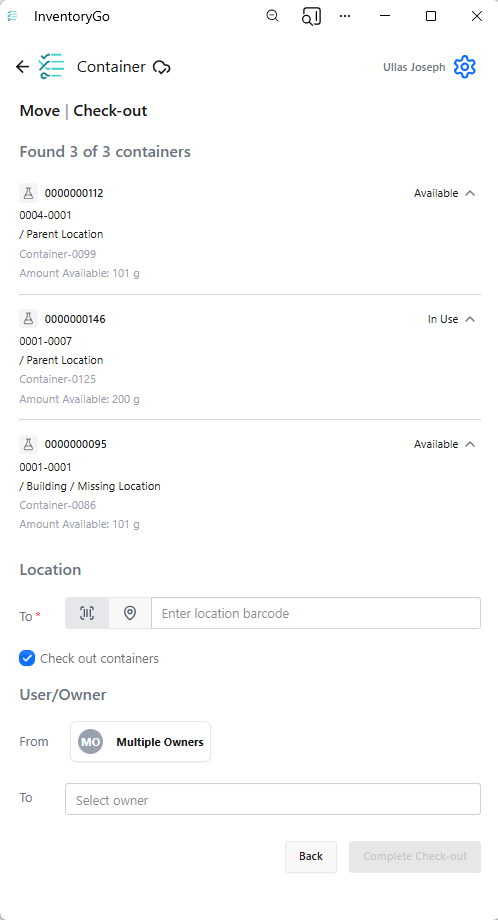
InventoryGo introduces mobile‑first inventory workflows that enable Reconciliation and Rectification, along with Move and Consume actions directly from the lab or storage location. Users can quickly reconcile physical inventory against system records, correct discrepancies, move containers between locations, and update consumed quantities through a streamlined, scan‑based experience—improving inventory accuracy, productivity, and audit readiness. InventoryGo is available as an add‑on capability. Please contact your Sales Associate for more information on enabling InventoryGo for your tenant.

Materials

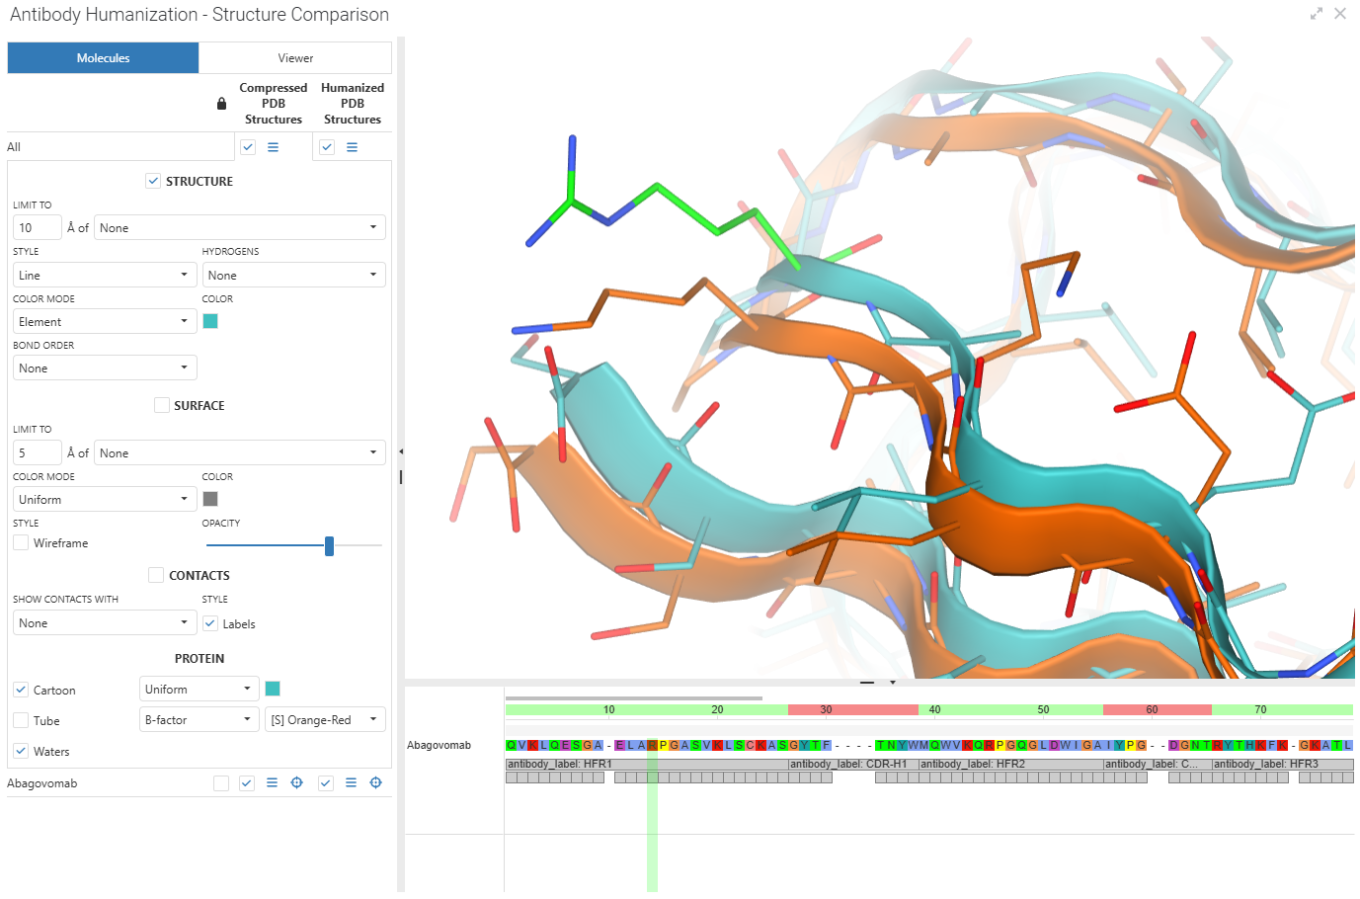
Calculated properties for protein complexes for Custom and Protein material types and the preconfigured Antibodies library are now available to all systems. Molecular weight, isoelectric point, extinction coefficient, and total length can now be computed for complexes comprised of multiple protein parts linked to via internal references.

Inherited properties in all material libraries are now available in all systems. Data field values can now be passed down (i.e. inherited) from one material to another using internal reference links. Updates to the source data are automatically propagated to any inheriting entity and are kept in sync.

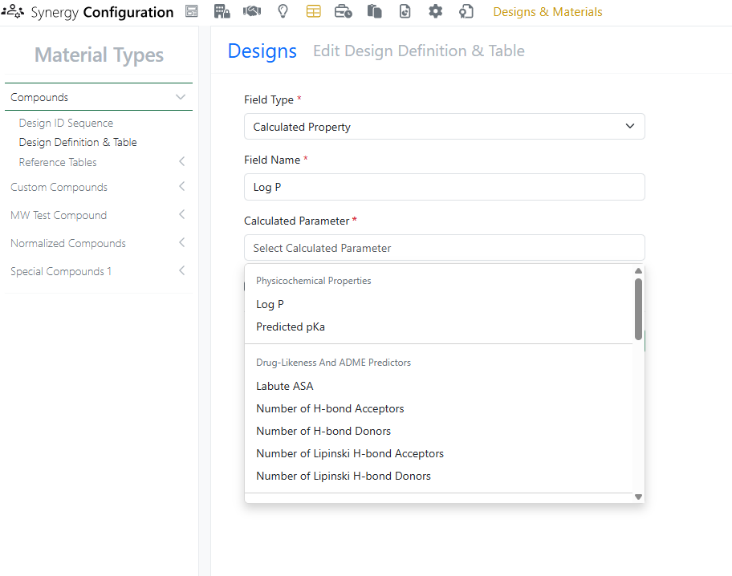
Log P, predicted pKa, and additional calculated properties are now available in Compound and Normalized Compound material types and the preconfigured Reagents (SNB) library. Administrators can selectively choose from a variety of physicochemical properties, drug-likeness and ADME predictors, structure and topology, ring system, atomic composition, and stereochemistry calculations.

Administrators now have the ability to choose different display units for calculated molecular weight properties in DNA, RNA, Protein, and Custom material types and the preconfigured Antibodies, Plasmids, and Primers libraries. Options include g/mol, kg/mol, dalton, and kDa.

Search

The Biological Sequence search now includes enhanced topology options to optimize your search results. The Linear option is for standard DNA and protein sequences, while the Circular option is ideal for plasmid searches where your target sequence may span across the junction between the end and start positions of the circular DNA molecule. 

Administration

Signals One Private Cloud environments with Spotfire for Signals Custom Apps enabled now allow the export of Spotfire for Signals Online Debug Logs.

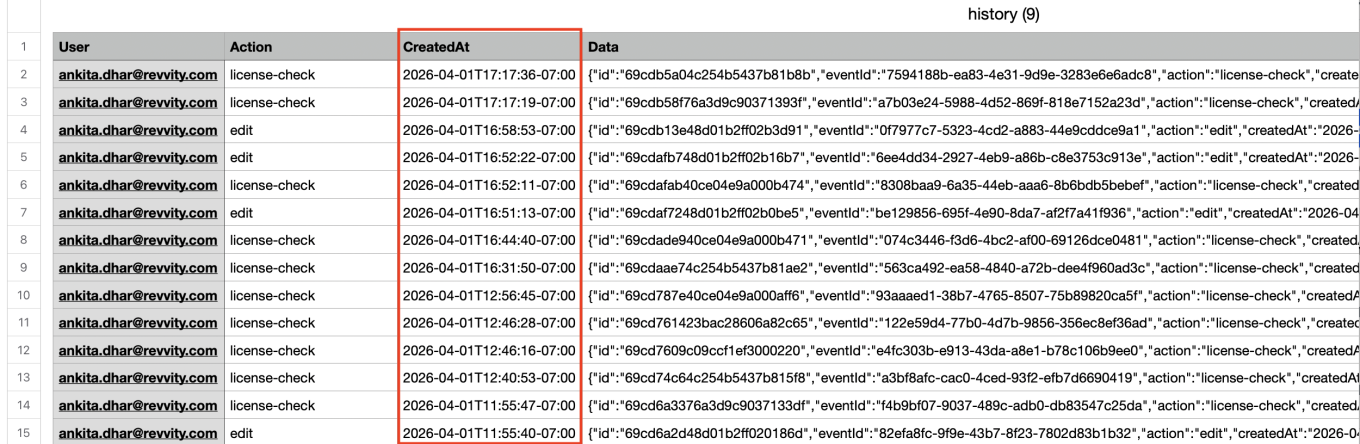
The ‘Createdat’ and ‘modifiedat’ fields in the system audit trail CSV export can be converted to local time in ISO 8601 format. When admins export the system audit trail to CSV, they can adjust the format of timestamps by selecting the “Use ISO 8601 local time” option. This setting will convert the ‘createdAt’ and ‘modifiedat’ timestamps within the CSV to local military time with a UTC offset. 

Integrations & APIs

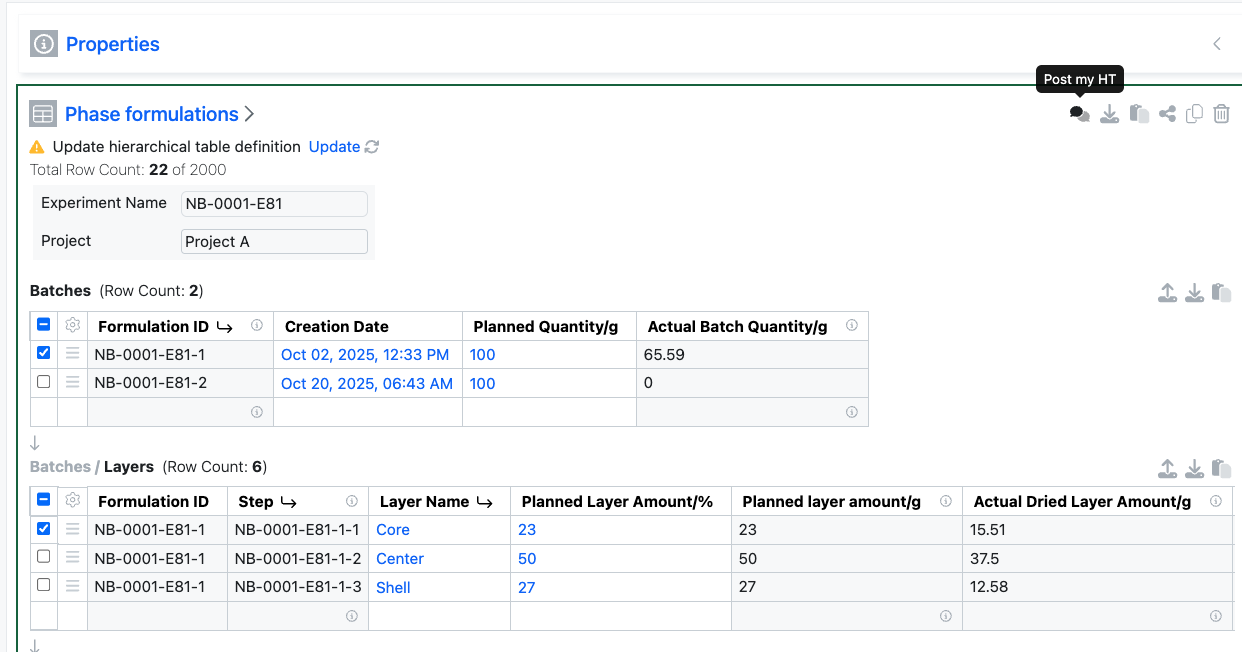
External Actions configured with a POST action on Hierarchical Tables will now include details of the selected rows and table layers within the body of the response.

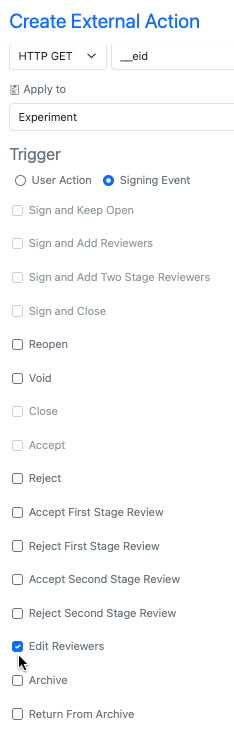
We have added a new signing event external action trigger for “Edit Reviewers” this allows for maintaining any external actions used for initially adding reviewers to also be used if those reviewers are edited.

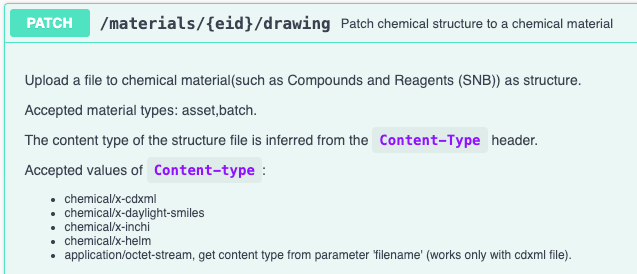
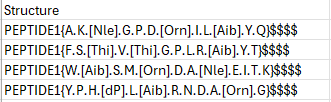
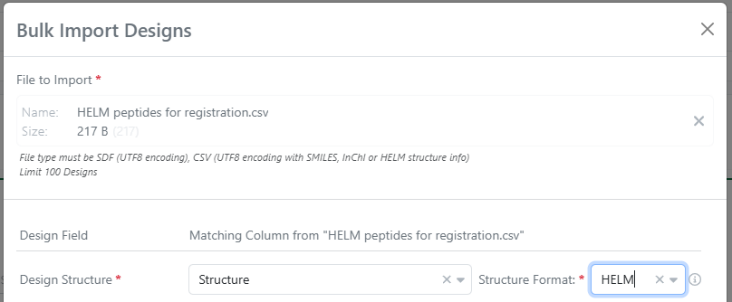
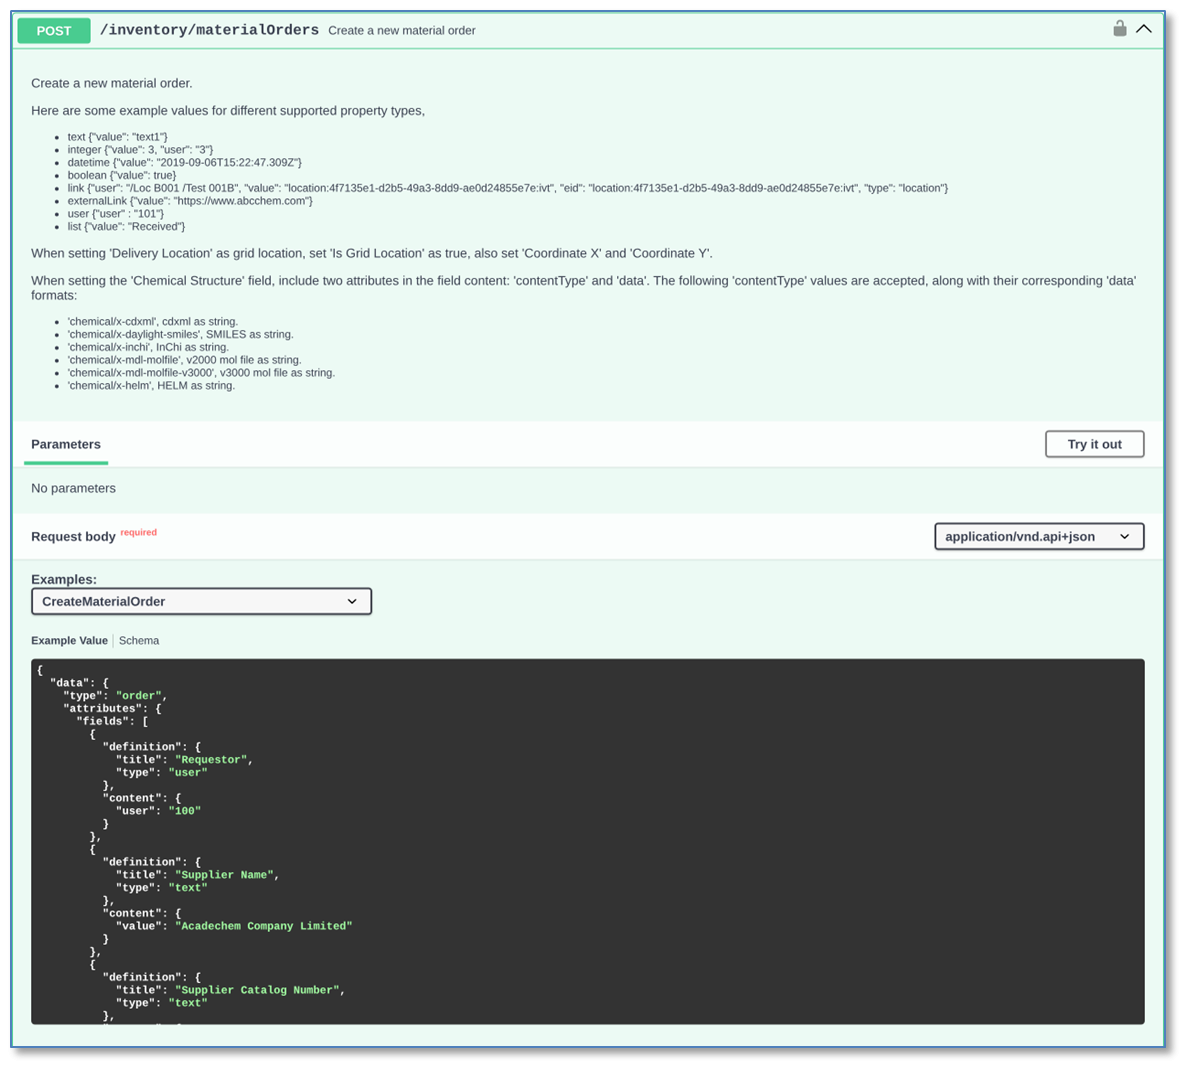
We have enhanced the API for patching material chemical drawings to accept additional chemical structure formats. The API now supports SMILES, InChI, and HELM chemical structures. You must specify the which in the request “Content-type” header. For the new content types the “filename” parameter will be ignored.

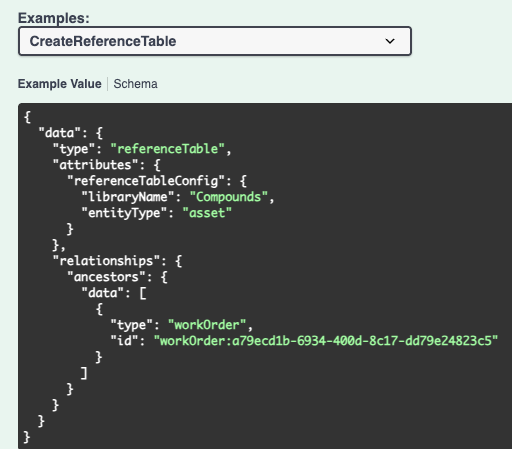
We have enhanced existing APIs to allow for creating Reference Tables in Synergy Work Orders. The library and entity type must be included in the request body. This will create a new reference table with no columns configured. Existing APIs for editing the displayed columns should be utilized to show columns.

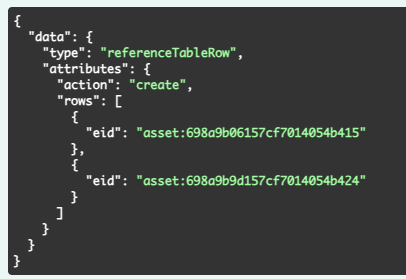
We have added new APIs to add or delete reference(s) for existing Reference Tables. You must specify the action (create or delete) and the specific entities for the rows being added or deleted.

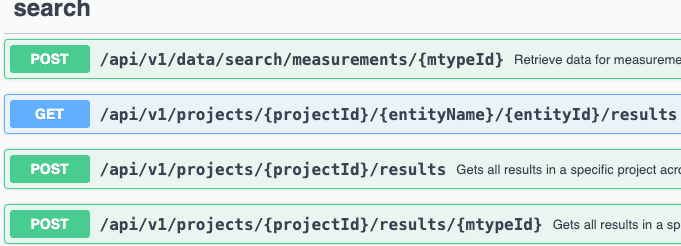
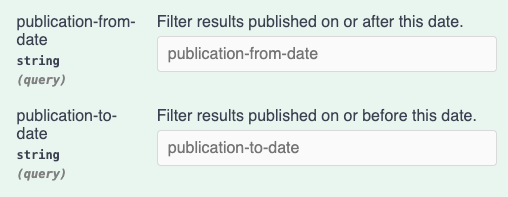
We have enhanced the search APIs for Signals Data Factory. You may now specify publication-from-date and publication-to-date as URL parameters in ISO 8601 format. This will filter results to the specified ranges.

We have added support for Proof Key for Code Exchange (PKCE) to our Bearer Token authorization flows. This is now an option for all current and future clients. This does not replace or break the Implicit Grant flow, it only adds the additional option. Additional details are available in the admin System Configuration Guide.

Beta Features 

The following capabilities are in beta and are available for users, administrators and developers on the Signals platform upon request. Please contact your account representative or our support team if you would like access to the following features.

Data Workflows & Analytics

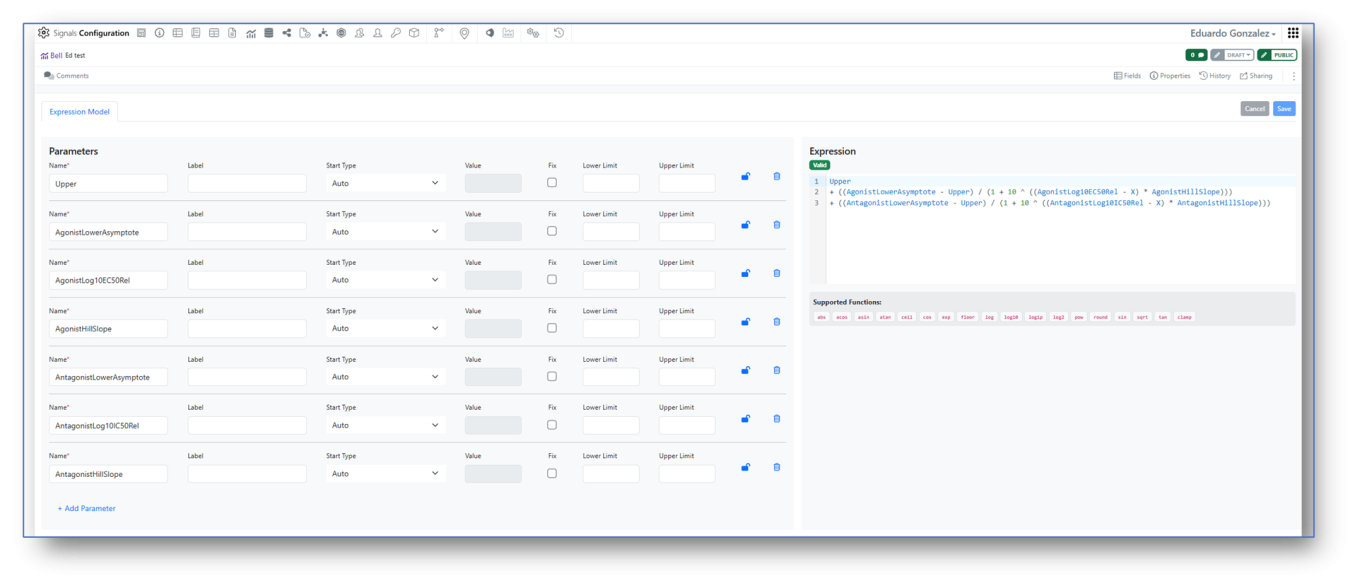
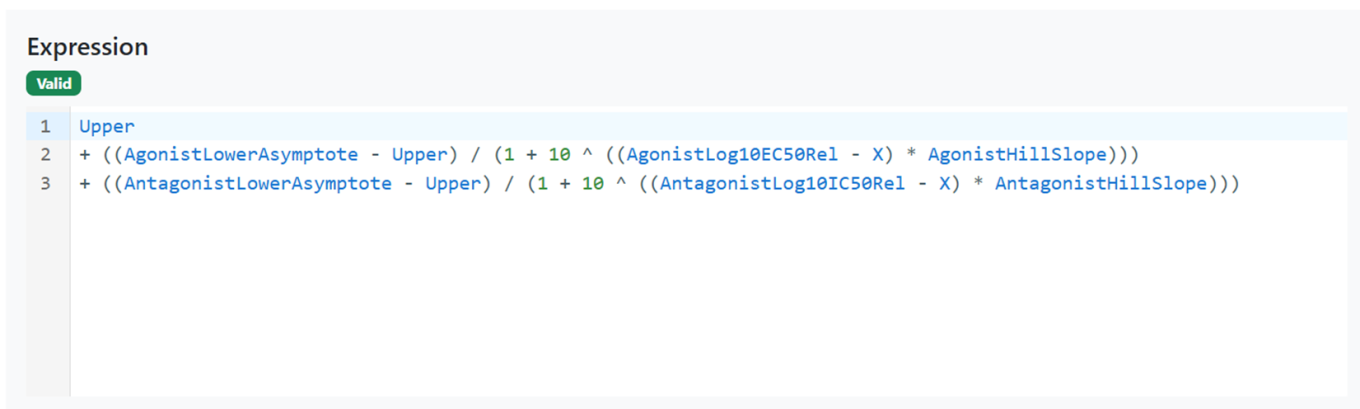
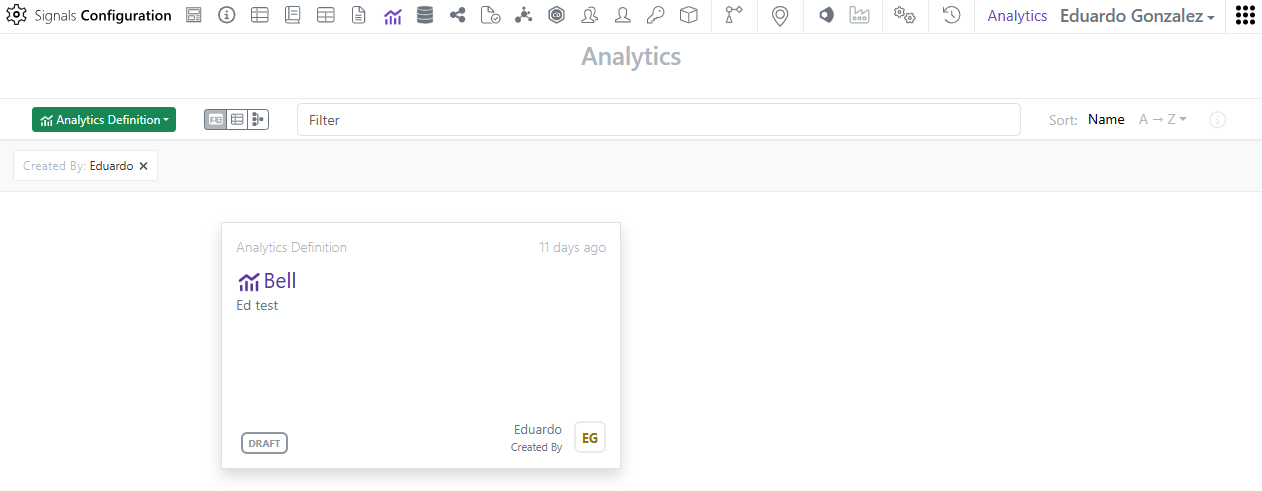
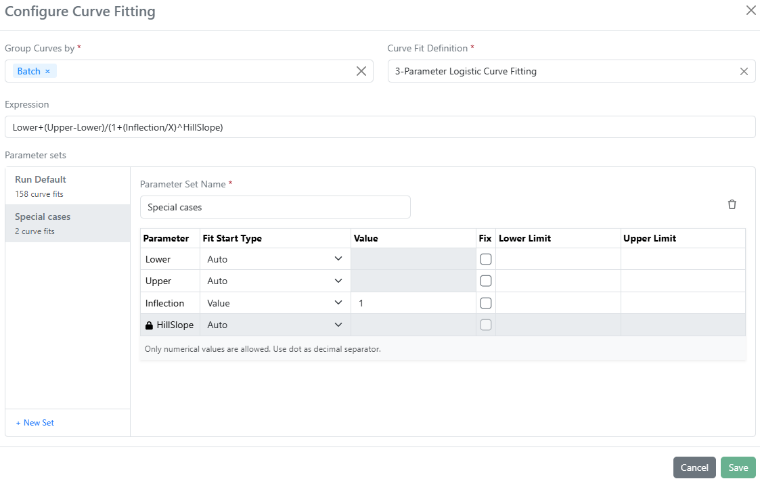
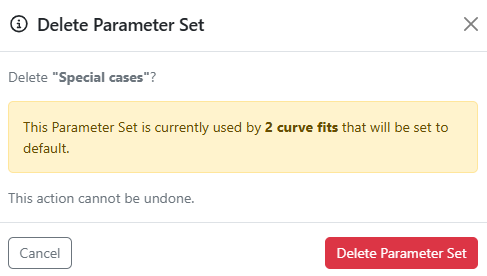
Signals Configuration allows creation of custom Analytics definitions for Curve Fitting. A mathematical Expression Editor is now available in conjunction with the settings associated to the expression parameters, which can be locked to ensure consistent start values and limits.

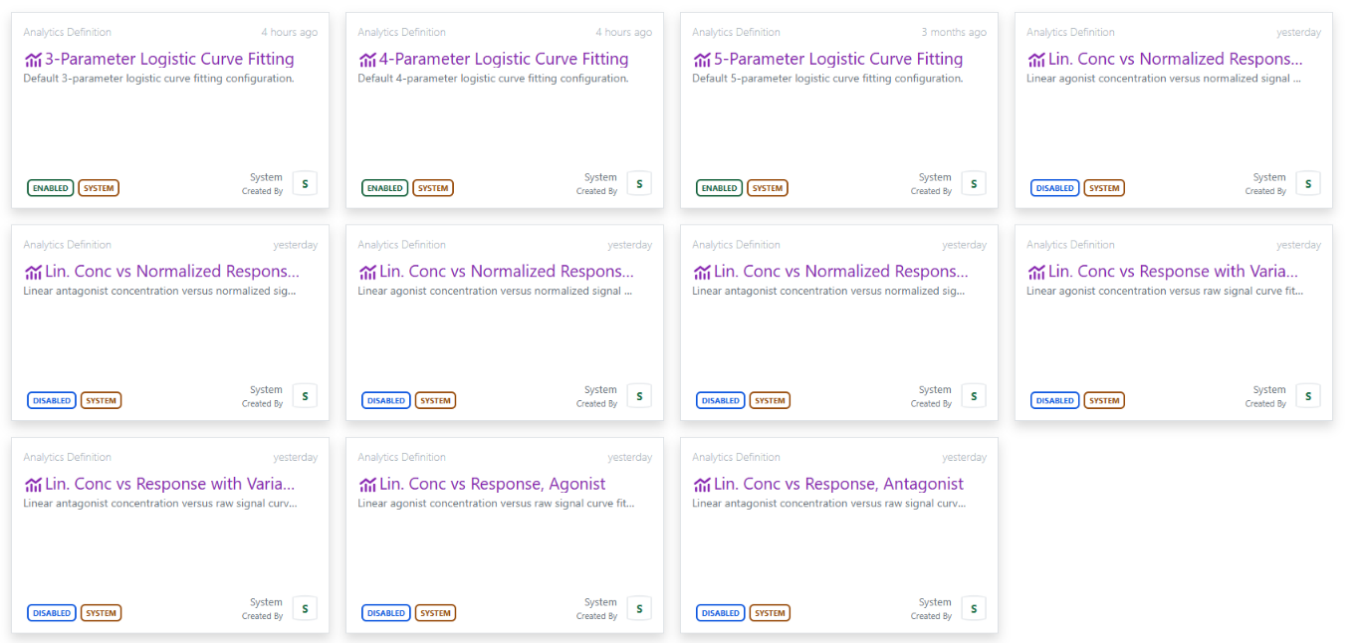
Access to the custom Analytics definitions is restricted to System administrators and Users with the “Manage Analytics Definitions” permission. The multi-line editor checks the validity of the expression that can then be saved, enabled and shared for curve fitting (here an example of a bell-shaped expression).

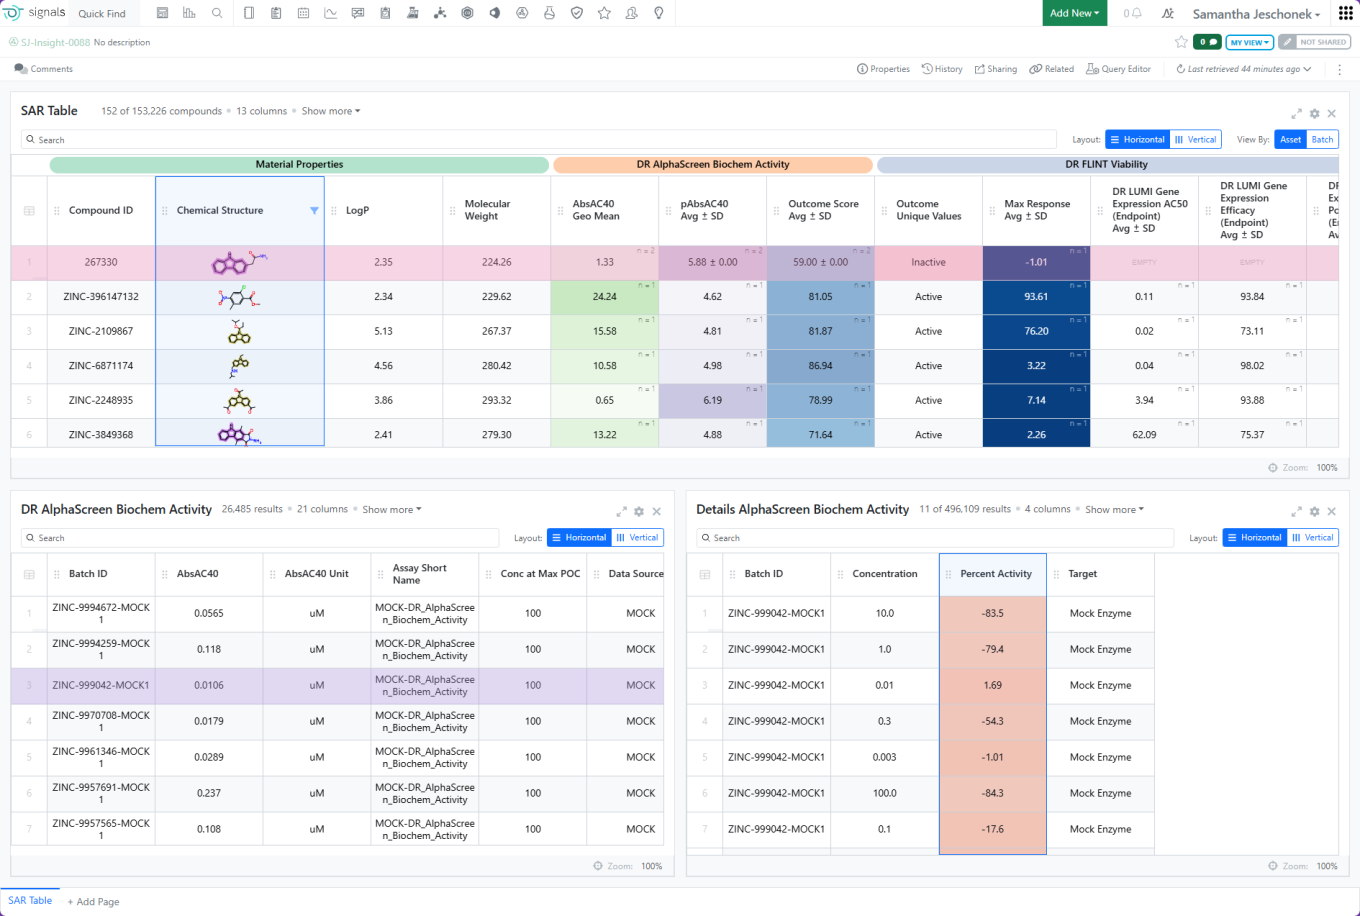
The custom endpoints of a curve fit can be published for subsequent SAR & Decision Making. 

Tables

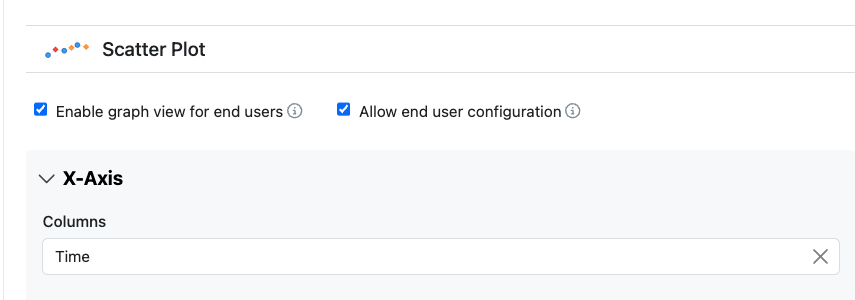
Configuration administrators can now give end users the ability to alter the configuration of Scatter Plots. The option to allow end users this ability is defined within the Visualization settings.

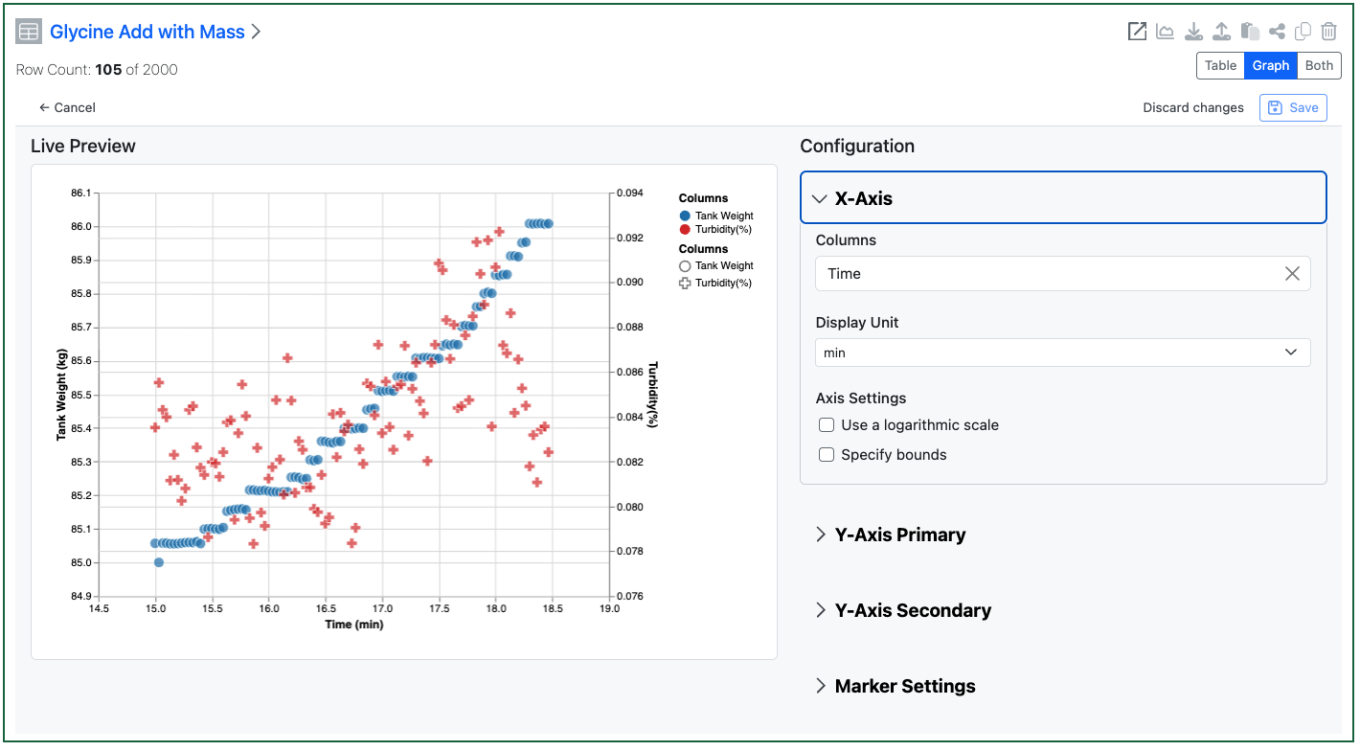
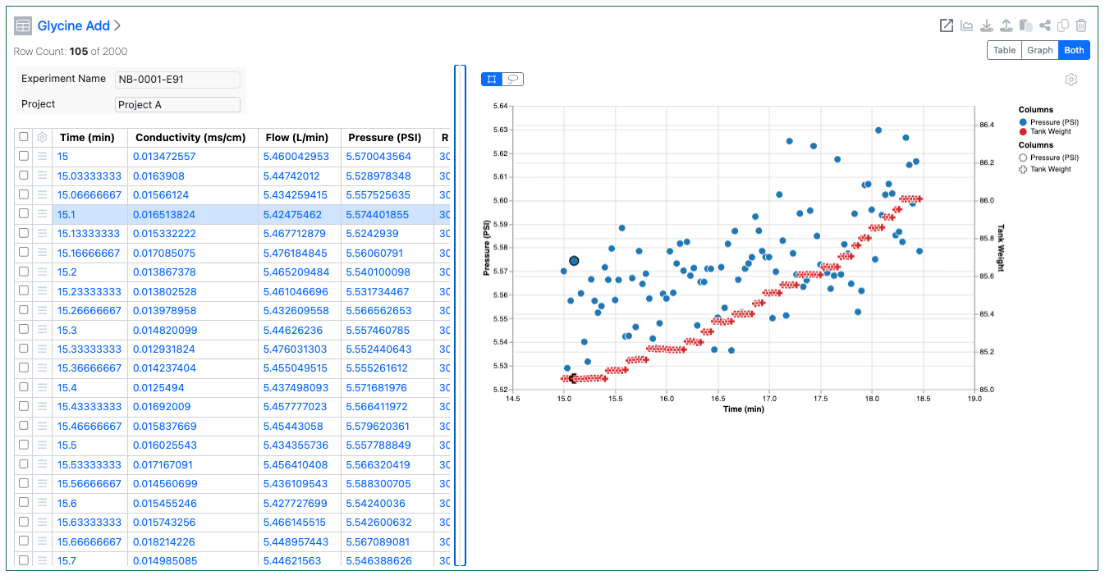
The end user can then access the setup of the chart to change the display of the axes etc. Changes are saved on demand if the user has Edit on the Experiment.

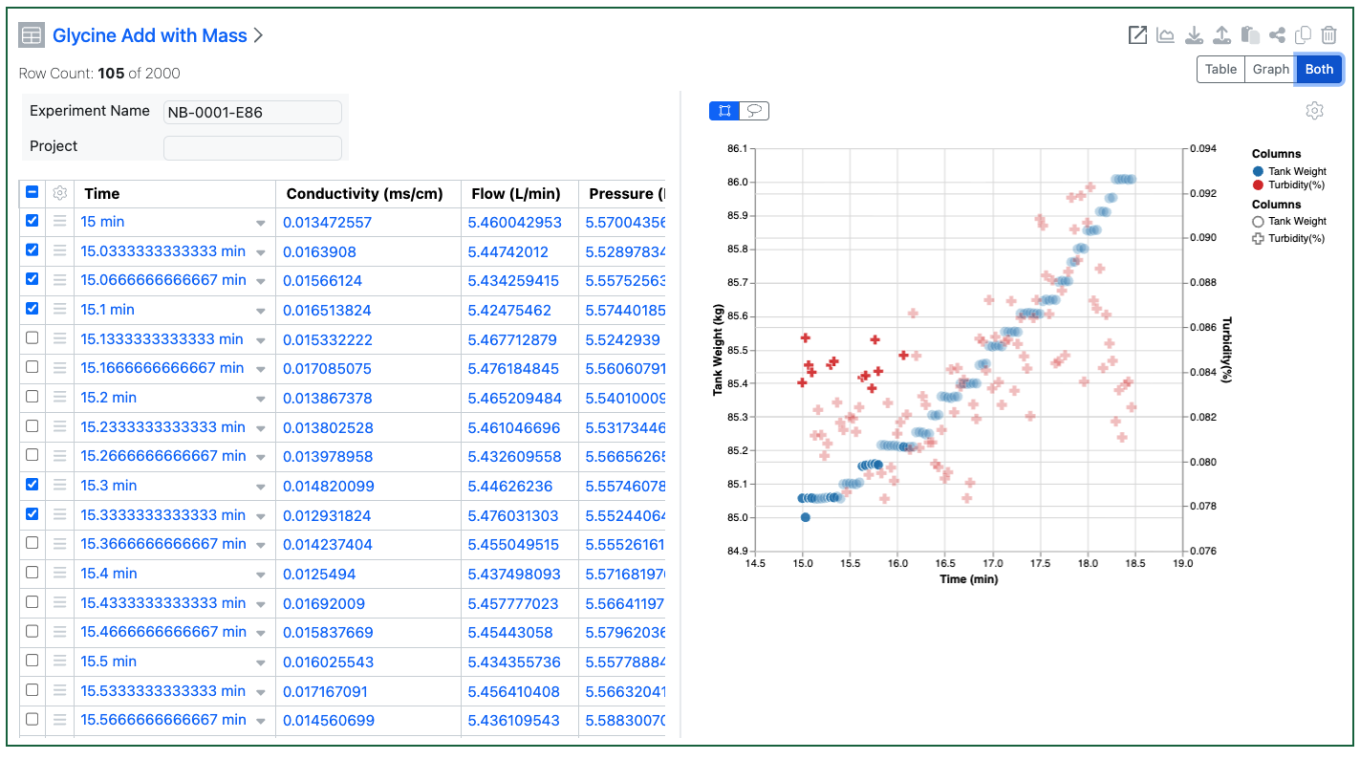
The end user can also decide to see the table and graph simultaneously. Selections in the table are highlighted in the graph view, and visa-versa. Users can select in the graph via dragging a rectangle or using a lasso to select an irregular area.

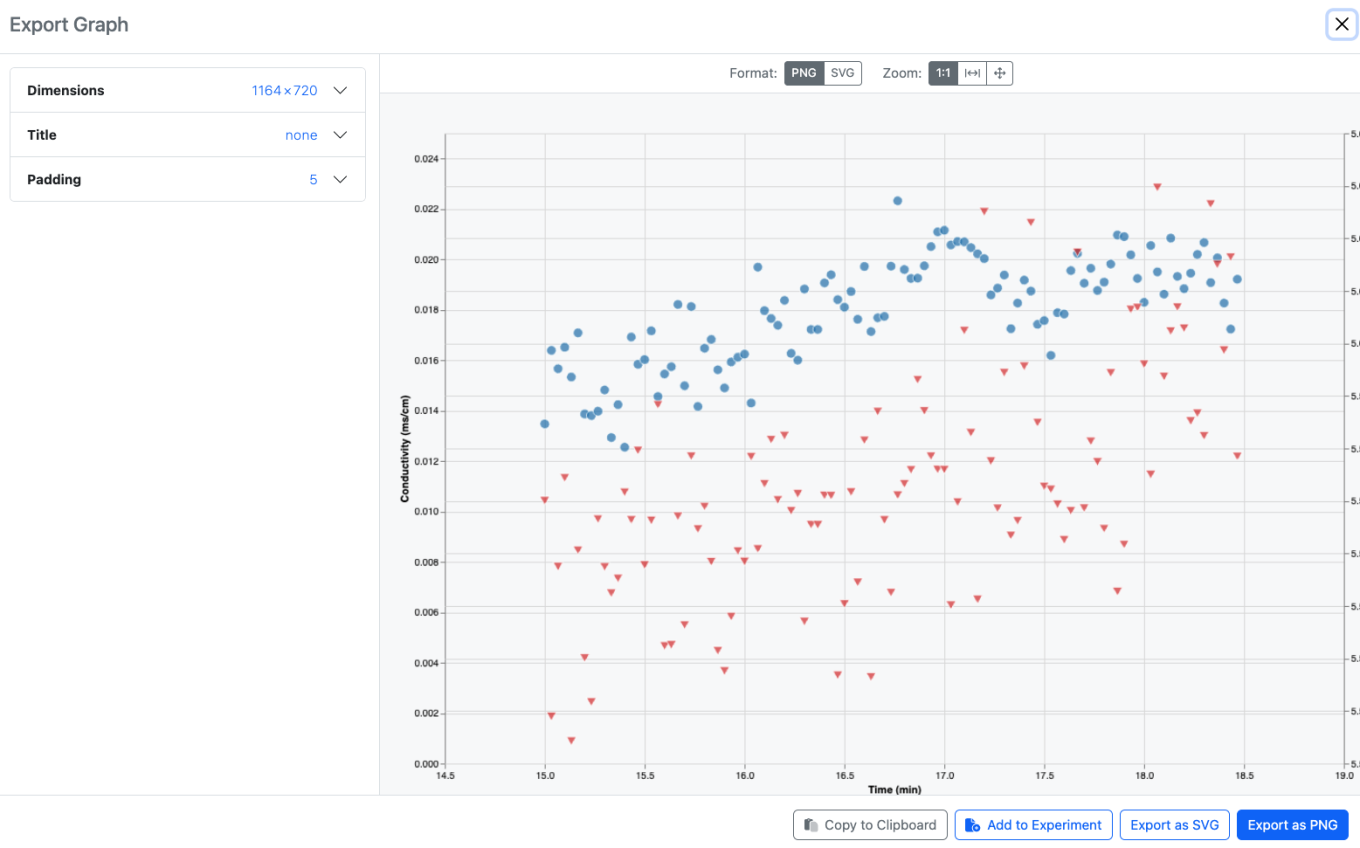
Users can also export an image of the graph, either to their clipboard, or as a downloaded file, or as an Image File directly back into the same experiment. Note that the exported image reflects the saved graph, unsaved changes by the end user will not be shown.

What’s New


We are delighted to release our new version of Signals, 26.4.


The following improvements are available for users, administrators and developers on the Signals platform. Certain features may only be available with appropriate licensing and/or with enablement by an administrator.


  • Fundamentals 
    – Ontologies integration allows terms to be used across experiments, materials, tables, and more available to all systems
    – Ontology integration now supported in Synergy, including Collaboration, Idea, Work Order, and Synergy Experiments Templates, as well as Designs and Reference Table fields available to all systems
    – CSV import handling for ontology terms
    – Ontology support for plate templates
    – External Ontology Sources now support SciBite CENtree
    – Audit trail displays highlighted granular changes for text elements (beta)
  • AI
    – Prompt-to-filter (beta)*
  • Data Workflows & Analytics*
    – Data Assembly continuous viewer
    – Median-based robust Normalizations
    – Additional Quality Control metrics
  • SAR & Decisioning*
    – Ontology support on Inventa Analysis templates
    – New ChemCharts Biopolymer data functions
    – ChemCharts Table usability improvements
  • Synergy†
    – Collaboration setting allows Sponsor admin to choose whether to use Material IDs or aliased ExIDs with CROs
    – Search for Synergy Experiments based on Work Order
    – System Snippets are available for CRO users
    – Work Tasks in Work Orders (beta)
  • Chemistry
    – Multi-strand and branched complex biopolymers now supported
    – Upload of rdf file types to External Enumerator
  • Tables
    – Definition and display of Scatter Plots on Admin Defined Tables available to all systems*
    – End user adjustment of Scatter Plots available to all systems*
    – Export of image from Scatter Plots available to all systems*
    – Highlight selected rows or points in the Scatter Plot and Table available to all systems*
    – Definition and display of Bar Charts on Admin Defined Tables*
    – Define and display Size By and Transparency on Scatter Plot to enable Bubble Charts on Admin Defined Tables*
  • Inventory
    – Enable container ID and barcode selection directly within Reagent tables
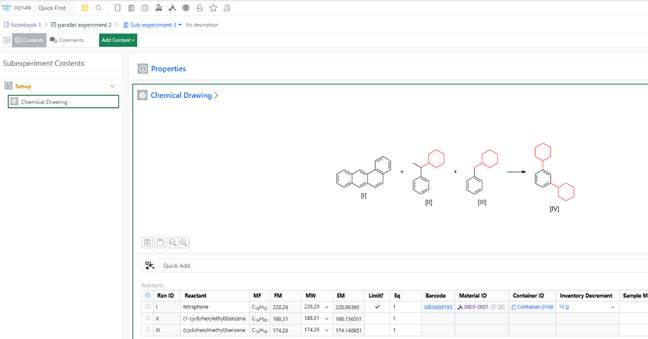
    – Support Inventory Decrement at Sub‑Experiment Level in Parallel Experiments
    – Display container details in Samples table when Material ID is present
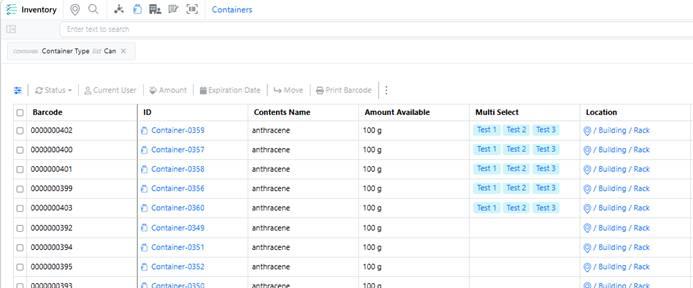
    – Multi Select property display in the Container search table
  • InventoryGo‡
    – Flexible reconciliation workflows introduced: Batch vs. Individual scanning options
  • Administration
    – Migration for legacy Data Factory projects
    – ­Spotfire for Signals Online Access privilege available
    – Admin Defined Dashboards
    – Audit trail displays highlighted granular changes for admin-defined tables (beta)
  • Integrations & APIs
    – Ontology API Support
    – Salt Stripping Data for Chemical Drawings fetch API
    – Entity properties on Bulk Export API
    – Update Hierarchical Tables Headers API
    – External Enumerator via API
    – Bulk create Samples via Summary Table via API

* Requires Signals One license
† Requires Signals Synergy license
‡ Requires InventoryGo license

We also fixed several small bugs in this release. Details of the enhancements are described below.

Administrators are recommended to subscribe to the channels within our support news site found at https://support.revvitysignals.com/hc/en-us/categories/360004446171-Support-News which contains more information about releases and other pertinent product information.

Data Factory administrators should be aware that the Bulk Delete option from the Inventa Dashboard is now available regardless of the “Enable system-generated Unique Result IDs in Spotfire workflows” setting. However, Using Bulk Delete still requires explicit mapping of a Unique Result ID.

Data Factory Administrators should note that legacy Data Factory projects will be fully deprecated in a future release. A straightforward migration path is now available to support this transition. A specific deadline has not yet been scheduled.

Data Factory administrators should also note that the Advanced Security policies in Inventa apply an “AND” logic across all user groups, restricting access if any groups lack permissions. This behavior differs from the standard Signals security model and will be fixed to align with the standard in a future release.

This content is anticipated for release on our Production E3 environments, and for Private Cloud customers on our deferred release schedule, in November 2026.


Further Details

The following improvements are available for users, administrators and developers on the Signals platform. Certain features may only be available with appropriate licensing and/or with enablement by an administrator.

Fundamentals
Image 1 from What's New 26.4-2.docx

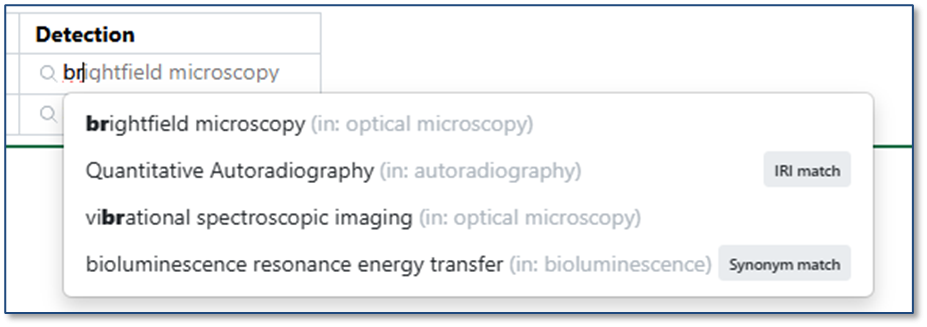
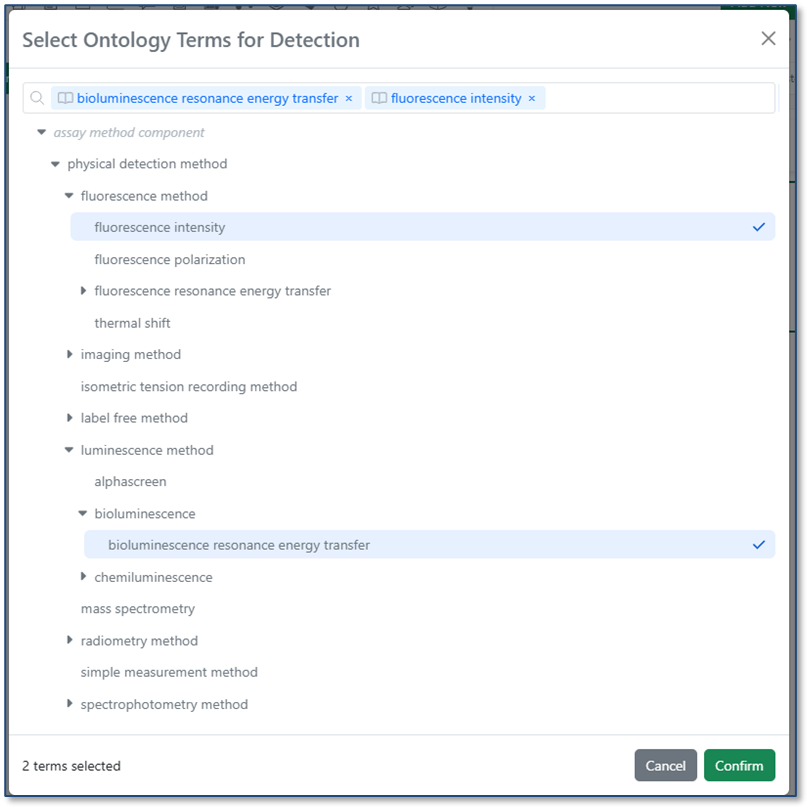
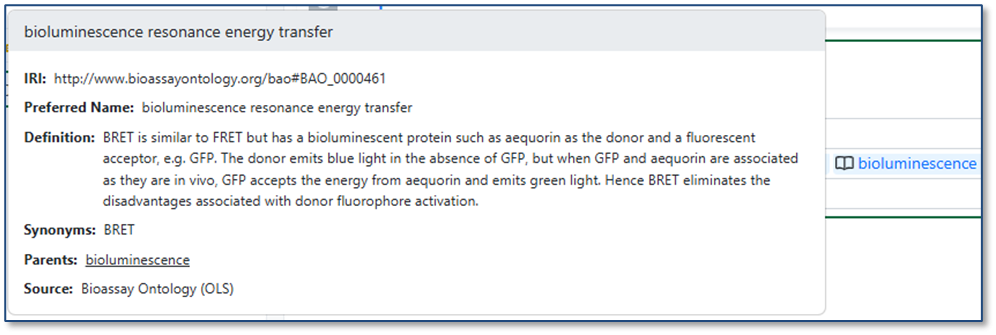
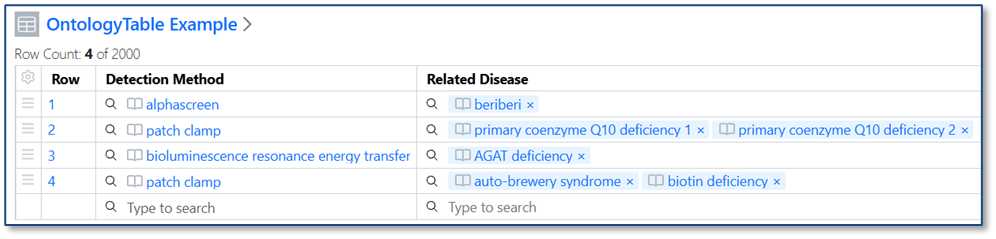
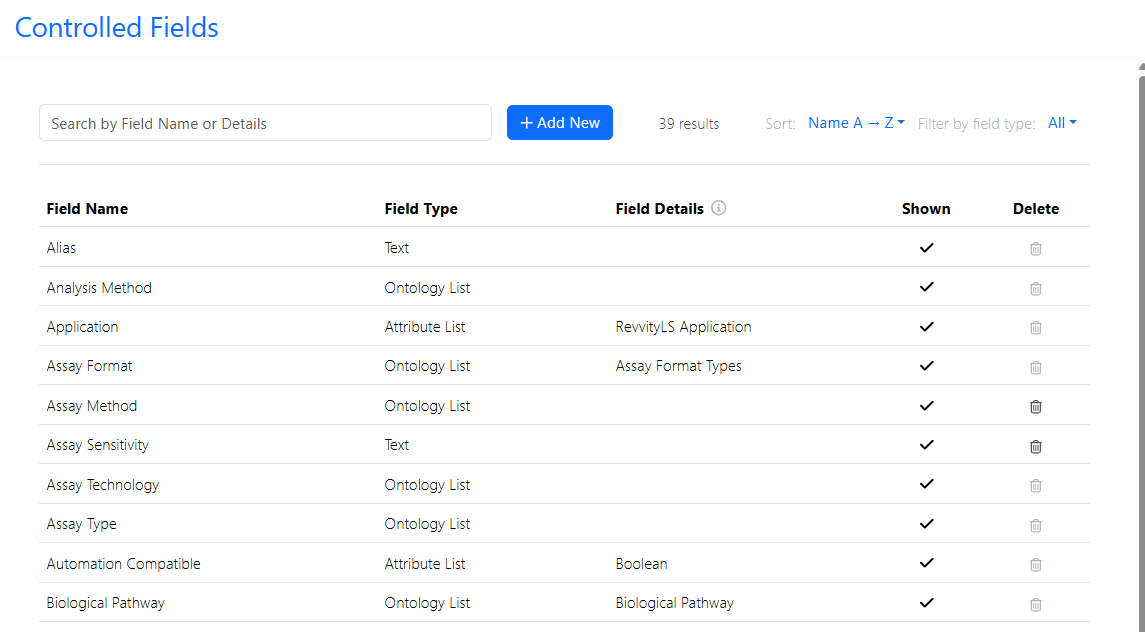
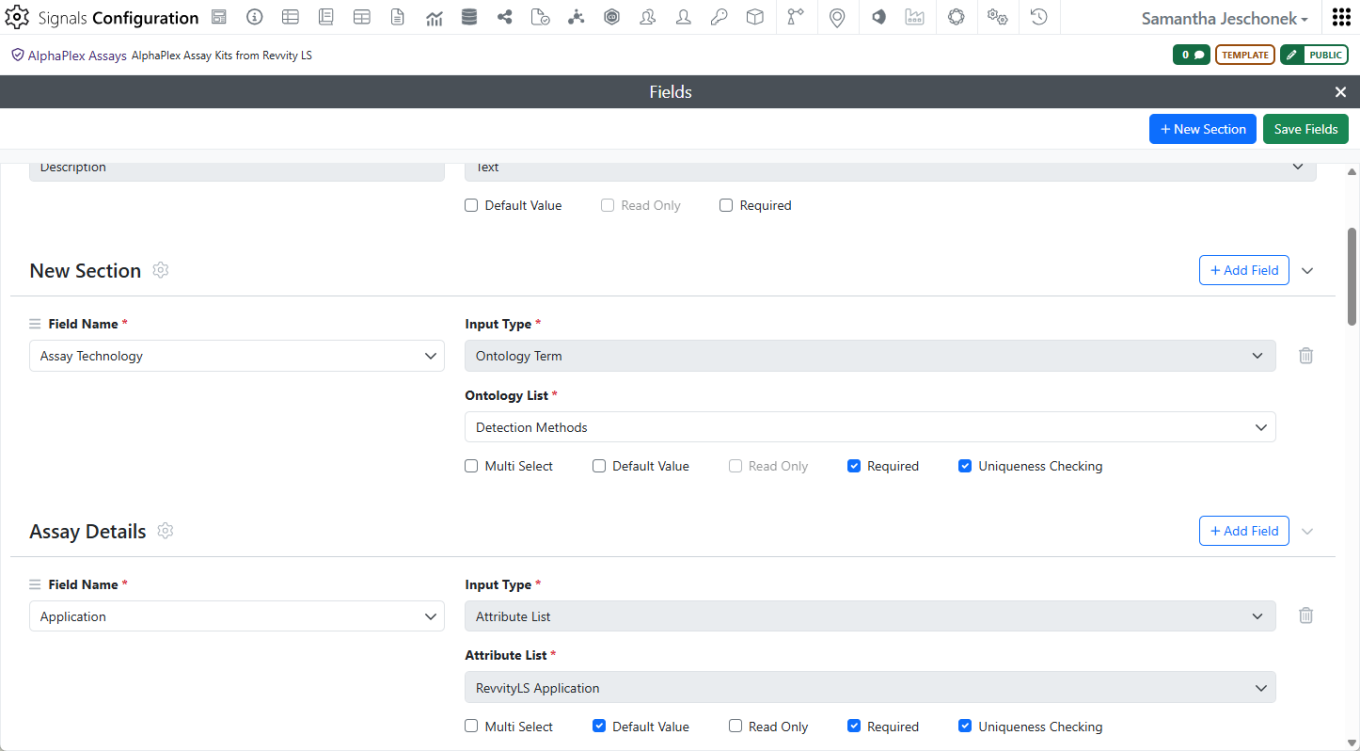
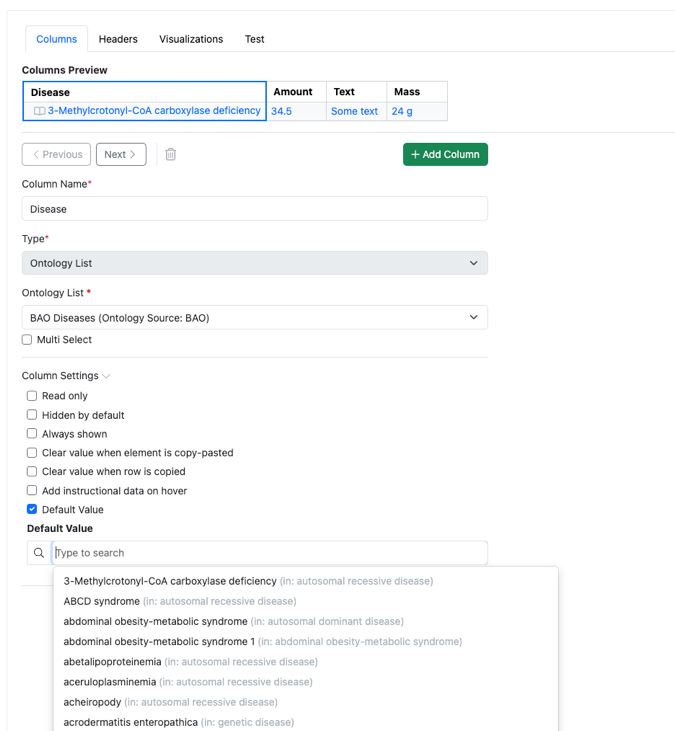
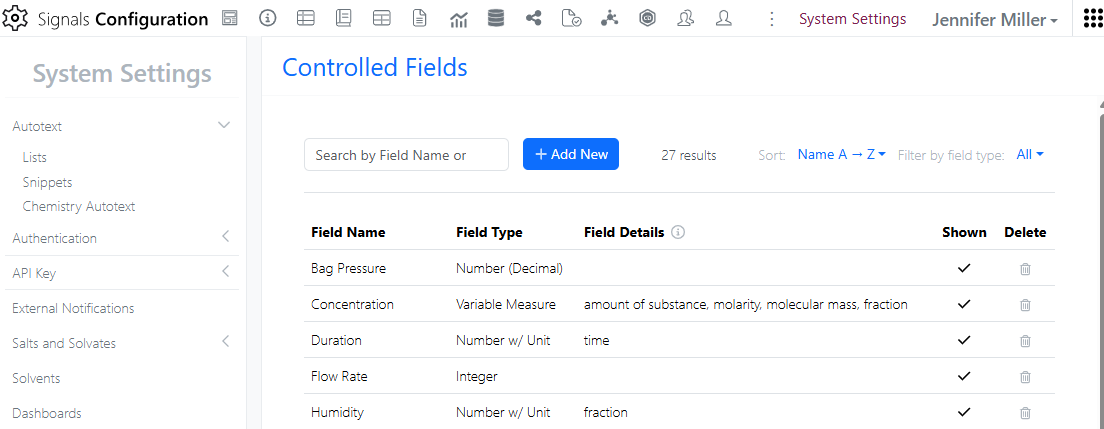
Ontology support is now available for all systems. Administrators may connect to a ontology provider (BioPortal, OLS, or SciBite CENtree) as an External Ontology. Once a specific ontology from that source is connected, Administrators can create a new type of Attribute, Ontology Lists, which contain a subset of terms from the ontology. This Ontology List can be used in templates and properties across signals, including Experiments, Materials, Tables, Samples, Admin Defined Objects, Plates, Inventa Analyses (for Signals One), Synergy Experiments and Design/Reference Tables, and more.

Image 2 from What's New 26.4-2.docx
Image 3 from What's New 26.4-2.docx
Image 4 from What's New 26.4-2.docx

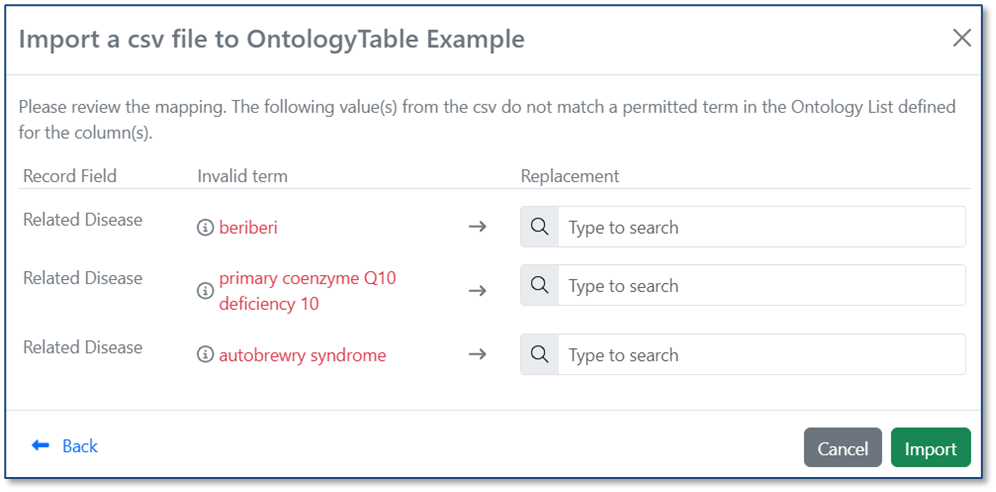
When you import a CSV into a table, ontology values are now validated against the Ontology List for that field. If a value in the CSV matches a term’s preferred name or any synonym, it is automatically mapped to the correct ontology term. If no matching term is found, users can resolve the value during import by selecting the appropriate term from the Ontology List.

Image 5 from What's New 26.4-2.docx
Image 6 from What's New 26.4-2.docx

Data Workflows & Analytics

Image 7 from What's New 26.4-2.docx

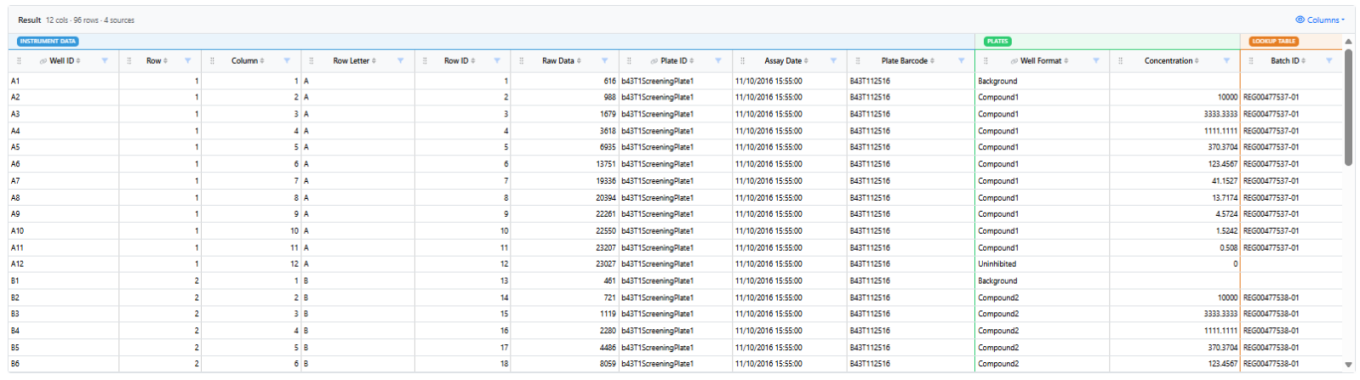
In Signals One, all In Vitro Analysis users will discover that in the Data Assembly step, the 5-rows static preview has been replaced by an interactive viewer with continuous scroll. Numerical and categorical columns can now be filtered, sorted, reordered and hidden to flexibly slice and dice the data that will be used in the Analytics steps. Visual cues indicate the source data of the columns, and which columns were used during the matching process.

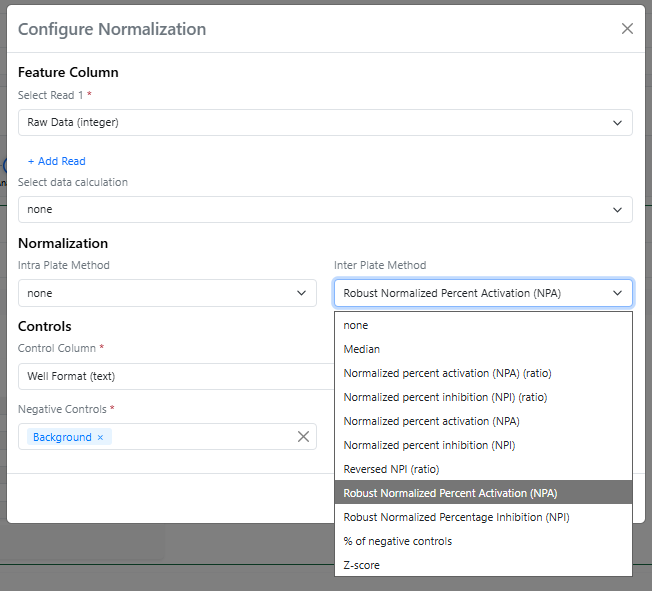
In the Analytics steps of the In Vitro Analysis, a couple of new normalization methods, using the median instead of the average, can now be found in the Inter Plate Method menu, both with the “Robust” prefix.

Image 8 from What's New 26.4-2.docx

The Robust Normalized Percent Activation is calculated using the expression: “(value - median(n)) / (median(p) - median(n)) * 100” while the Robust Normalized Percent Inhibition is calculated using the expression: “(median(p) – value) / (median(p) - median(n)) * 100” (where p and n are the values for positive and negative controls). Median-based normalizations are called "Robust" because they are not heavily influenced by extreme outliers.

Finally, the mean and standard deviation of both positive and negative controls are calculated and added to the Normalization results.

SAR & Decisioning

Image 9 from What's New 26.4-2.docx

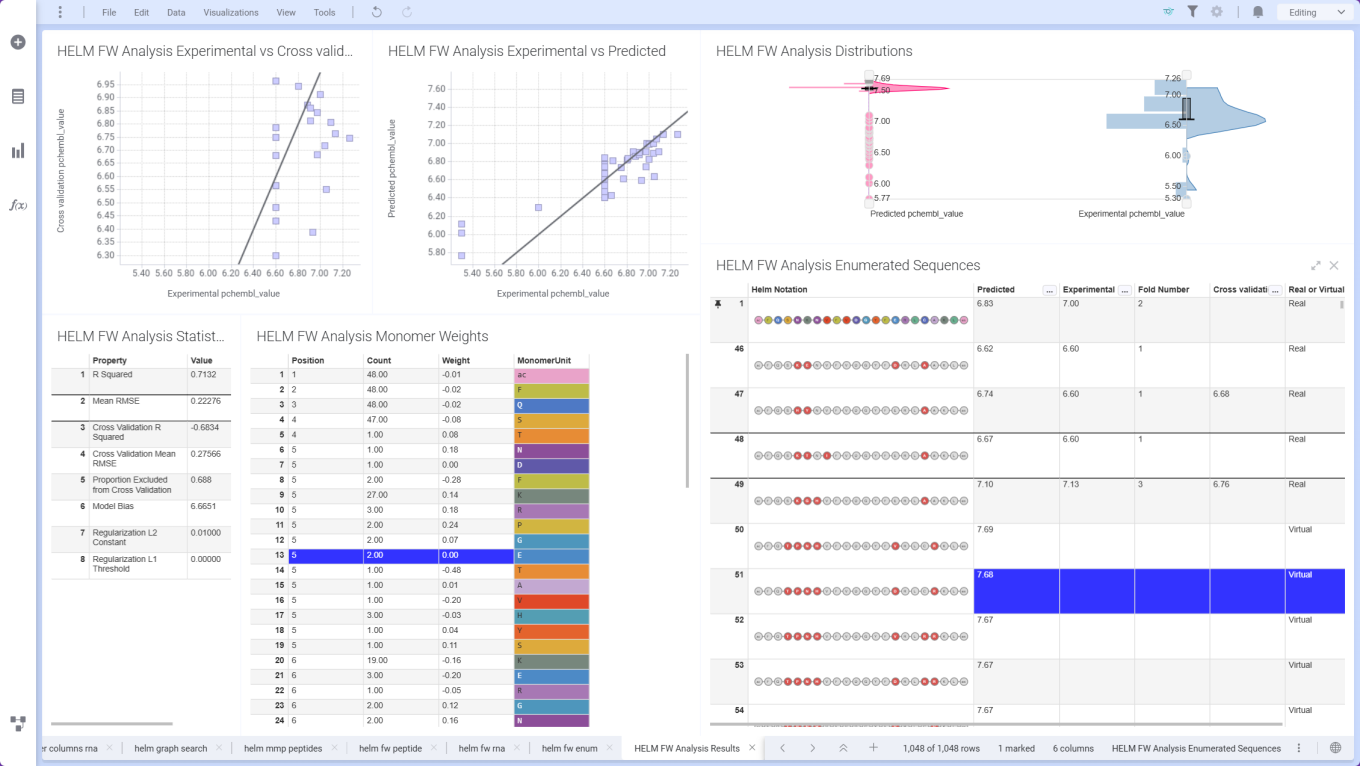
ChemCharts Data Functions introduce Free‑Wilson analysis for HELM sequences, using aligned sequence and property data to quantify position‑specific monomer contributions. Combined with the Free‑Wilson Enumerator, users can design and prioritize novel HELM sequences based on predicted performance.

Image 10 from What's New 26.4-2.docx

ChemCharts Table Visualizations now support a crosshair, which once activated highlights the cell, row number, and column header when moving the mouse.

Synergy

Image 11 from What's New 26.4-2.docx

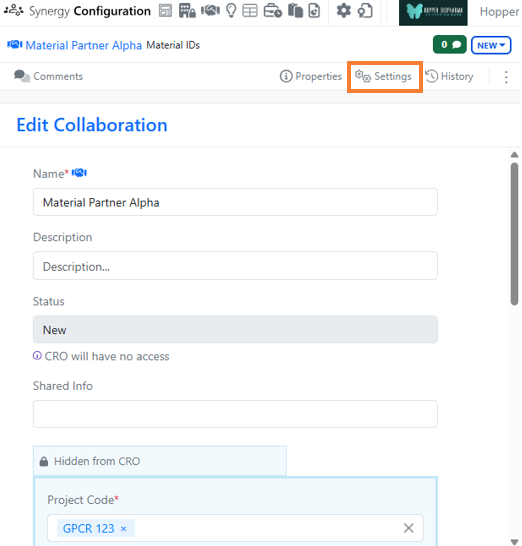
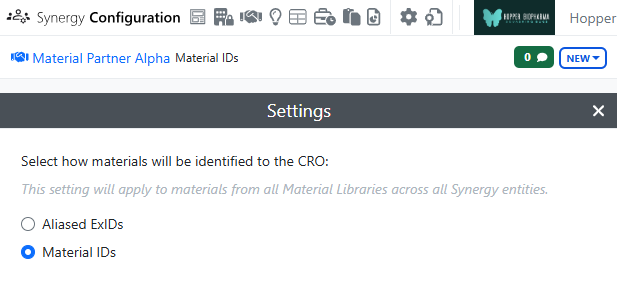
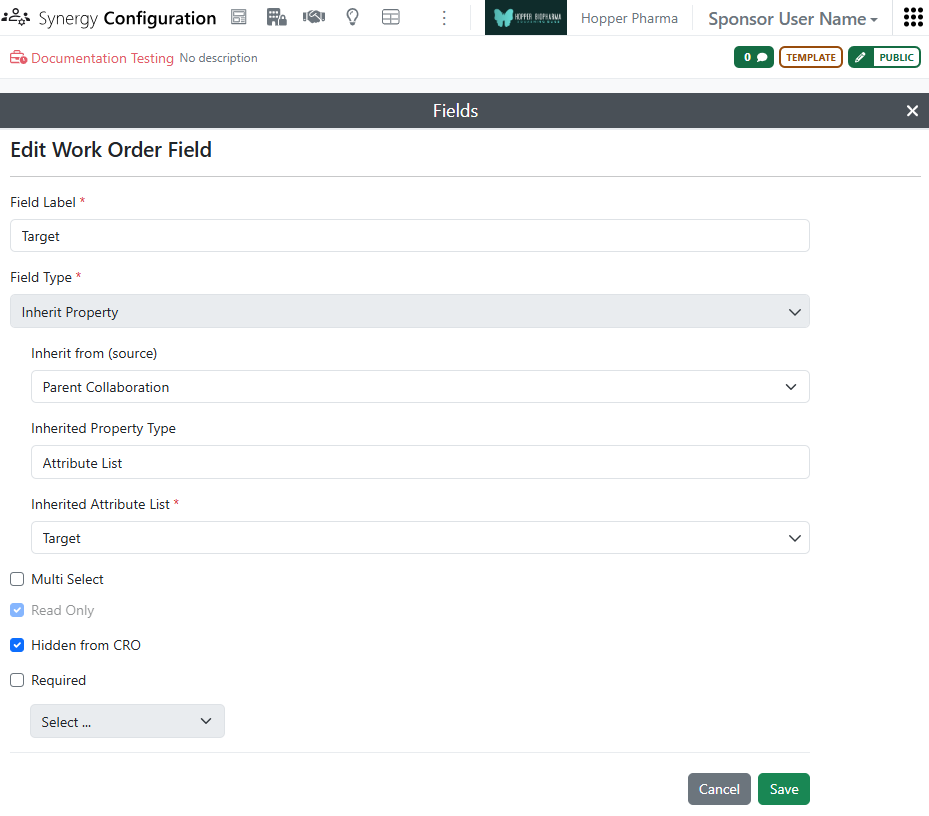
Synergy now allows the administrator to choose whether to use aliased ExIDs or Material IDs with a CRO on a Collaboration-by-Collaboration basis. An administrator with the privilege Manage Collaborations has access to a new Collaborations Settings menu on a Collaboration where the administrator can choose between aliased ExIDs or Material IDs. The default is ExIDs to support the current behavior. This setting can only be changed while the Collaboration is New (before being sent to the CRO) and no child Work Orders are yet created.

Image 12 from What's New 26.4-2.docx

Image 13 from What's New 26.4-2.docx

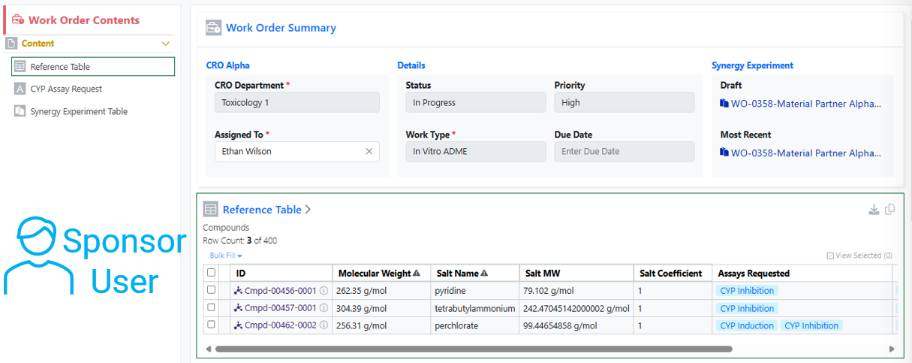
If the Collaboration is set to Materials IDs, materials shared via the Reference Table will display with their Material IDs to both the CRO and Sponsor. The Sponsor will not have a toggle to switch between the IDs, indicating that the Material ID will be shared with the CRO.

Image 14 from What's New 26.4-2.docx
Image 15 from What's New 26.4-2.docx

The use of Material IDs persists throughout the Collaboration in all child Work Orders and Synergy Experiments. For example, when a CRO user populates an internal reference column in an admin-defined table or when the Sponsor registers a Sample in a Samples table, the column will display the Material ID for both the Sponsor and CRO.

Image 16 from What's New 26.4-2.docx

If the Collaboration is set to ExIDs (default), materials shared via the Reference Table will display with their ExIDs to the CRO, and the Sponsor will have a toggle to switch between the ExIDs, Material IDs, or both (existing behavior).

Image 17 from What's New 26.4-2.docx

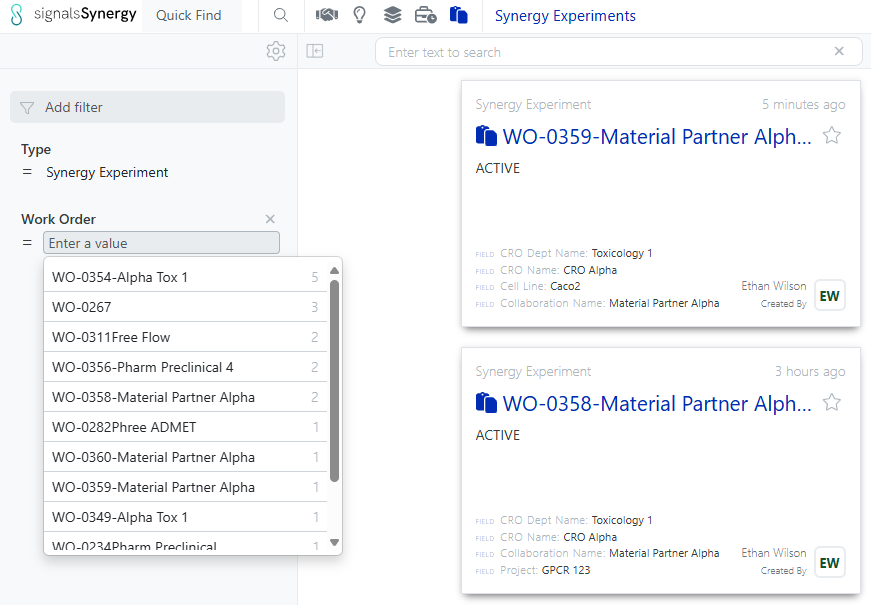
Both Sponsor and CRO users can now search for Synergy Experiments by the associated Work Order ID. The Work Order filter can be added in Advanced Search, typically alongside Type = Synergy Experiment, or to the Synergy Experiments Smart Folder.

Image 18 from What's New 26.4-2.docx

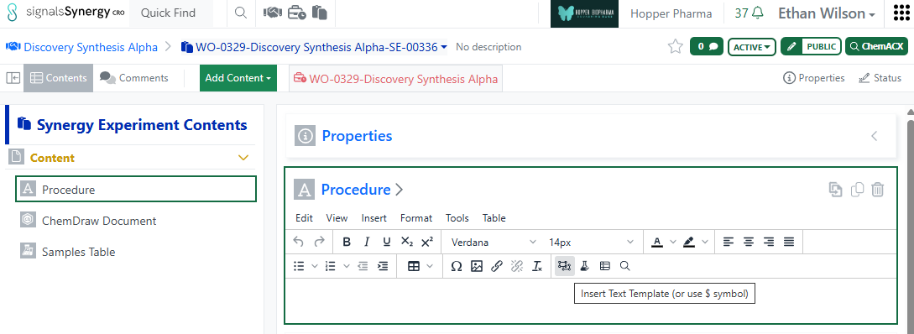
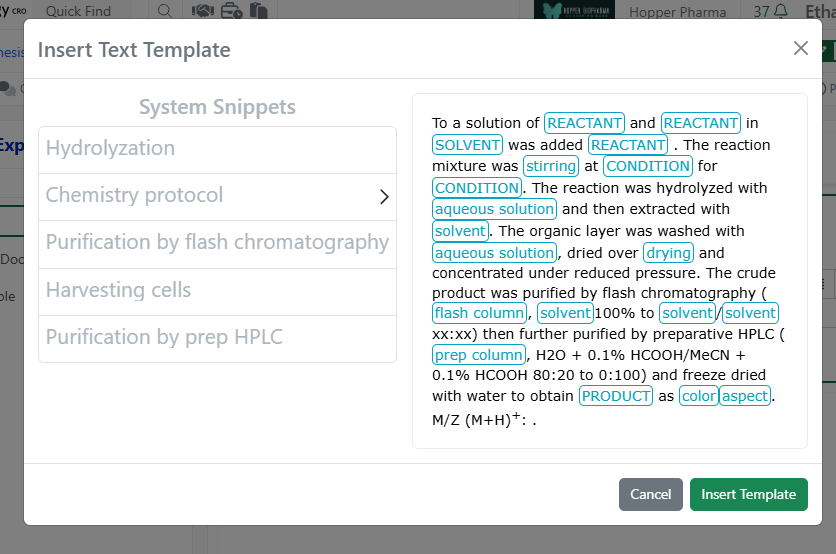
Finally, CRO users can now access and insert System Snippets using the Insert Text Template on any Text element. Note, CRO users cannot save text templates to avoid cluttering the template options for all users.

Image 19 from What's New 26.4-2.docx

Chemistry

Image 20 from What's New 26.4-2.docx

The ChemDraw editor now supports rendering and cleanup of multi-strand and branched complex biopolymers, making these structures easier to display in a clear, aligned, and readable layout.

Image 21 from What's New 26.4-2.docx

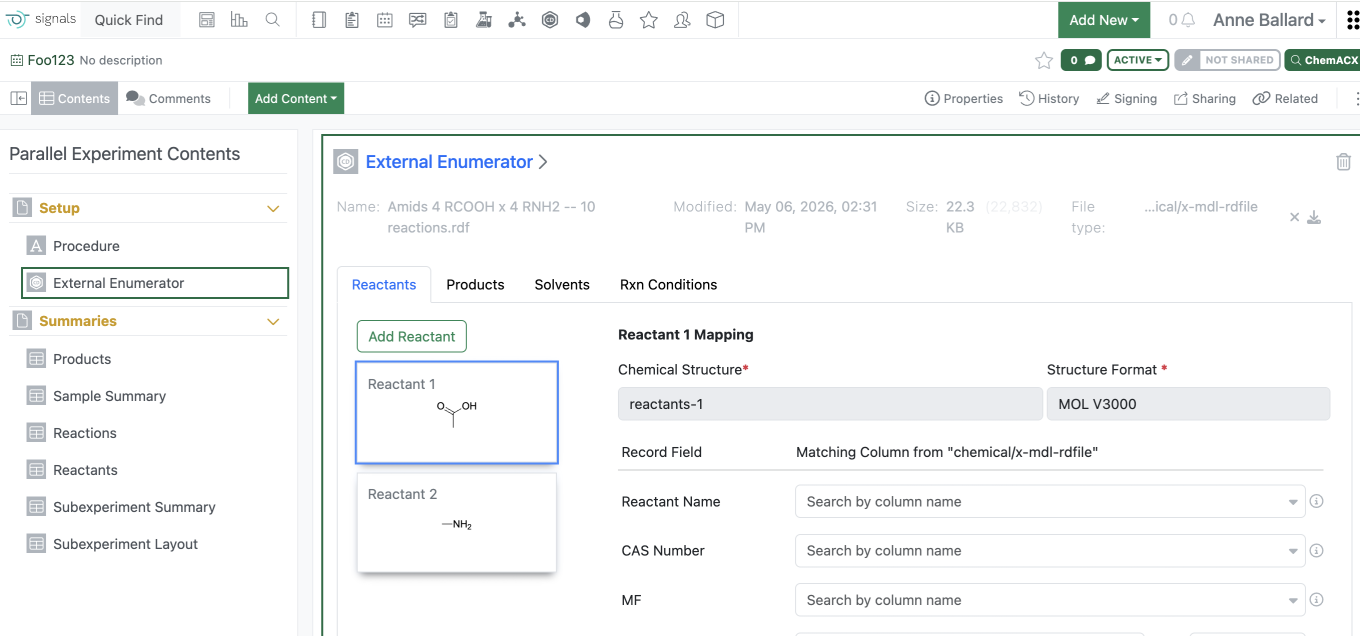
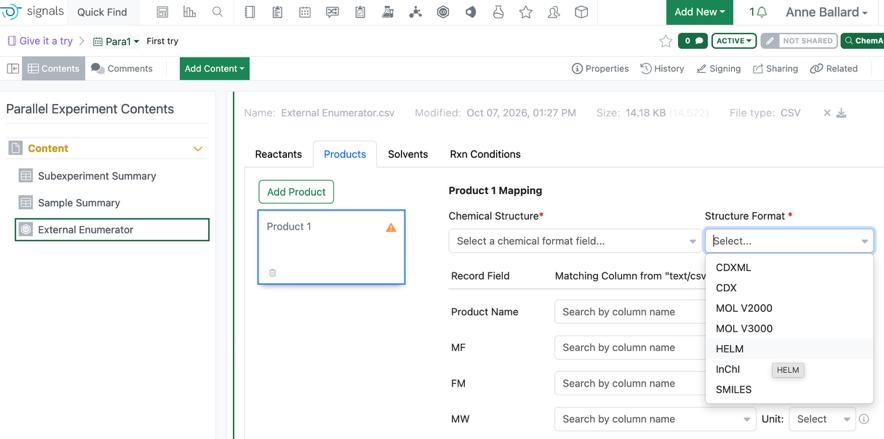
Users are now able to load an RDF type file into the External Enumerator for Parallel Experiment enumeration. Fields within the rdf can be mapped into the external enumerator. Reactant order is defined by the rdf file. Solvent and Rxn Conditions are not commonly included in the rdf file and therefore will need to be added manually.

Additional reactants or products can be added manually similarly to what can currently be managed.

Tables

Image 22 from What's New 26.4-2.docx

Scatter Plots are now available to all tenants. End users require a Signals One license to view and edit charts in ADTs.

Image 23 from What's New 26.4-2.docx

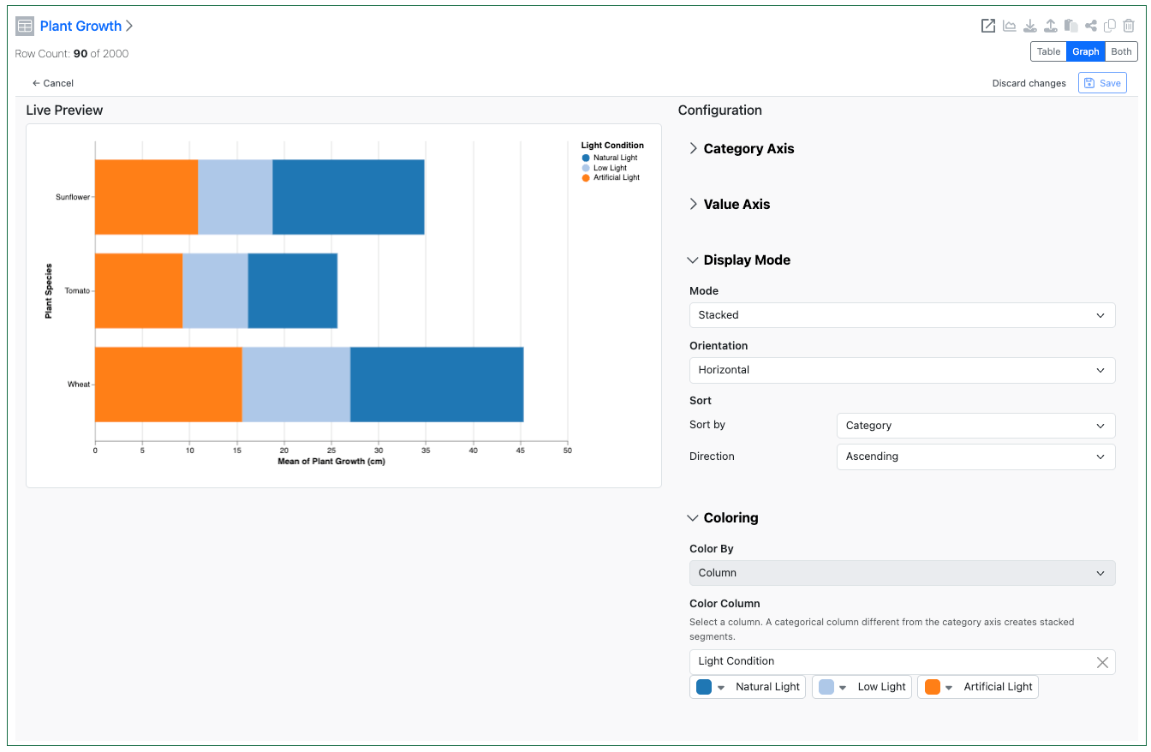
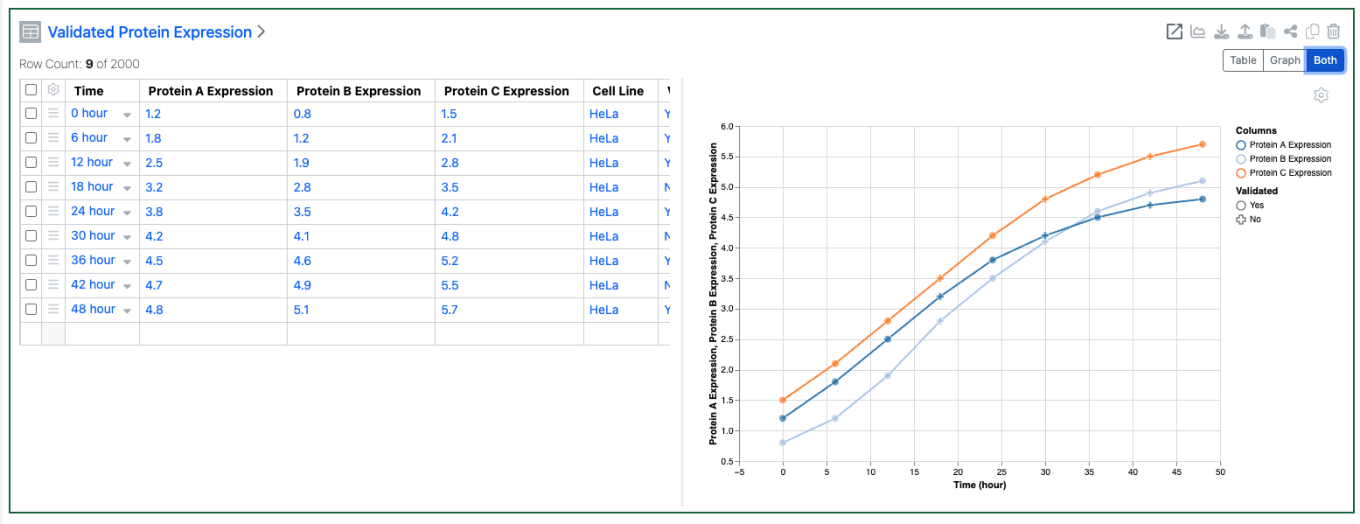
Configuration Administrators can now choose to define a Bar Chart on Admin Defined Tables. Similar to the definition of Scatter Plots, administrators can define the Bar Chart on the Table template including setting properties for the value and categorical axis. The chart can be a simple, stacked or 100% stacked bar chart and can be displayed vertically or horizontally. The admin can also choose if the end user is able to adjust the settings for the chart.

Image 24 from What's New 26.4-2.docx

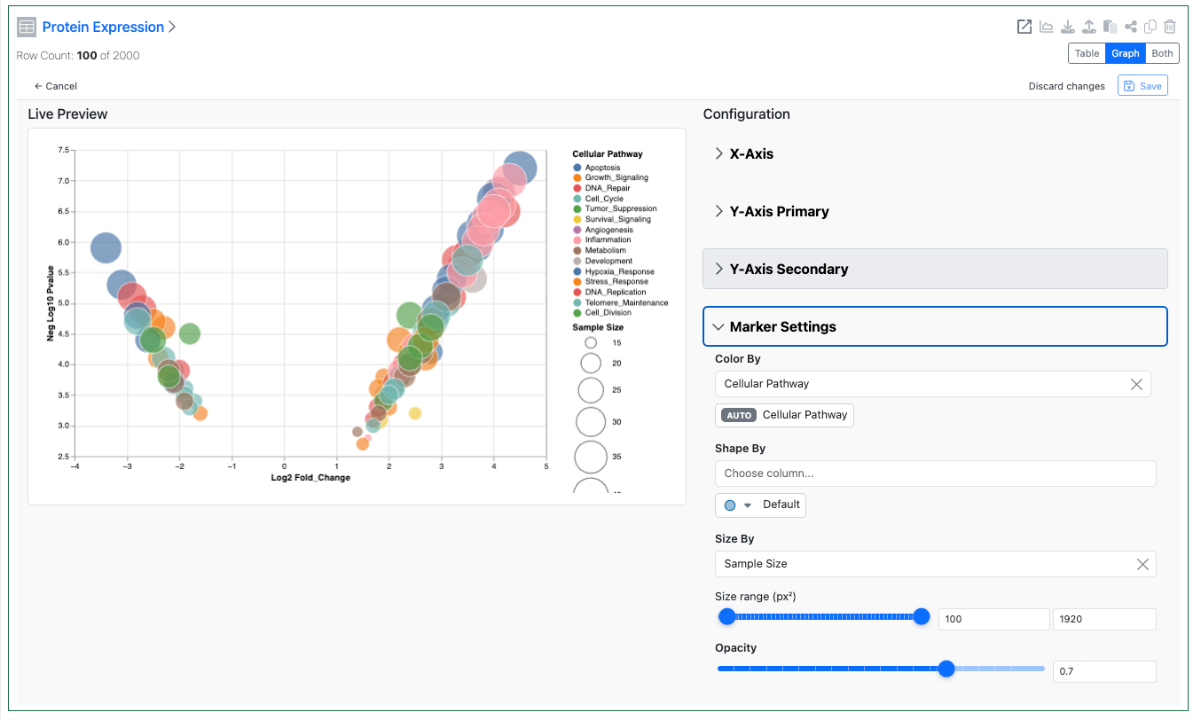
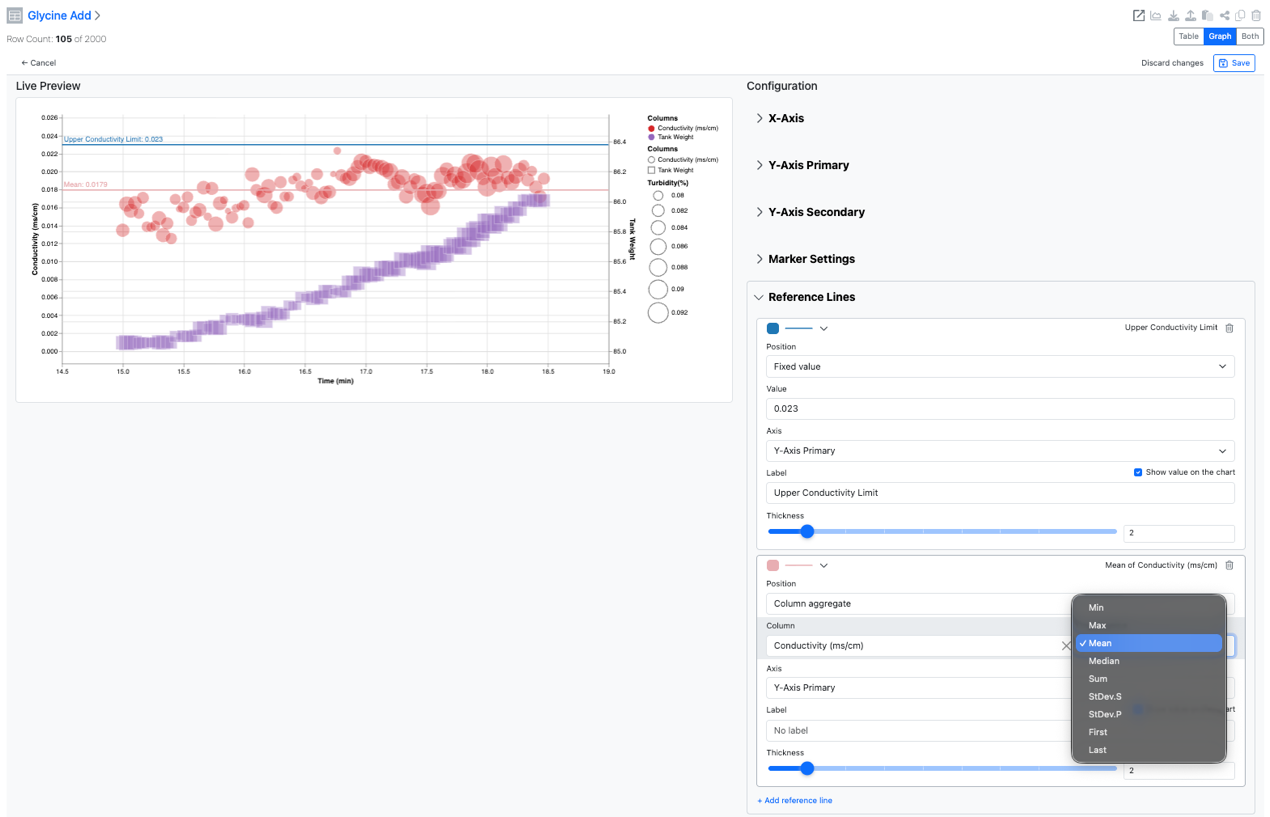
Configuration administrators can also now define a Size By and an Opacity setting for Scatter Charts. These two settings allow for the creation of Bubble Charts using the Scatter Chart type. If the end user is allowed to change chart settings these options are also available directly within the Admin Defined Table.

Inventory

Image 25 from What's New 26.4-2.docx

Users with the right permissions can now assign or reassign containers in cloned or pre-defined experiments, even after container details are cleared, enabling more flexible and accurate inventory workflows in Reagent table.

Image 26 from What's New 26.4-2.docx

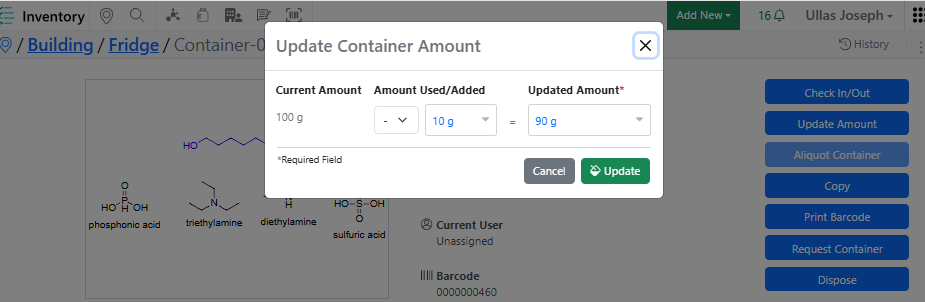
Inventory Decrement can now be entered at the sub‑experiment level, allowing users to accurately update container usage when working with parallel, cloned, or reagent‑specific sub‑experiments.

Image 27 from What's New 26.4-2.docx

Container details are now accessible from the Samples table even when a Material ID is provided, ensuring consistent visibility across sample workflows.

Image 28 from What's New 26.4-2.docx

Container multi‑select properties are now available in the Container table, allowing users to view multi‑select container properties directly from the inventory view.

InventoryGo

Image 29 from What's New 26.4-2.docx

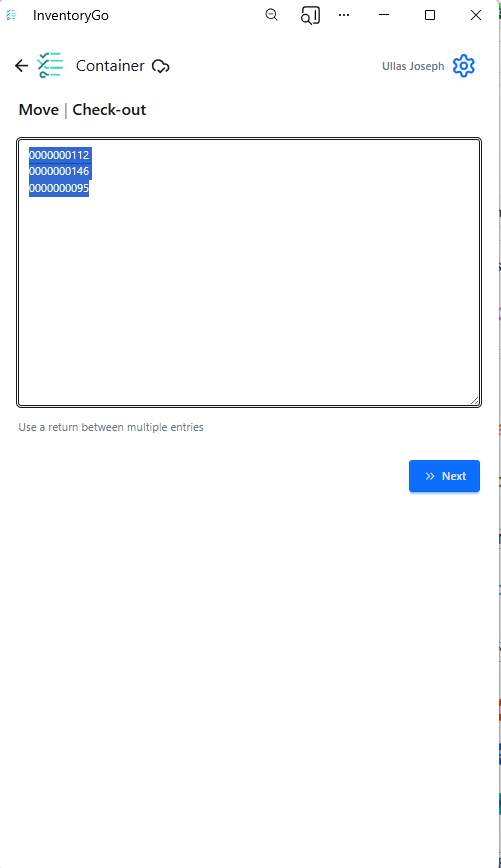
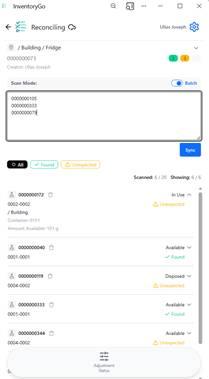
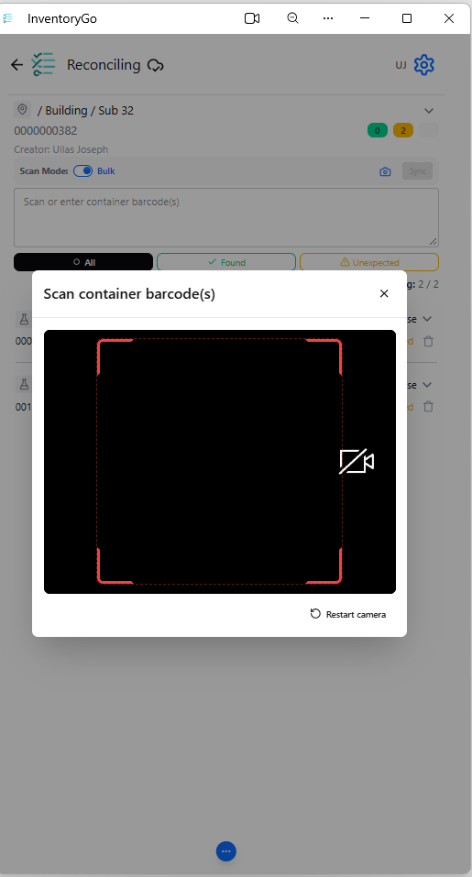
A new Scan List mode has been added to reconciliation, allowing users to scan containers in bulk and fetch results on demand, with a toggle to switch between batch and individual scanning for more reliable and faster workflows.

Administration

Image 30 from What's New 26.4-2.docx

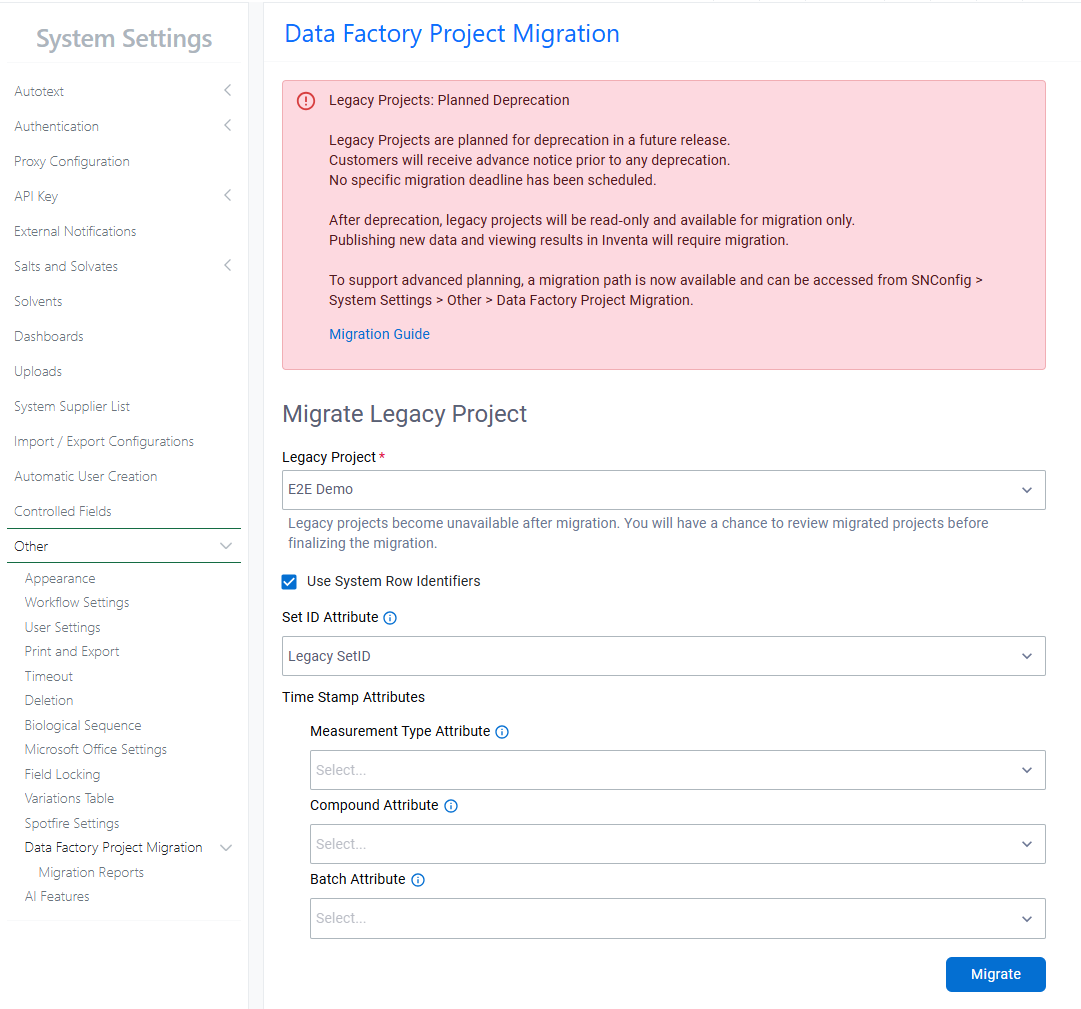
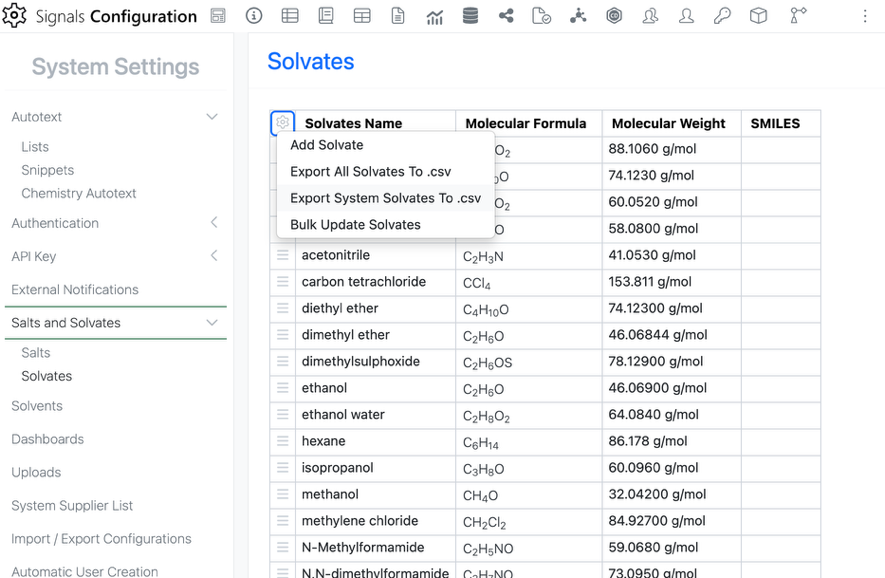
A migration path for legacy Data Factory projects is now available. Legacy Data Factory will be deprecated in a future release; administrators are encouraged to migrate to the latest Data Factory as soon as possible. The Legacy Project Migration tool is available from System Settings > Other. Before migrating, review the Migration Guide within the Signals Configuration Guide.

Image 31 from What's New 26.4-2.docx

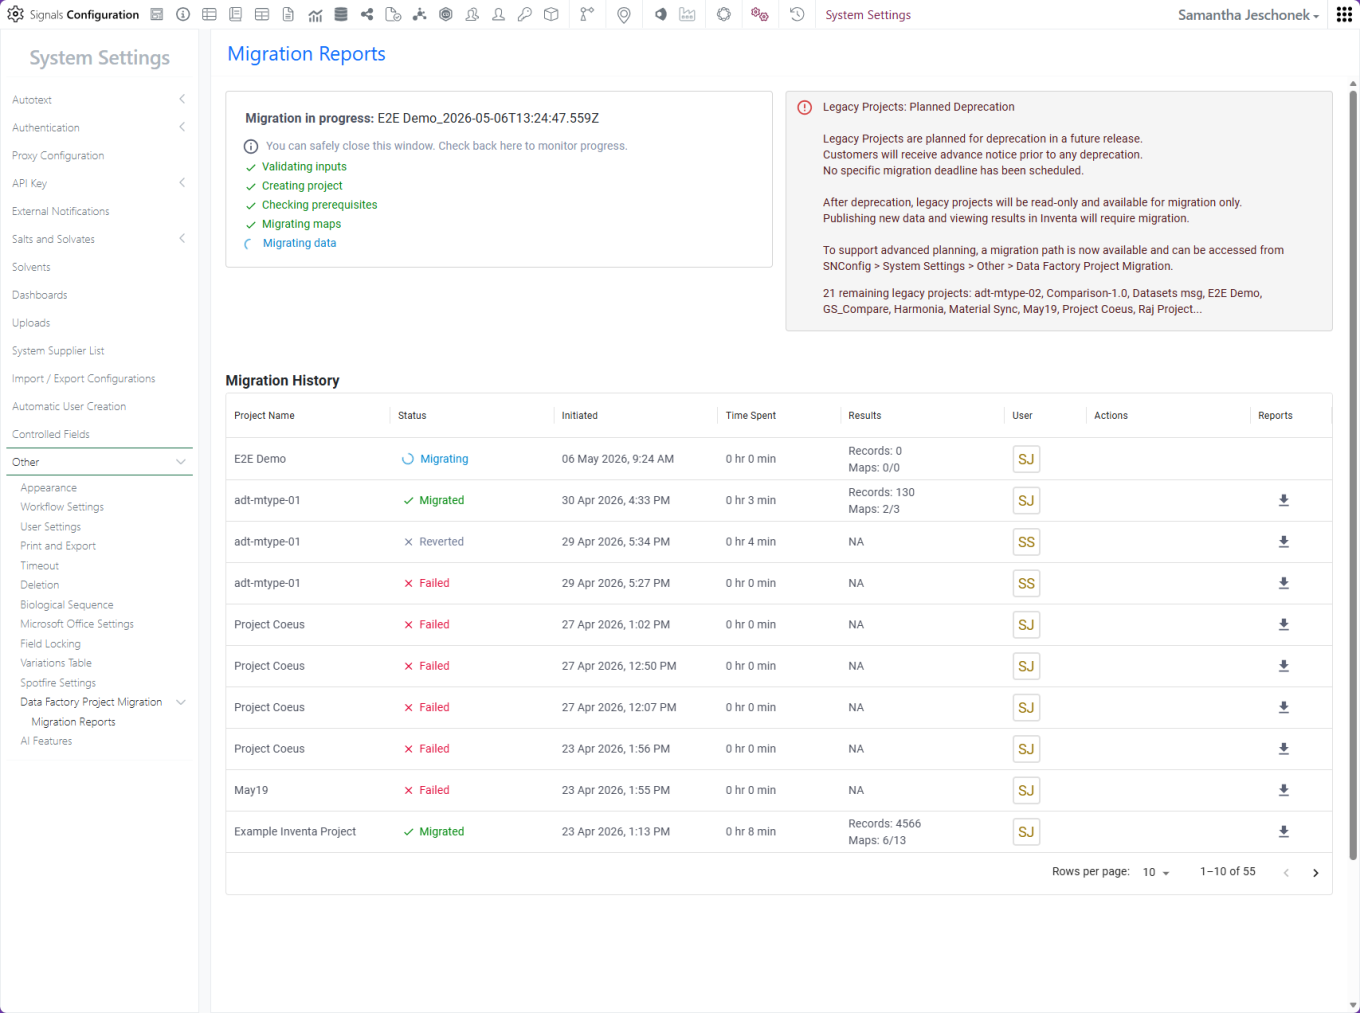
Migration status and history are captured in the Migration Report.

Image 32 from What's New 26.4-2.docx

After a successful migration, administrators can review the migrated project before committing the changes.

Image 33 from What's New 26.4-2.docx

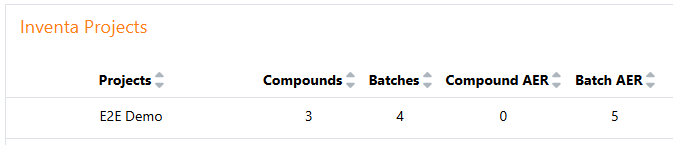
After you commit, the migrated project is ready to use and can be accessed from the Inventa Dashboard. The legacy project is no longer available for publication or data retrieval in Inventa.

Image 34 from What's New 26.4-2.docx
Image 35 from What's New 26.4-2.docx

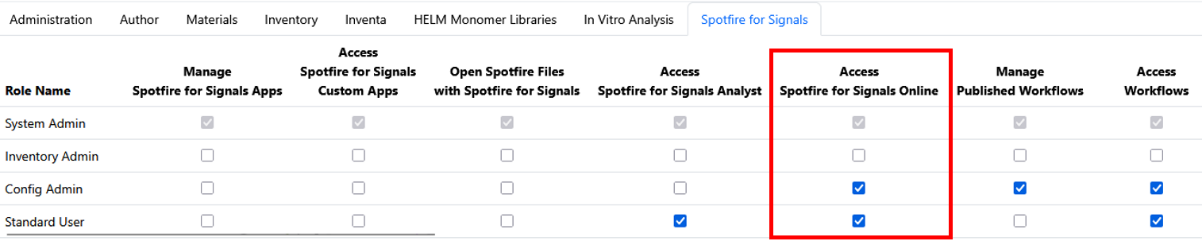
Spotfire for Signals Online Access privilege available to control which users can access and substantiate Spotfire for Signals Online. Users without this privilege will be limited to Spotfire for Signals Analyst use.

Image 36 from What's New 26.4-2.docx

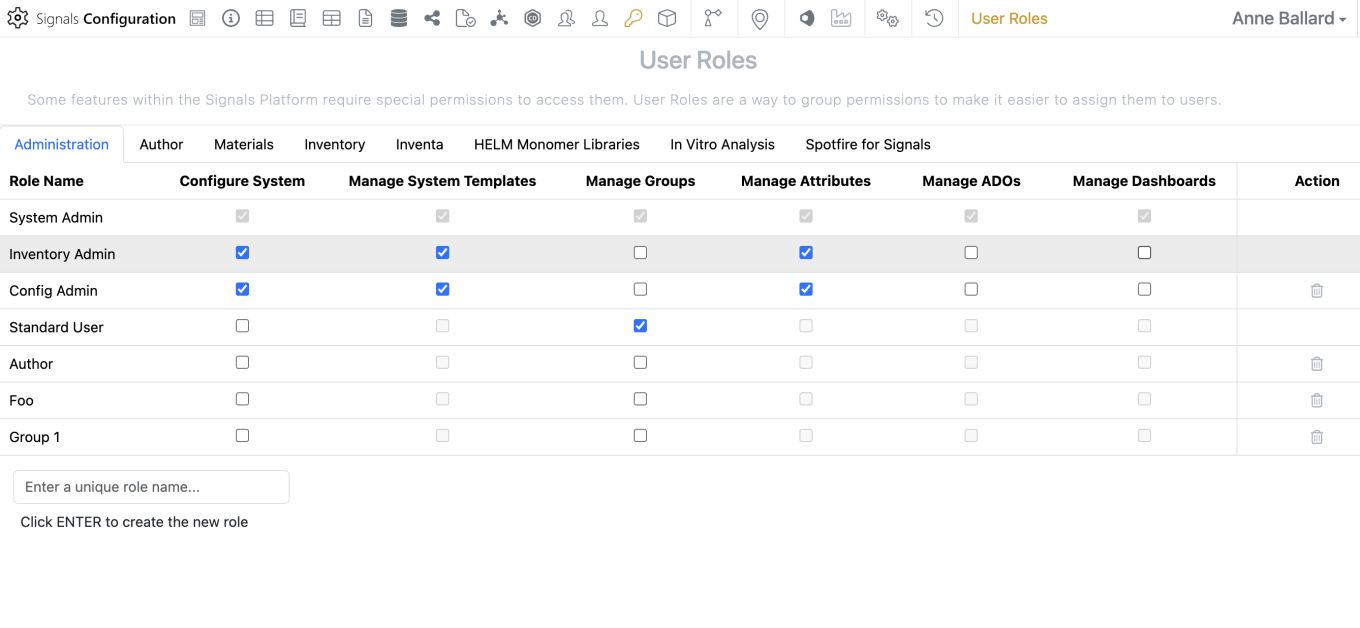
Administrators should now be able to create and share dashboards from the SN Config. To edit, share or create dashboards, a user must have the “Manage Dashboards” privilege and access to the SN Config as Admin Defined Dashboards can only be edited or created within the SN Config.

Image 37 from What's New 26.4-2.docx

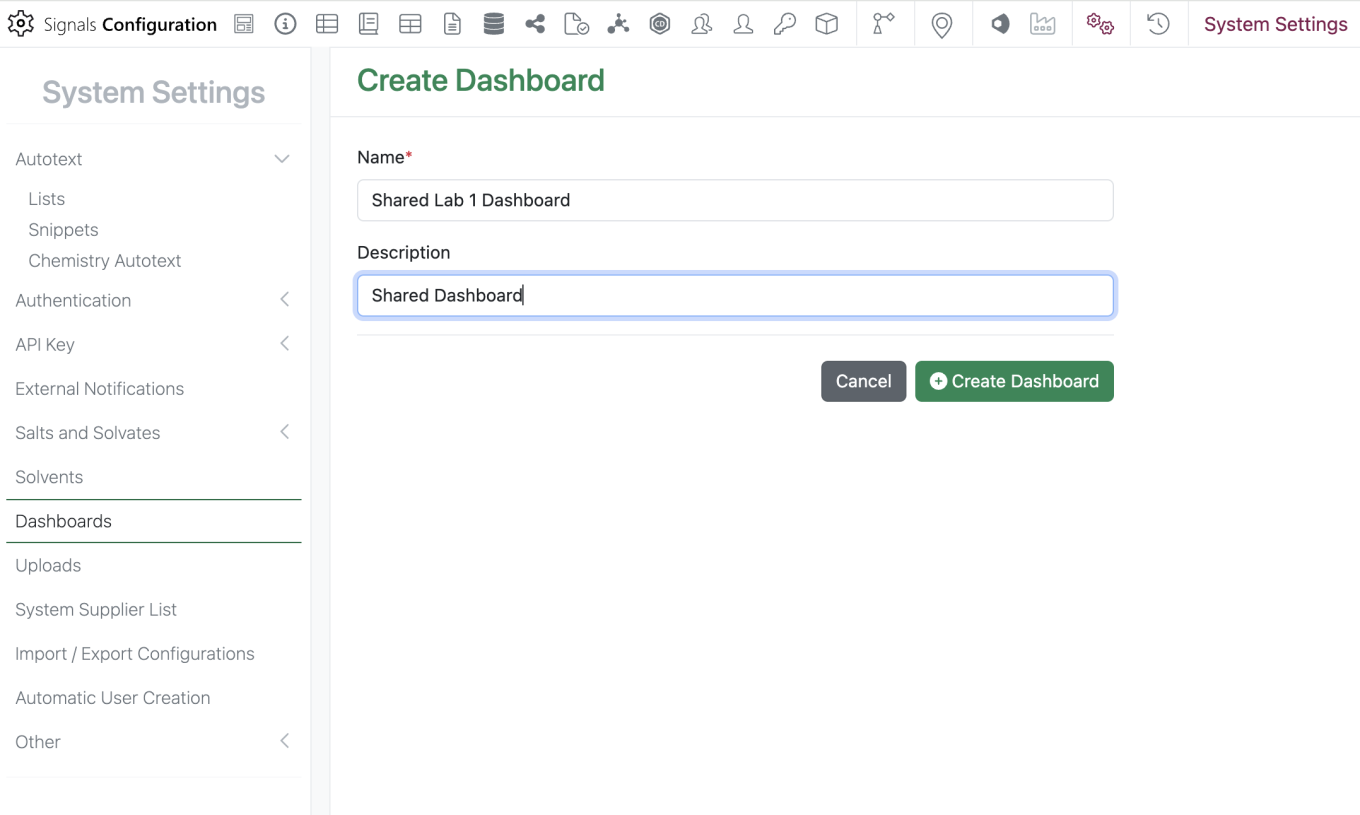
The new “Dashboards” section can be found in the System Settings. To create a dashboard, the admin should select the green “Create Dashboard” button then they are prompted to enter a dashboard name and description.

Image 38 from What's New 26.4-2.docx

When the admin clicks on “Create Dashboard” they will be brought to the Dashboard edit screen. Here they can add, remove, edit, or resize widgets similarly to what can be done with a personal Dashboard.

Image 39 from What's New 26.4-2.docx

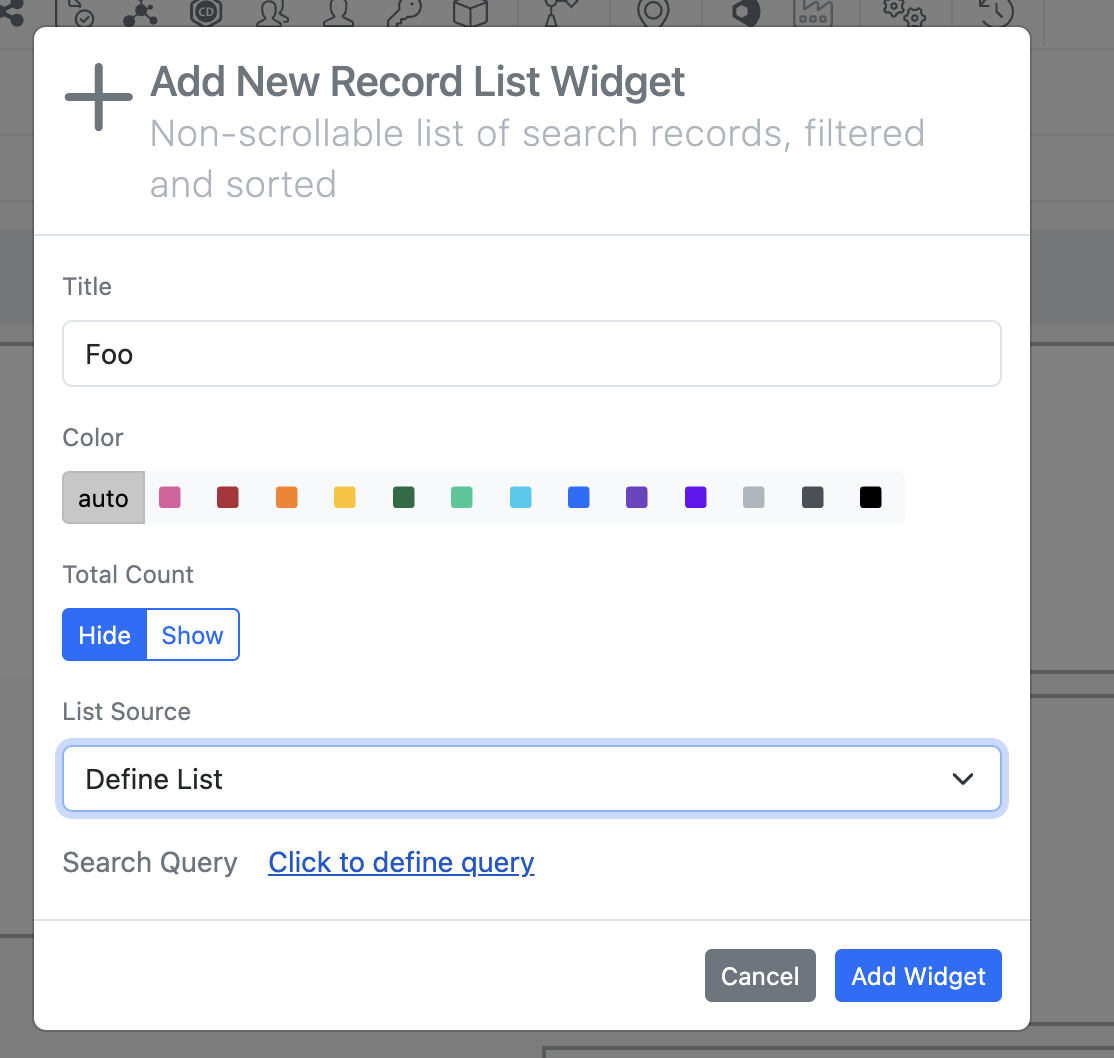
To add a new “Record List”, the most commonly utilized widget, the admin would select “Add Widget” > “Record List”. Under “List Source” the admin can select from a standard set of predefined lists or select “Define List” to create a new search list.

Image 40 from What's New 26.4-2.docx
Image 41 from What's New 26.4-2.docx

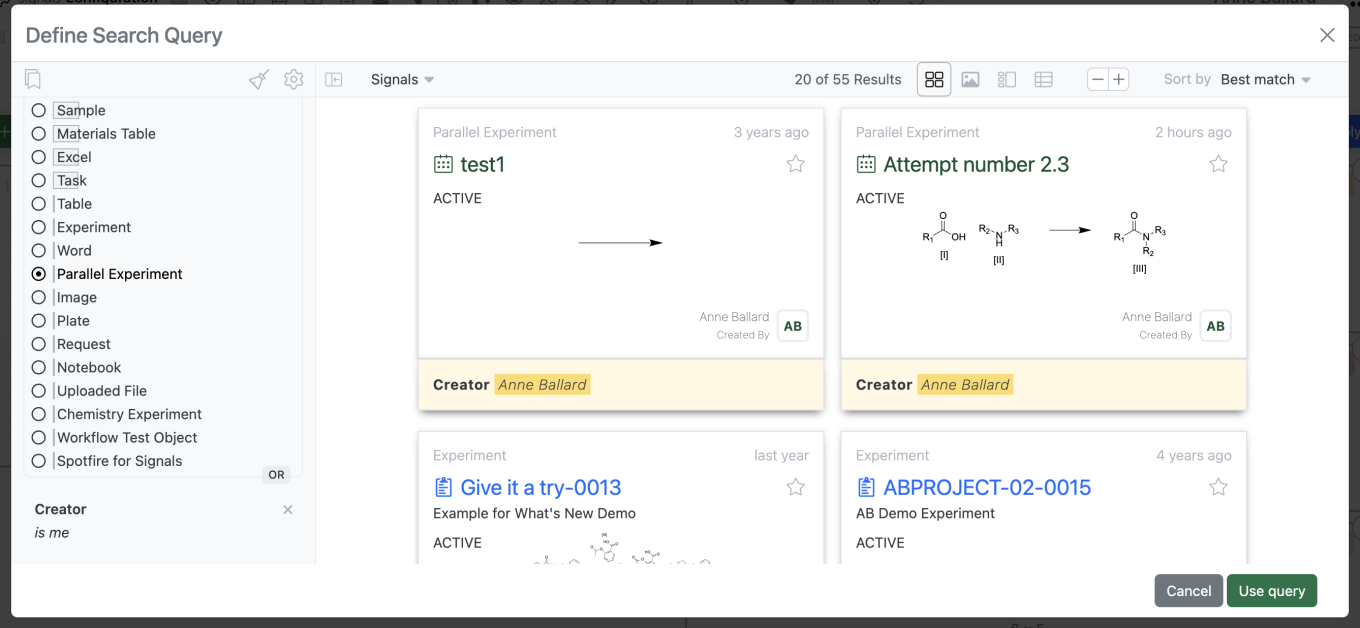
Selecting “Define List” > “Click to define query” brings up a search query builder the admin can utilize to define their search list.

Image 42 from What's New 26.4-2.docx

Changes to the selected dashboard are saved by selecting the blue “Apply” in the top right corner.

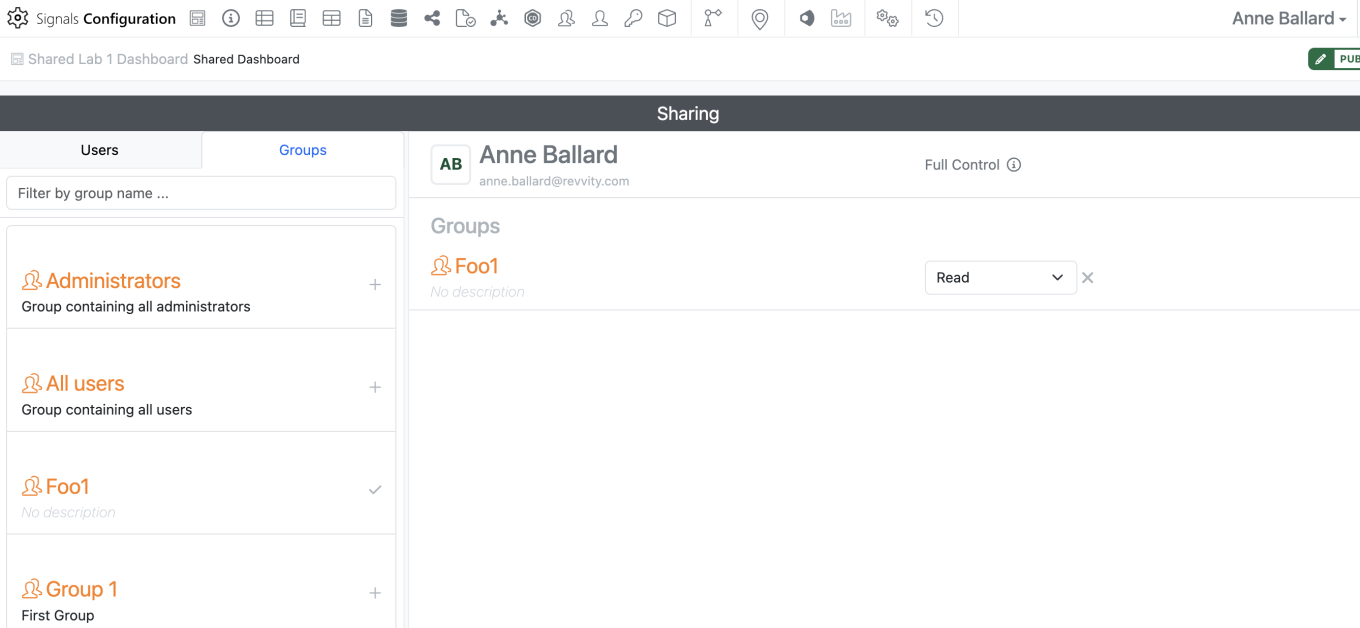
The admin can then share the dashboard with other users or groups similarly to how sharing is managed in other elements.

Image 43 from What's New 26.4-2.docx

Dashboards are automatically shared with Read access. If a dashboard is shared with write access or full control to a user or group that does not have access to the SN Config, they will be unable to edit or share the dashboard as shared dashboards are Read Only outside of the SN Config.

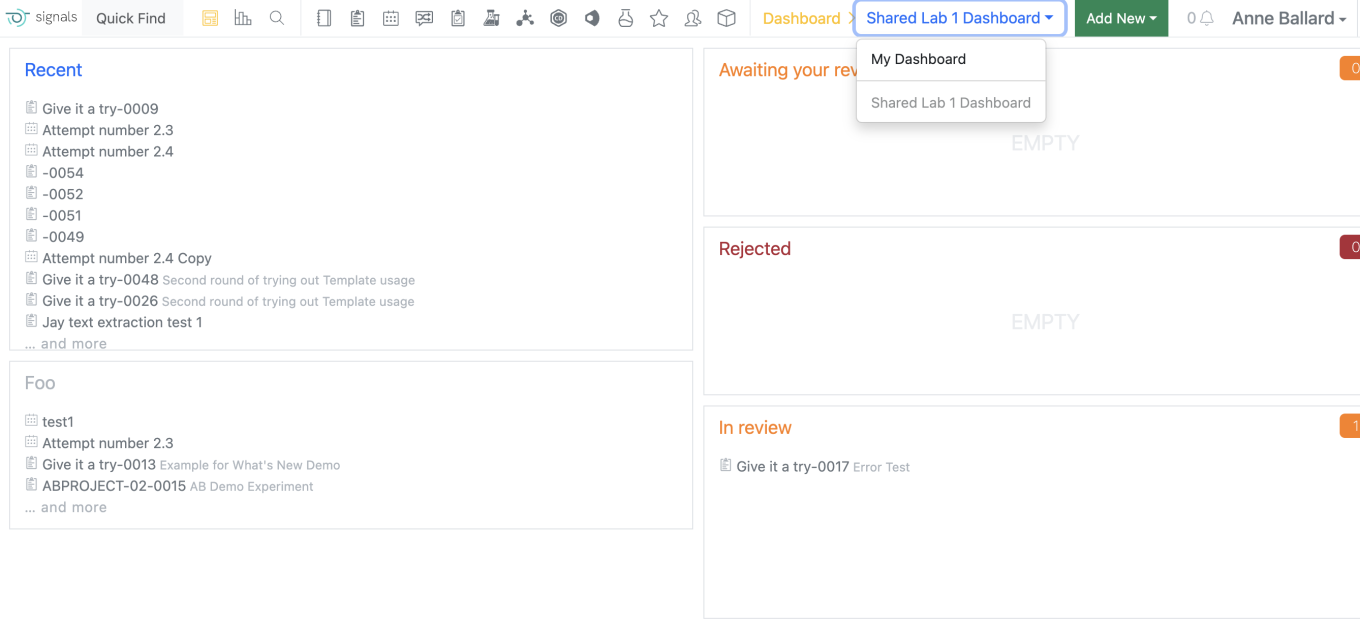
For end users, their current personal dashboard has now been named “My Dashboard” on the dashboard menu. Users are still able to edit their own “My Dashboard” as they were previously able to do. All shared dashboards appear below “My Dashboard”. If the user selects one of their shared dashboards this selection is sticky.

Integrations & APIs

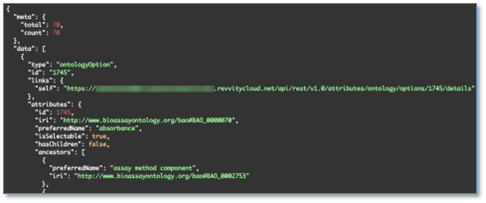
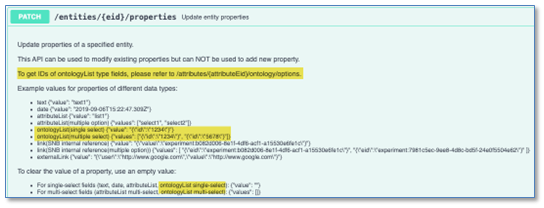
We have added API support for writing to Ontology List fields. These are enhancements to all APIs which write to entities that support Ontology List fields and properties. There are new APIs to fetch and explore Ontology Lists. The “id” values found here are used to set values on Ontology List fields and properties.

Image 45 from What's New 26.4-2.docx
Image 46 from What's New 26.4-2.docx
Image 47 from What's New 26.4-2.docx

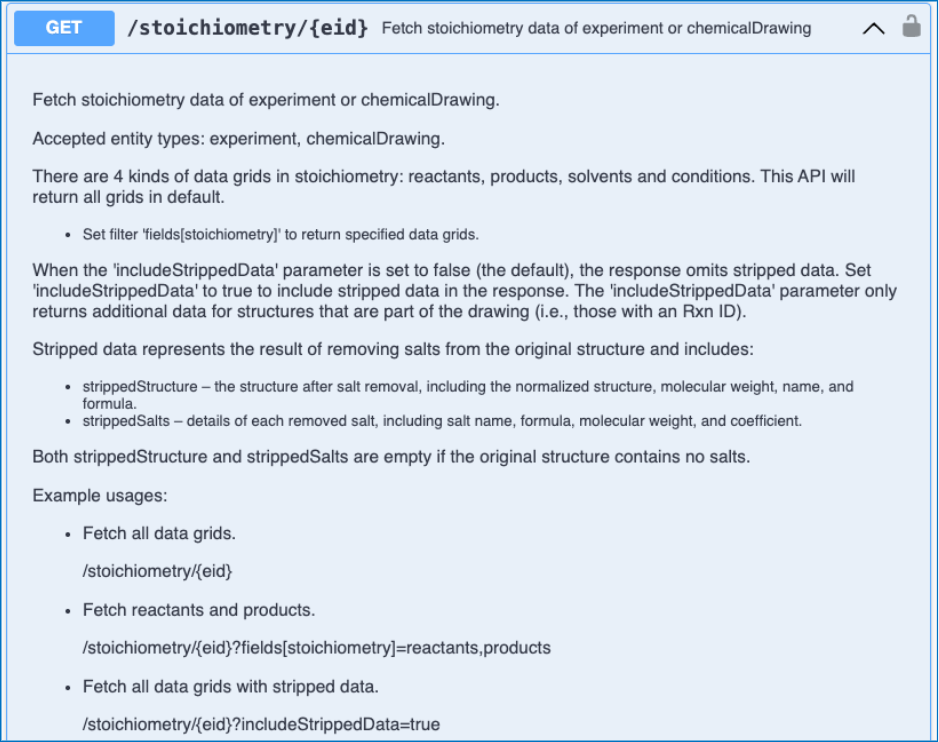
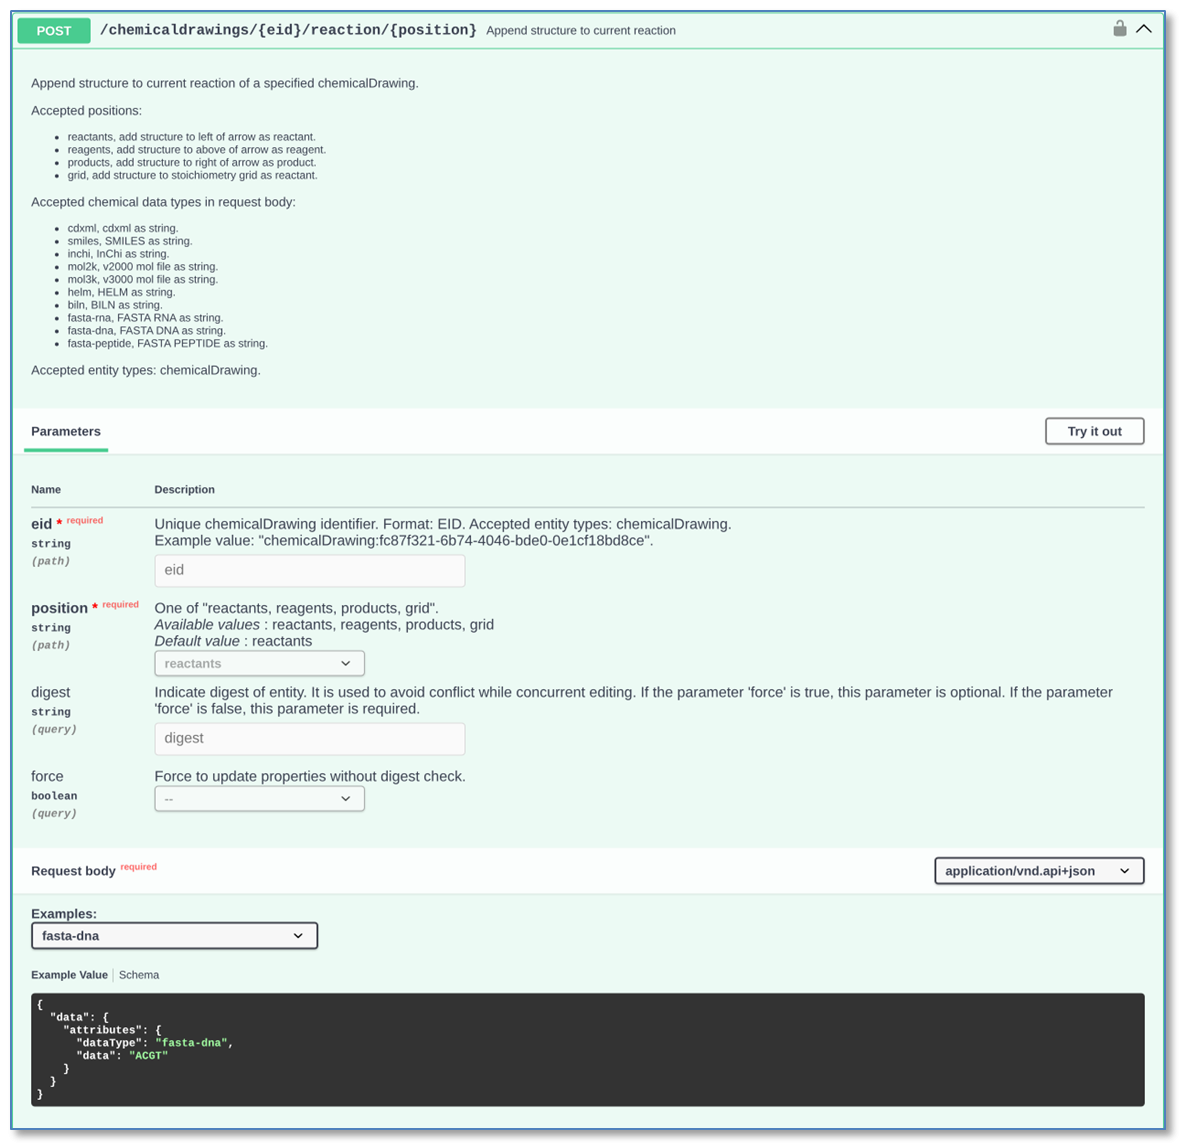
We have enhanced the stoichiometry fetch API to include salt stripping data for a Chemical Drawing. This is a new URL parameter (includeStrippedData) which when true will include the stripped structure and the salts that were stripped from the Chemical Drawing as data in the response.

Image 48 from What's New 26.4-2.docx

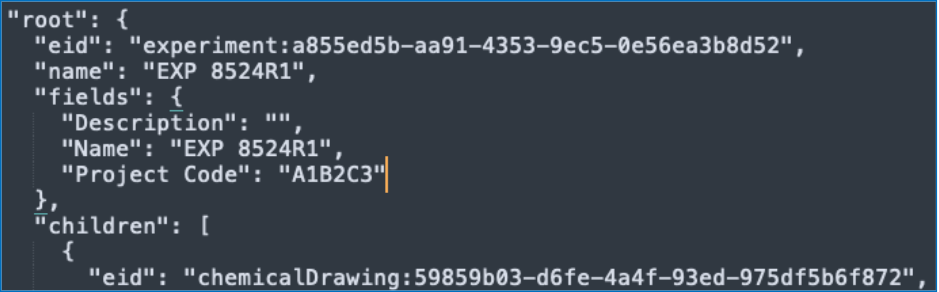
We have enhanced the API for bulk export of an entity to include the entities properties as part of the table of contents.

Image 49 from What's New 26.4-2.docx

We have added a new API to allow patching of Hierarchical Table headers.

Image 50 from What's New 26.4-2.docx

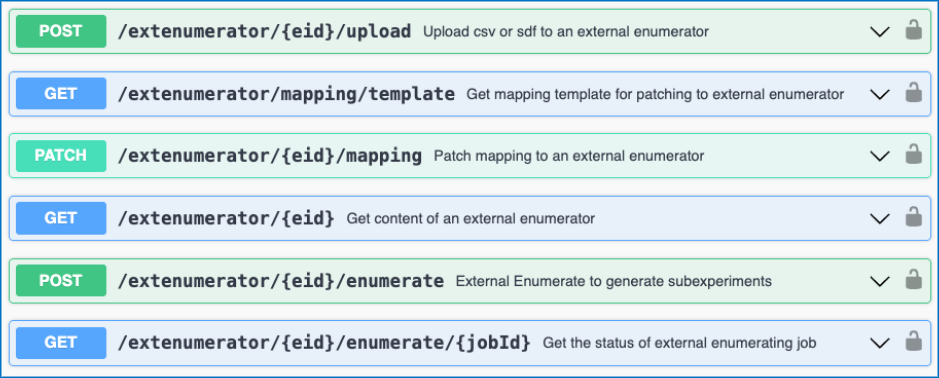
We have added new APIs to support the External Enumerator for Parallel Experiments. These APIs allow for usage of a csv or sdf file upload for use with the External Enumerator. There are APIs to fetch and update the mapping for the external enumerator. Lastly, there are APIs to kick off the enumeration and check its status.

Image 51 from What's New 26.4-2.docx

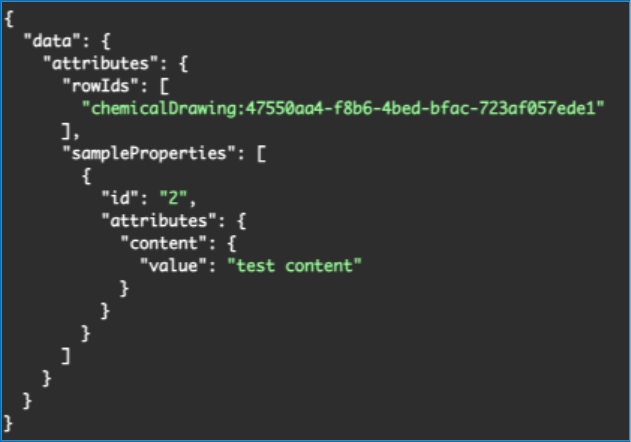
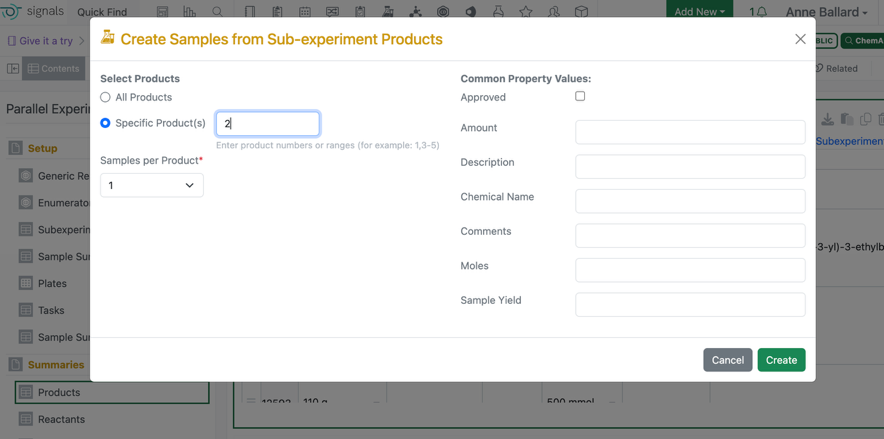
We have added new APIs to support the bulk creation of Samples in a Parallel Experiment Summary table. This is an asynchronous job which has two endpoints, first to create the job and second to check the status. There is a URL parameter to support creating multiple samples per row. The request body allows for specifying specific rowIds to create samples from, defaulting to all rows. You may also optionally specify sample properties for all samples created as part of the request body.

Image 52 from What's New 26.4-2.docx

Beta Features

The following capabilities are in beta and are available for users, administrators and developers on the Signals platform upon request. Please contact your account representative or our support team if you would like access to the following features.

Fundamentals

Image 53 from What's New 26.4-2.docx

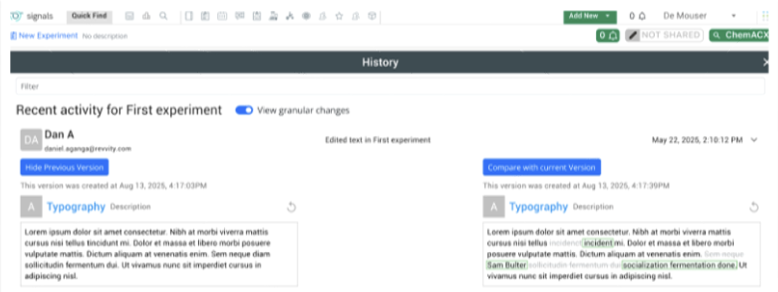
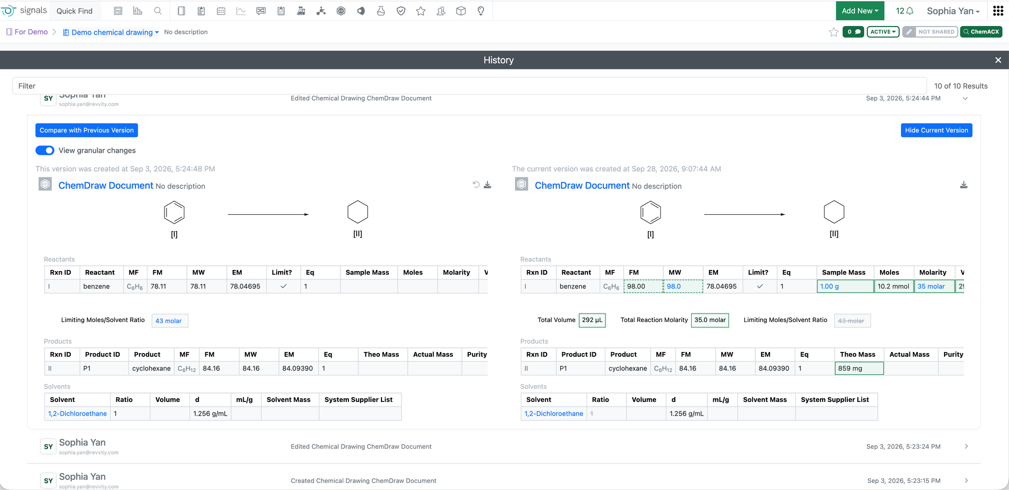
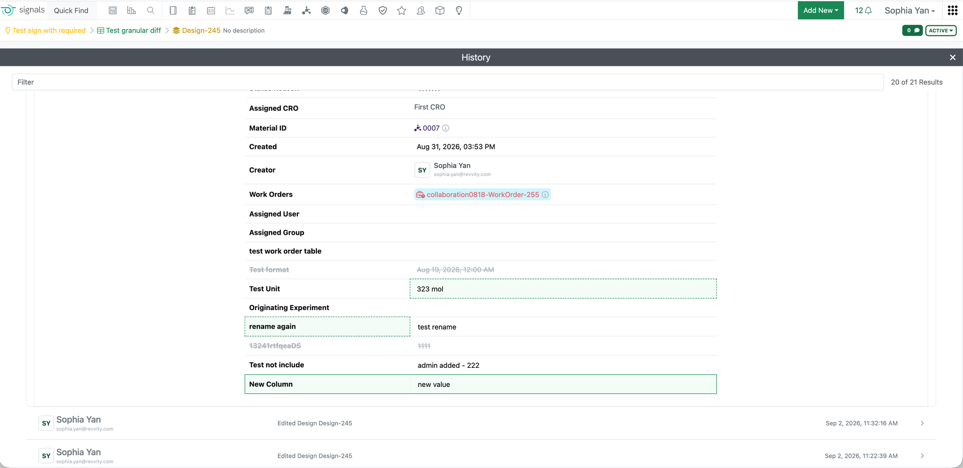
Audit trail displays highlighted granular changes within records for text elements in experiments and experiment-like objects. When users compare an audit record with a previous version, there is a "view granular changes" toggle. Selecting this toggle will show users a clear visual summary: gray highlighting shows text that was edited or removed and green highlighting shows newly added or updated text.

AI

Image 54 from What's New 26.4-2.docx

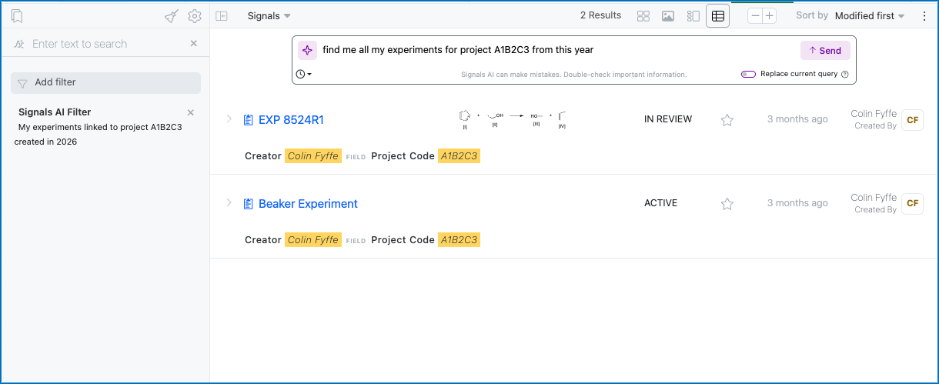
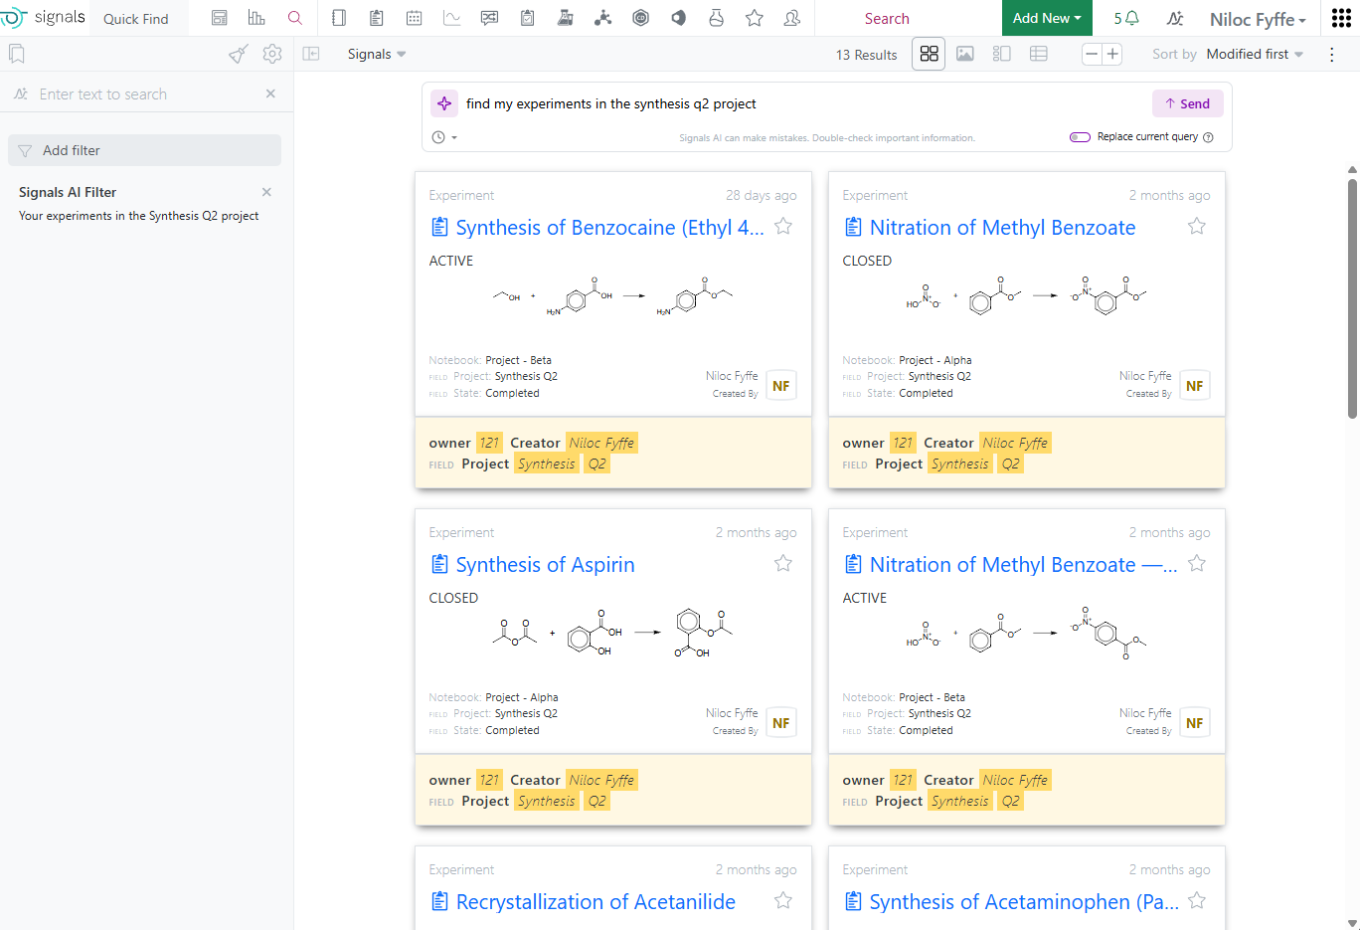
We have added a new Beta AI feature allowing a user in Advanced Search to create a filter using a natural language prompt. This filter will be added on top of your existing filters unless the toggle to replace your existing query is enabled. This is limited to Signals One customers.

Synergy

Image 55 from What's New 26.4-2.docx

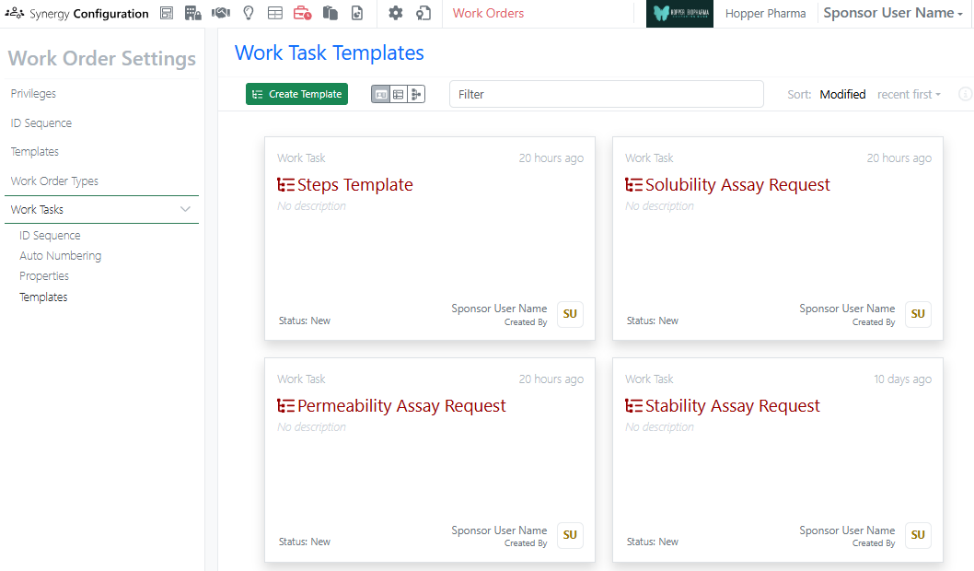
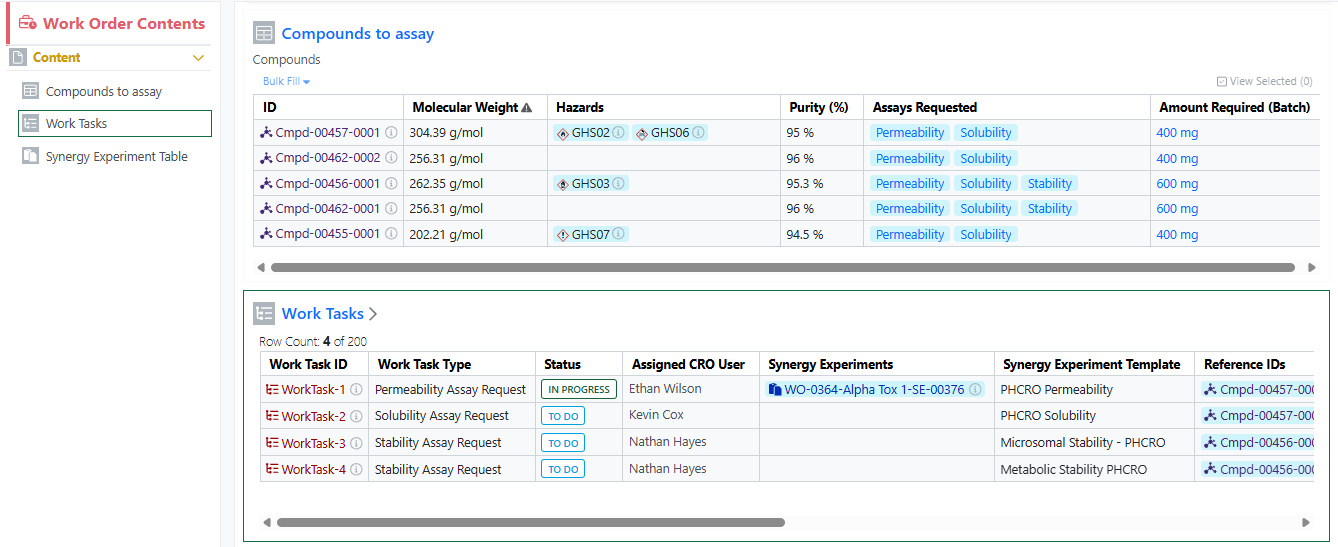
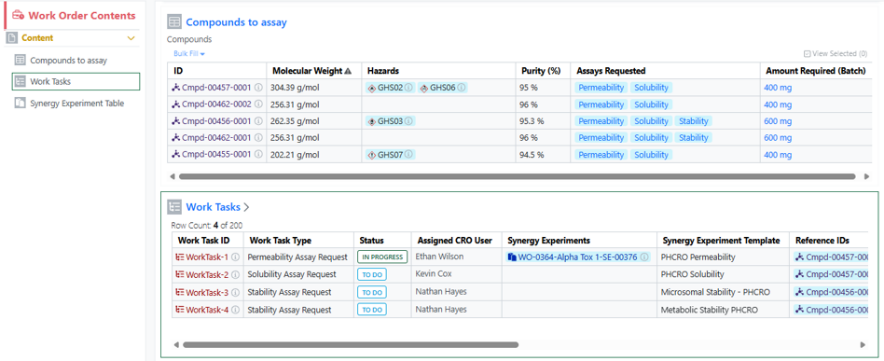
Works Tasks can now be configured and added to Work Orders to create a series of trackable, assignable, and templateable sub-tasks for a Work Order. Work Task properties and templates can be configured in Synergy Configuration > Work Orders > Work Tasks.

Image 56 from What's New 26.4-2.docx

A Sponsor user can add a Work Task to a Work Order when the Work Order is in an editable status (Draft, To Do, On Hold). The Sponsor can optionally specify a Synergy Experiment Template to be used for the Work Task, as well as specify which References the Work Task applies to.

Image 57 from What's New 26.4-2.docx

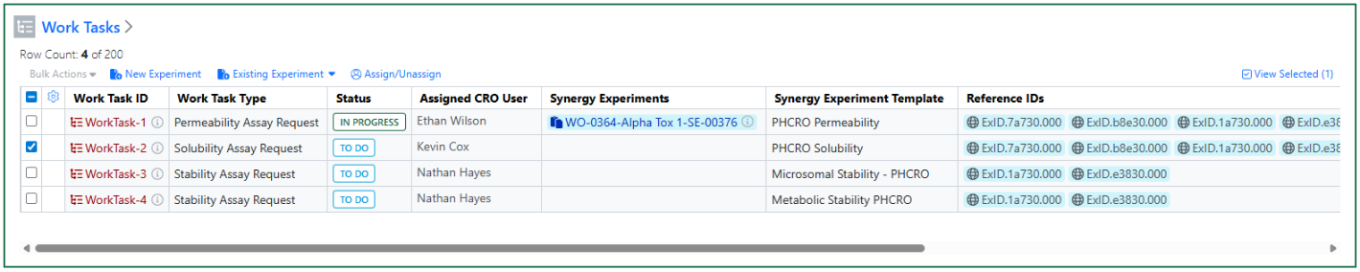
Once a Work Order is sent, Work Task(s) Status changes from New to To Do. A CRO Department manager can optionally assign the Work Task(s) to a CRO user. A CRO user can start one or more Work Tasks by selecting the Work Task(s) and creating a New Experiment or adding the Work Task to an Existing Experiment. The Work Task(s) Status then changes from To Do to In Progress.

Image 58 from What's New 26.4-2.docx

Note, when creating a New Experiment, the specified Synergy Experiment Template will be used when applicable. Also, each Work Task can have multiple Synergy Experiments associated, and additional Synergy Experiments can be added to an In Progress Work Task from the Work Task table in the Work Order.

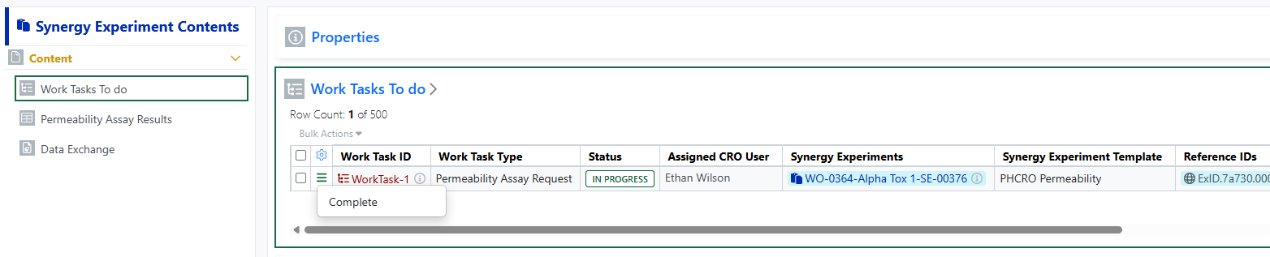
Work Tasks display in a Work Tasks To Do table in each associated Synergy Experiment. When the task is done, the CRO user can Complete the Work Task. Work Task(s) must be Completed before submitting the Synergy Experiment.

Administration

Image 59 from What's New 26.4-2.docx

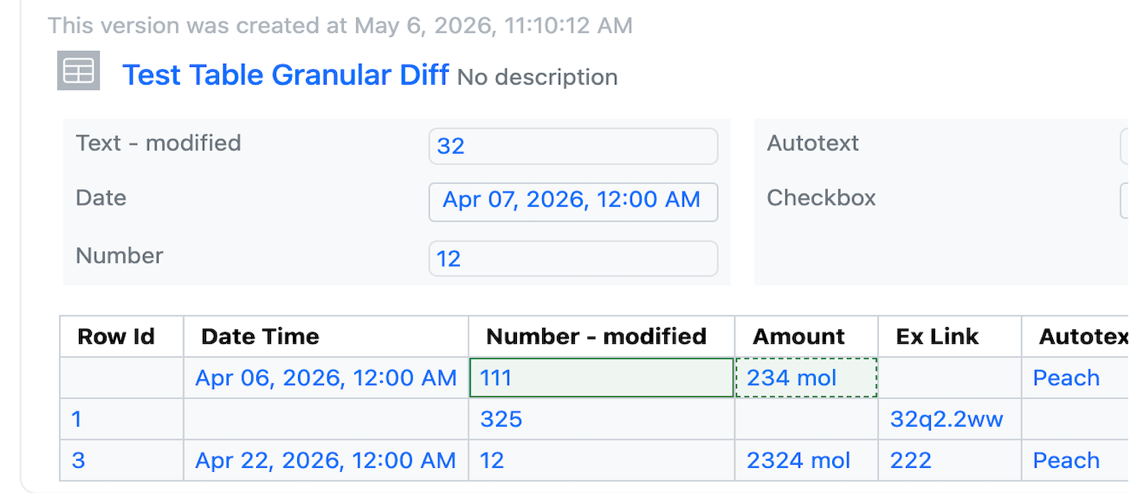
Audit trail displays highlighted granular changes within audit records for admin-defined tables. When admins or users compare a table audit record with a previous version, there is a "View granular changes" option. Selecting this toggle will show users a clear visual summary: gray highlighting shows data that was edited or removed and green highlighting surrounding table cells reflects newly added data. Green highlighting with a dashed border reflects text that was updated.

What's New

We are delighted to release our new version of Signals, 26.5.

The following improvements are available for users, administrators and developers on the Signals platform. Certain features may only be available with appropriate licensing and/or with enablement by an administrator.

  • Fundamentals
    - Publish ontology fields to Data Factory
    - Bookmarks in Smartfolders
    - Caching of Stoich grid data while Chemical drawing is in Edit mode
    - Addition of “Weeks” as an additional Unit in the Duration Measure
    - Bulk Register Materials from Samples Tables and Samples Summary Tables
    - Display warning message when cloning experiment based on a template user cannot access
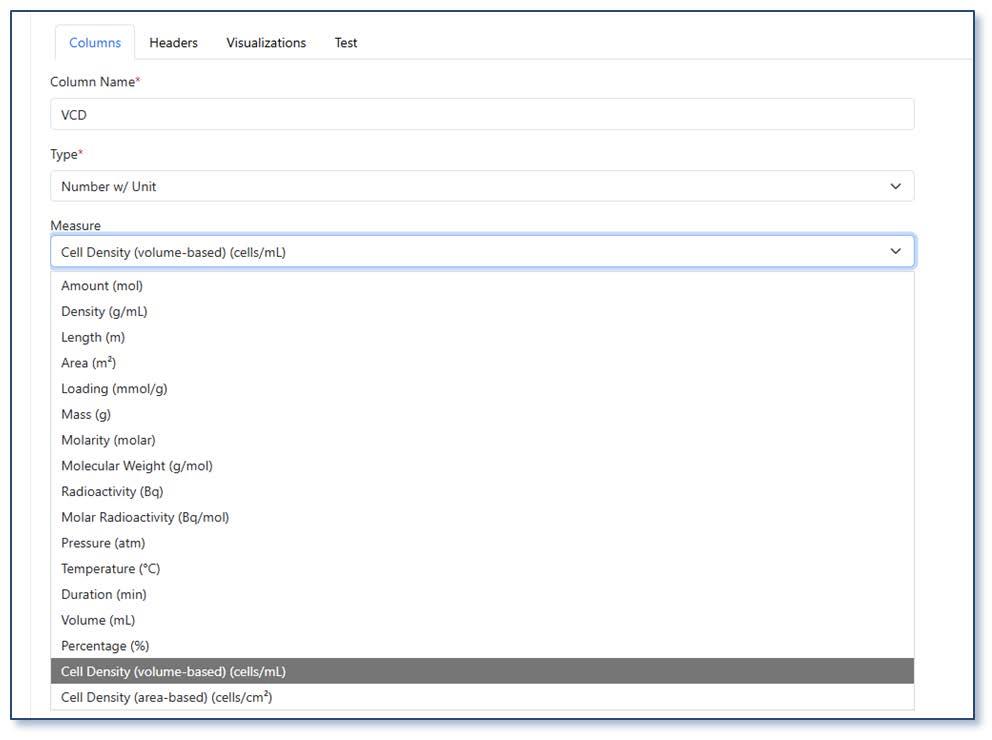
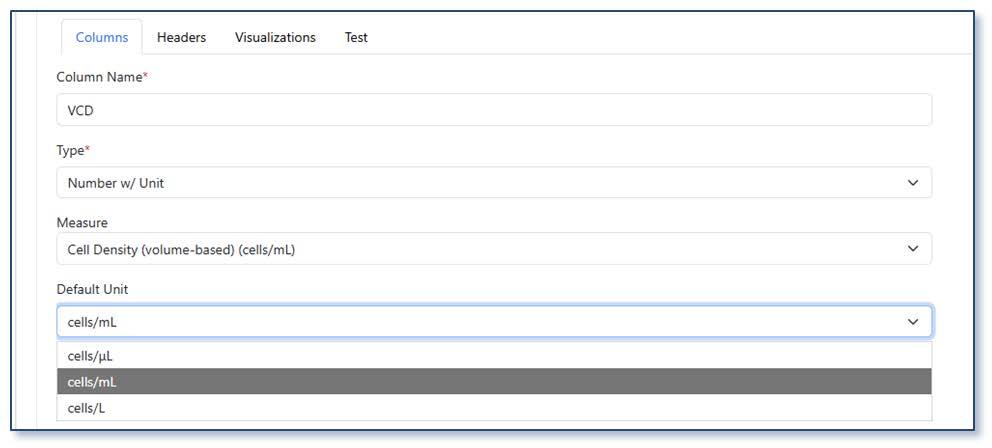
    - Addition of “Cell density (volume-based)” Measure with associated Units “cells/mL”, “cells/L”, and “cells/µL”
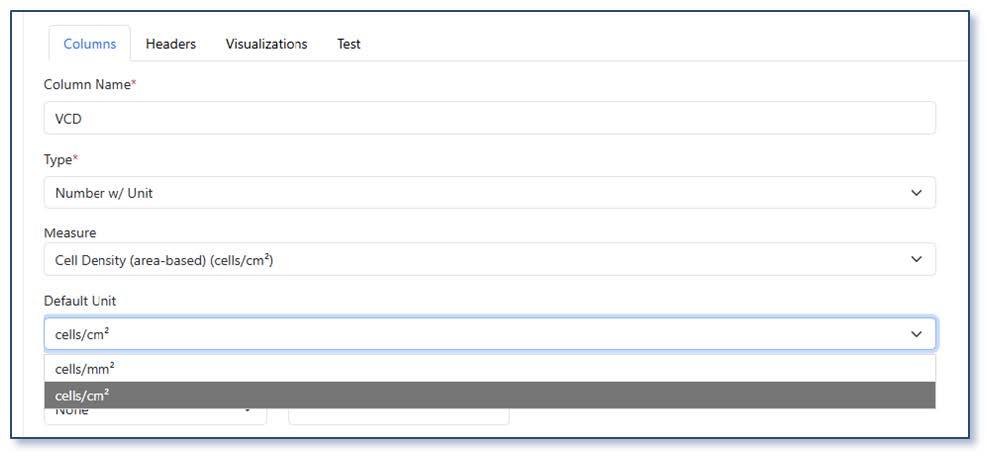
    - Addition of “Cell density (area-based)” Measure with associated Units “cells/cm²” and “cells/mm²”
  • Data Workflows & Analytics*
    - Additional Quality Control and Curve Fitting metrics
    - Publication of all Quality Control and Curve Fitting metrics
  • Synergy†
    - CRO users can now use CRO Advanced Search to reference items in internal fields
    - External actions on Work Orders
    - Sponsor Admin can bulk update CRO Departments for CRO users
    - Define default values, including Synergy Experiment Template, on Work Tasks Templates (beta)
  • Tables
    - Add a Container to an existing row in an Inventory enabled Admin Defined Table or Variation Table
    - Add a Container to an existing row in an Inventory enabled Hierarchical Table*
    - Line Charts on Admin Defined Tables*
    - Checkbox, Variable Measure and Variable Property can be used on the categorical axis of a Bar Chart on Admin Defined Tables*
  • BioDesign° 
    - Users can now register BioDesign Sequences in a Material Library and reference BioDesign Sequences
  • Inventory
    - Move containers out of grid locations during disposal directly from the container search table
    - Add container properties to the Reactants table
  • InventoryGo ‡
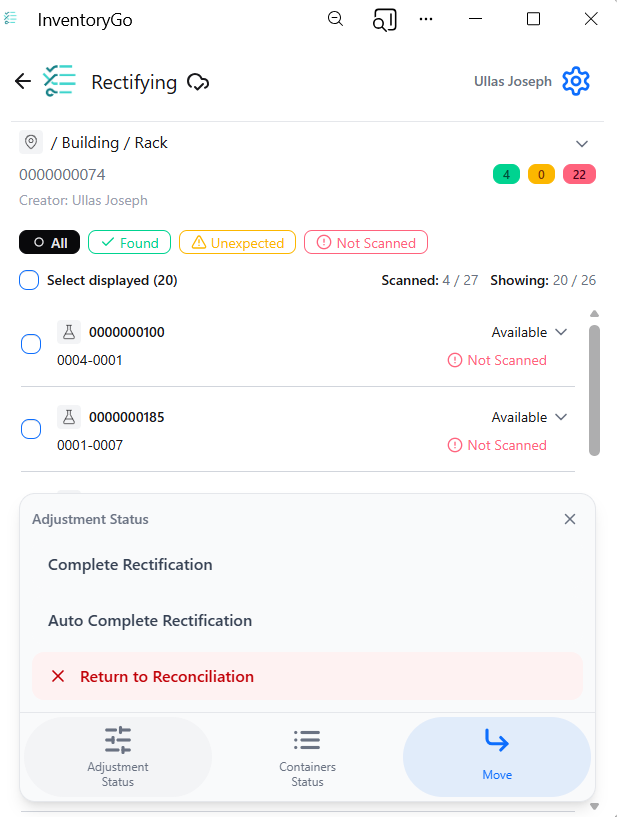
    - Enable Auto Complete Rectification in InventoryGo with configuration to move Not Scanned and Unexpected containers to an admin‑defined location
  • Materials
    - Additional calculated properties for protein complexes
    - UI update to material tables configuration (beta)
    - Mark fields as Read-Only in Materials
  • Administration
    - Use multiple headers with the SciBite CENtree External Ontology Source
    - Selective export for configuration migration (beta)
  • Integrations & APIs
    - Hide/Unhide columns API
    - Move Experiment to new Notebook API
    - Return from Archive API
    - Fetch Individual Material Libraries definitions API
    - Fetch all CRO users API
    - Additional CRO APIs for Chemical Drawings

* Requires Signals One license

† Requires Signals Synergy license

‡ Requires InventoryGo license

° Requires Signals BioDesign License

We also fixed several small bugs in this release. Details of the enhancements are described below.

The following OnDemand videos for Signals Synergy are now available:

  • Recording your Chemical Synthesis in Signals Synergy

Administrators should note that this release includes an upgrade to Spotfire® 14.6 LTS. Users will receive the updated version as part of the standard upgrade experience.

Developers should note the Materials API now includes the calculated property on a field definition only when its value is true. Previously it was inconsistently included (with value false) for admin-defined properties. Note that calculated is true only for certain system-default material properties, and not for admin-defined properties.

All CRO users in the assigned CRO Department can now Start a Work Order. This is a relaxed requirement, which previously required the assigned CRO user or CRO Department Manger to Start Work.

Administrators should note that we are planning to resolve an inconsistency in the way non global numbering currently works for Parallel Experiments, Requests, Inventa Analysis objects and In Vitro Analysis objects. These objects will now take the next number in sequence regardless of object type. The current behavior is that they take the next number in sequence for the given object type. This change will occur in a future release.

Data Factory Administrators should note that legacy Data Factory projects will be fully deprecated in a future release. A straightforward migration path is now available to support this transition. A specific deadline has not yet been scheduled.

Data Factory administrators should also note that the Advanced Security policies in Inventa apply an “AND” logic across all user groups, restricting access if any groups lack permissions. This behavior differs from the standard Signals security model and will be fixed to align with the standard in a future release.

Administrators are recommended to subscribe to the channels within our support news site found at https://support.revvitysignals.com/hc/en-us/categories/360004446171-Support-News which contains more information about releases and other pertinent product information.

This content is anticipated for release on our Production E3 environments, and for Private Cloud customers on our deferred release schedule, in November 2026.

Further Details

The following improvements are available for users, administrators and developers on the Signals platform. Certain features may only be available with appropriate licensing and/or with enablement by an administrator.

Fundamentals
Image 1 from What's New 26.5.docx

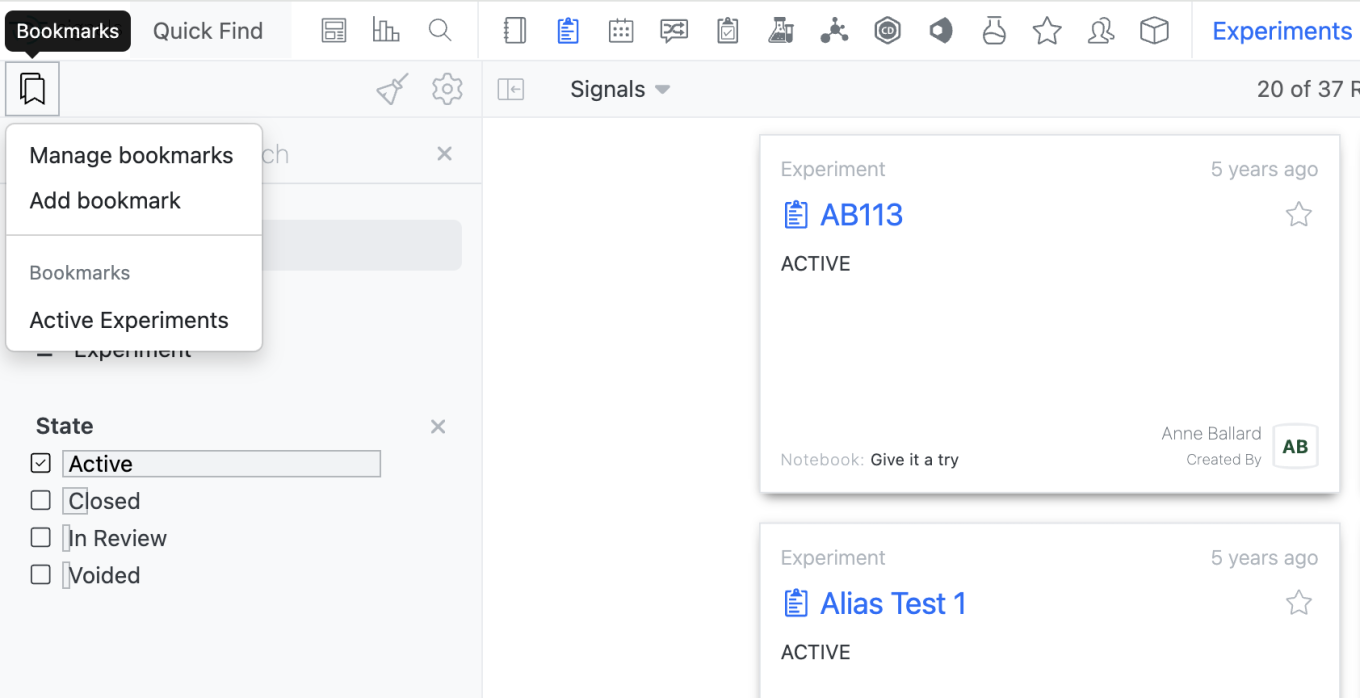
Users will now be able to save bookmarks in Smarfolders as they are able to do in Advanced Search. Is a Smartfolder, a user can add a Bookmark by selecting the Bookmark Icon in the left corner. Only bookmarks made within the given Smarfolder will be usable within that Smartfolder.

Image 2 from What's New 26.5.docx

All bookmarks can be utilized in Advanced Search.

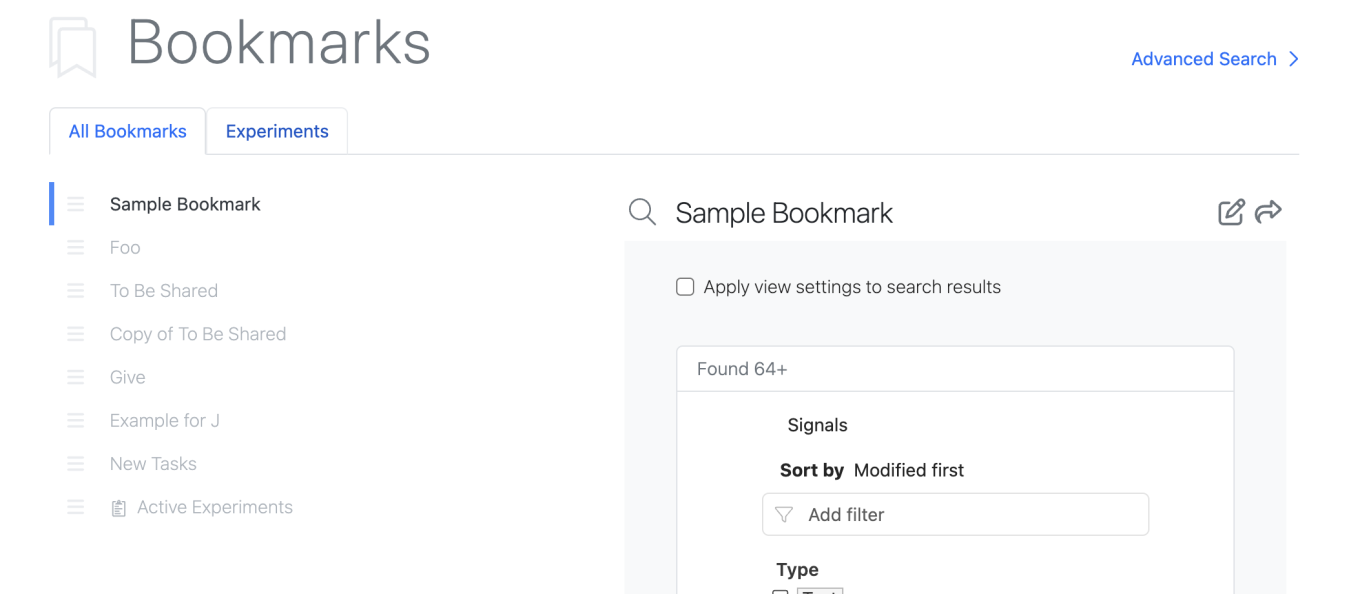
The Manage Bookmarks page also reflects the bookmarks available in the Smartfolders.

Image 3 from What's New 26.5.docx

Smartfolders with saved Bookmarks will appear at the top with a tab allowing the user to view bookmarks for that Smartfolder only. Additionally, Smartfolder specific bookmarks are identified with the entity icon in the All Bookmarks list.

In the Chemical Drawing, user entered data in the stoich grid will now be cached as the user is editing the chemical drawing so structures that leave the reaction perception do not lose user entered stoich data. Previously if a structure left the reaction perception or was reordered, user entered data would be cleared.

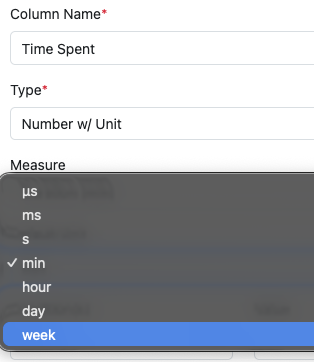
The Number with Unit Measure Duration now supports “week” as an additional Unit.

Image 4 from What's New 26.5.docx

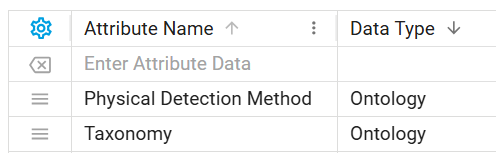
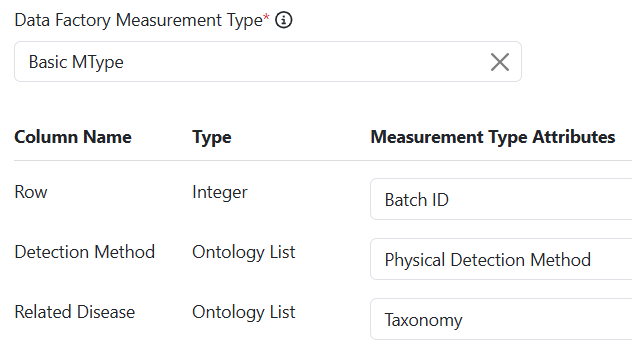
Ontology fields are now supported in Data Factory publication. Data Factory administrators can create ontology-type attributes and use them in publication maps for Signals objects (tables, experiments, materials, and more).

Image 5 from What's New 26.5.docx
Image 6 from What's New 26.5.docx

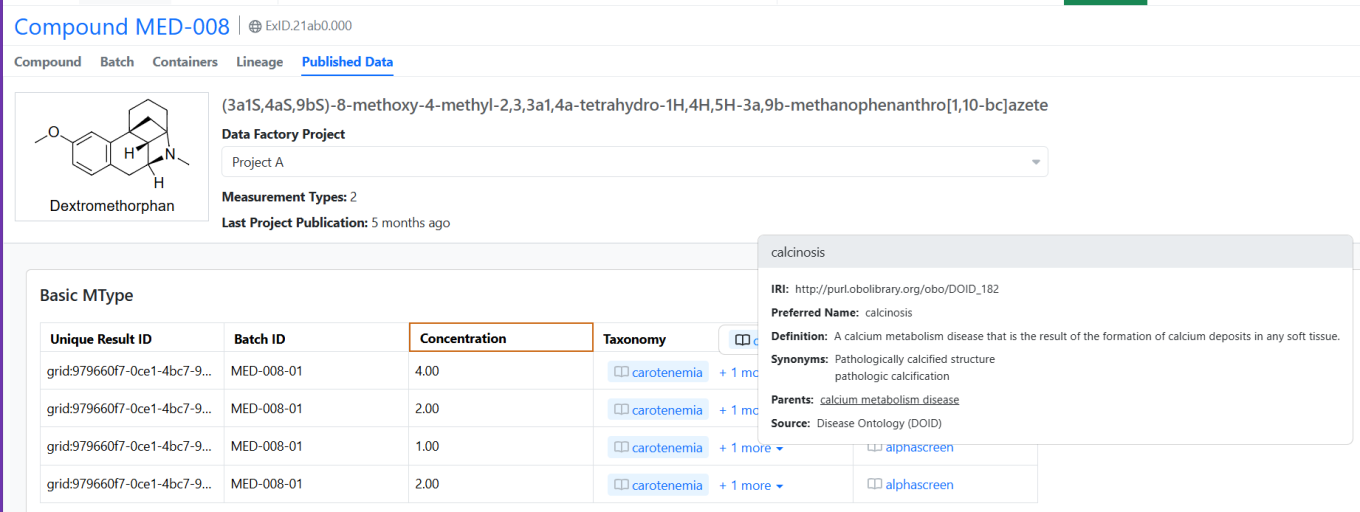
Published terms retain their ontology context in Signals, displaying an ontology indicator with interactive hover details for each term. In Spotfire applications, ontology terms are rendered as plain text.

Image 7 from What's New 26.5.docx

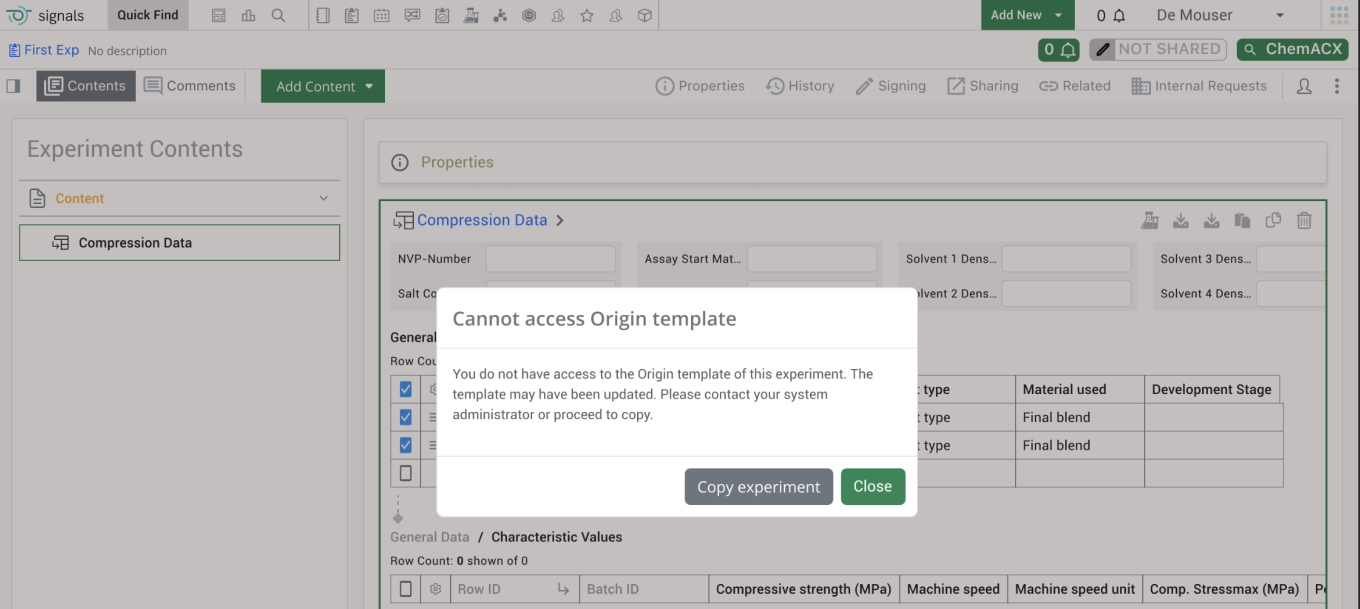
End users will see a warning message when they are cloning an experiment that is based on a template that the end user cannot access. The warning message will alert the end user that they do not have access to the origin template associated with the experiment and the template may have been updated. It also encourages end users to reach out to their administrator to update their access to the template.

Image 8 from What's New 26.5.docx
Image 9 from What's New 26.5.docx

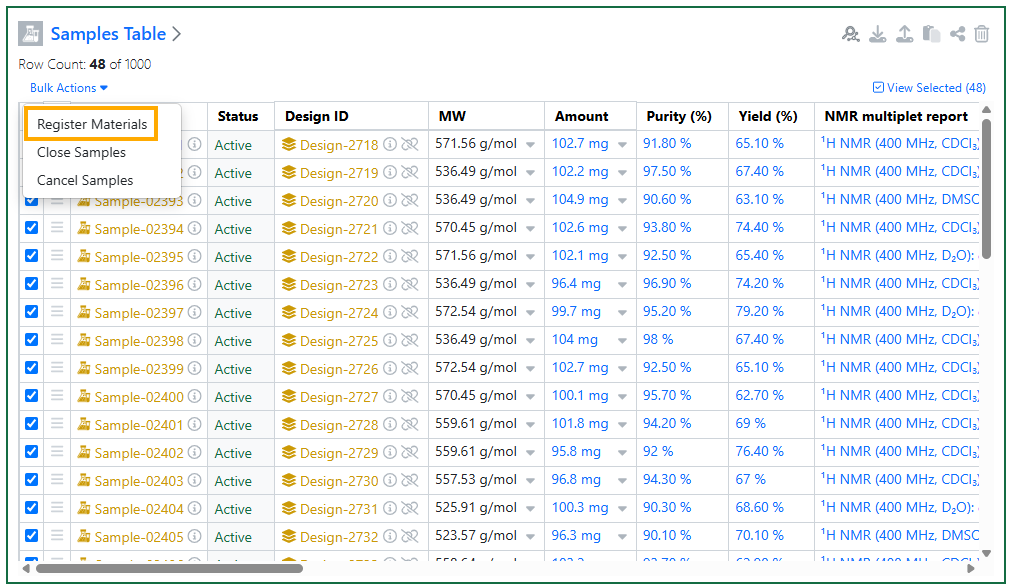
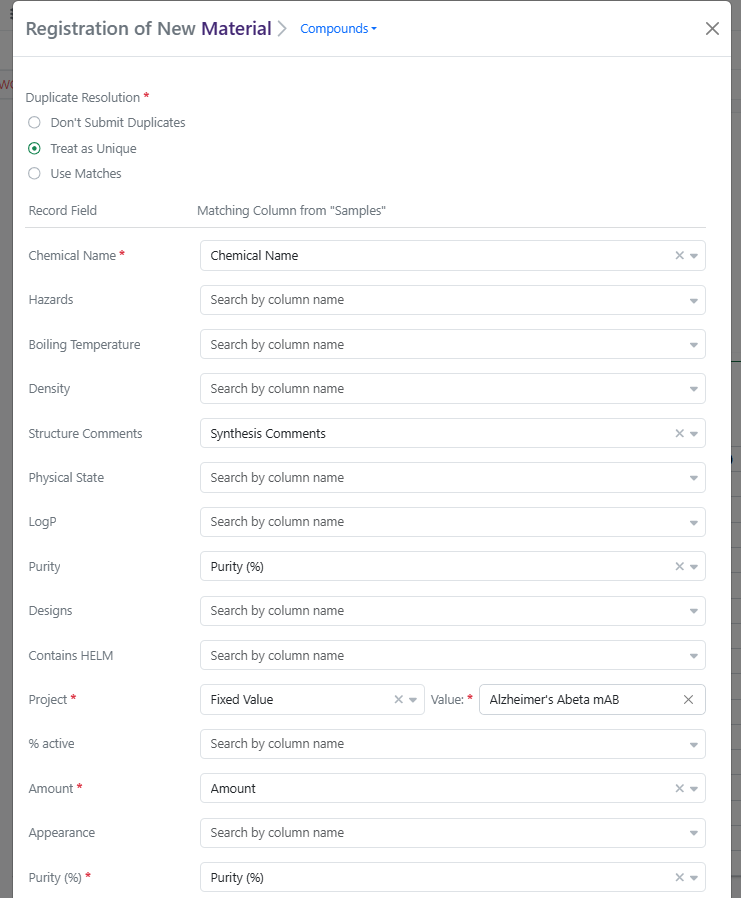
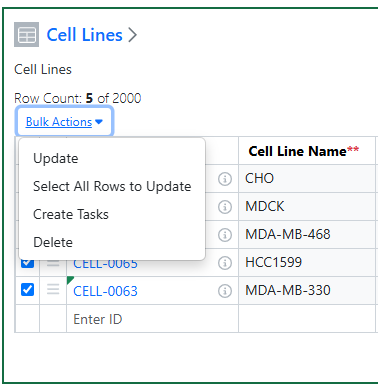
Finally, users can now bulk Register Materials from Samples Tables and from Samples Summary Tables. This feature applies to Experiments, Synergy Experiments, admin-defined custom Objects, and Parallel Experiments. When one or more Active Chemical Samples are selected in a Samples Table, the user can select Bulk Actions > Register Materials. Register Materials will open a modal where the user can select a Compounds or Normalized Compound library and then map Samples columns to Material Record Fields, with an option to apply Fixed Values to all Samples where applicable. (Note: Default mapping of Samples fields to Material fields can be configured by the administrator in Signals Configuration > Materials > Compounds (or other library) > Sample Mapping.) Clicking Register Compounds will start bulk registration, during which the Samples Table will be locked. Any errors with registration will be displayed on the table after registration completes. For tenants with Synergy, if a Sample is related to a Design ID, registration will capture the Originating Design on the Material and update the Design to Synthesis Complete.

Two new cell density measures have been added: "Cell density (volume-based)" and "Cell density (area-based)". Users can now capture cell density using common units including "cells/mL", "cells/L", "cells/uL", "cells/cm?", and "cells/mm?", with support for unit conversion, calculations, and search throughout Signals, excluding Stoichiometry tables and Collections System objects.

Synergy

Image 10 from What's New 26.5.docx
Image 11 from What's New 26.5.docx
Image 12 from What's New 26.5.docx

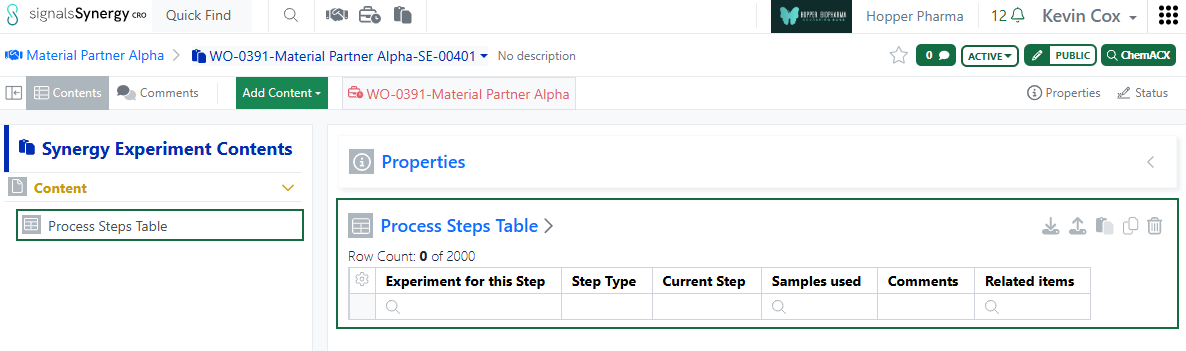
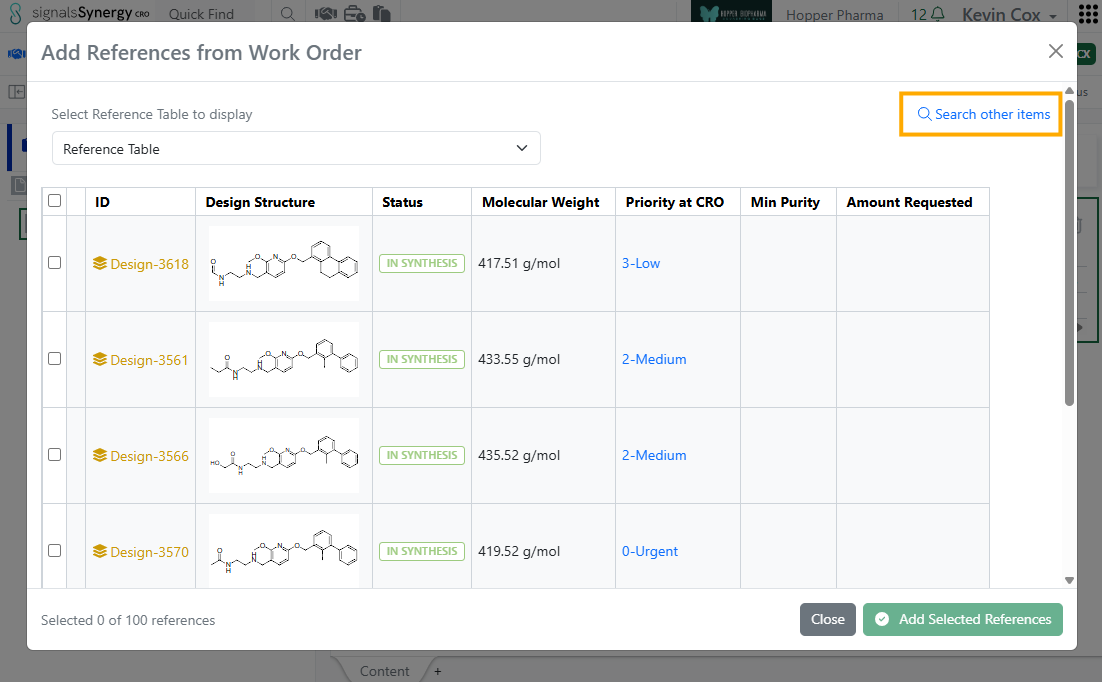
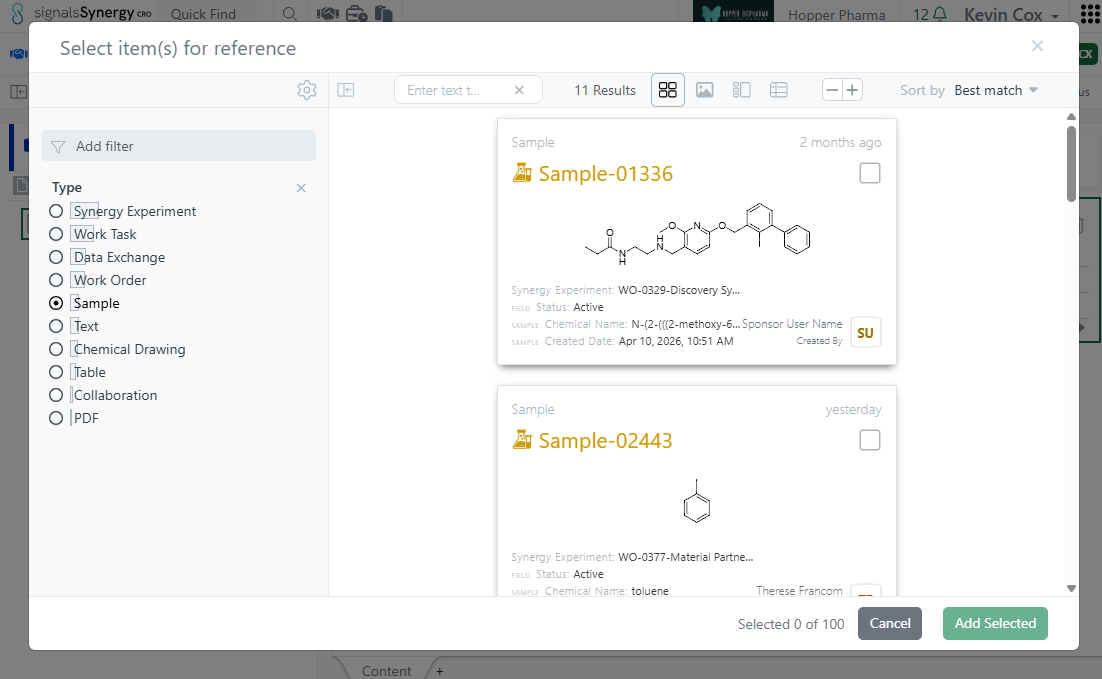
In this release, we expanded the functionality of internal references fields for CRO users. Previously, internal reference fields, such as those in Admin-Defined Tables, always directed the CRO user to Work Order Reference Tables. This allowed the CRO user to reference relevant Designs or Materials in their Synergy Experiments. In 26.5, internal references have been expanded to allow referencing from Work Order Reference Tables or using CRO Advanced Search (any entities they have access). When the CRO user first clicks on the magnifying glass of an internal reference field (such as in cell in a Table), the modal will allow the user to select references from the associated Work Order Reference Tables, assuming the query defined for the internal reference allows for Designs and/or Materials. To search outside the Reference Tables, the CRO user can click on the blue Search other items option, which opens CRO Advanced Search. From Advanced Search, CRO users can reference other items they have access to, such as related Synergy Experiments, Samples, or documents. This functionality applies to internal references in Synergy Experiment Properties, Stoichiometry Tables, Admin-Defined Tables, Samples Tables, Worksheets, and Text.

Image 13 from What's New 26.5.docx

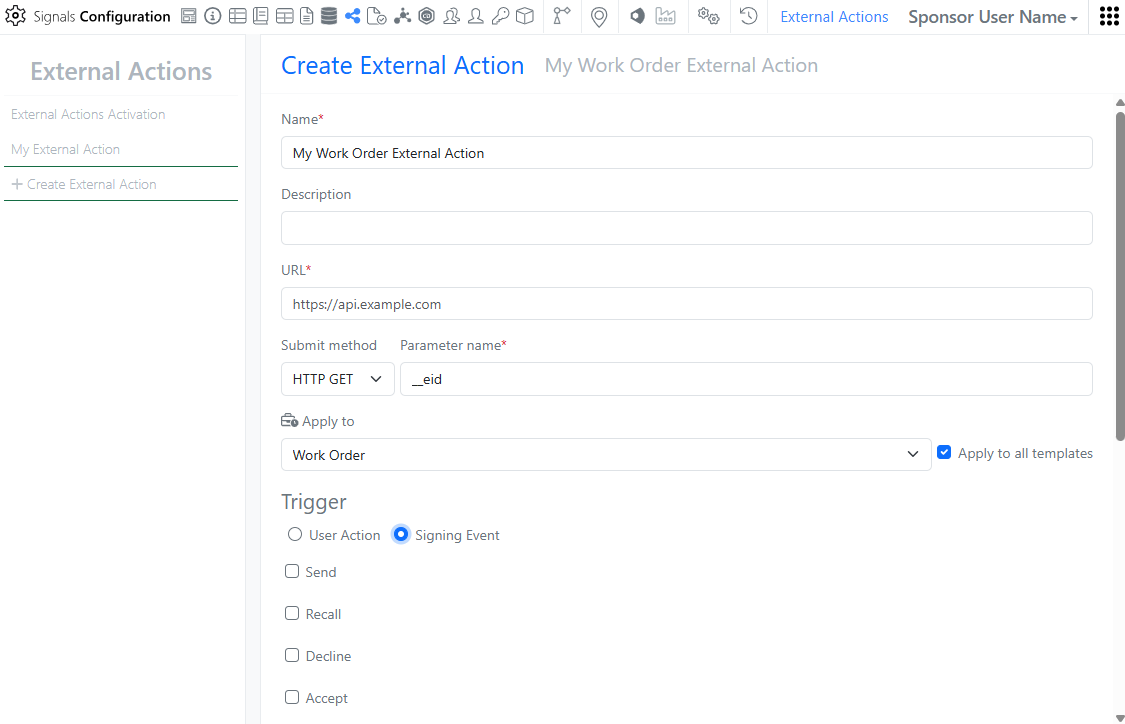
In Signals Configuration, External Actions can now be configured on Work Orders. External Actions can be user triggered or triggered at signing events such as Status changes like Send or Submit. As with other External Actions, the administrator can choose whether to display for the CRO user.

Image 14 from What's New 26.5.docx
Image 15 from What's New 26.5.docx
Image 16 from What's New 26.5.docx

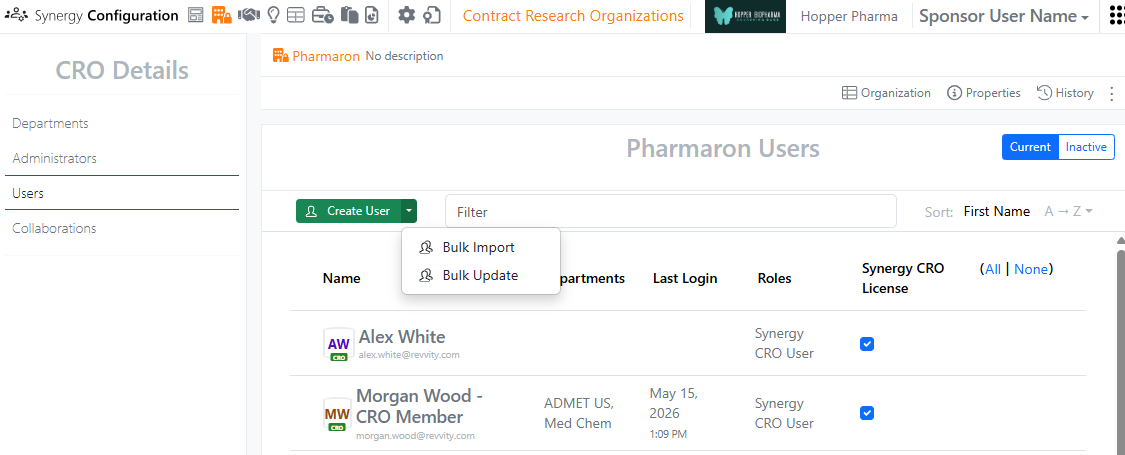
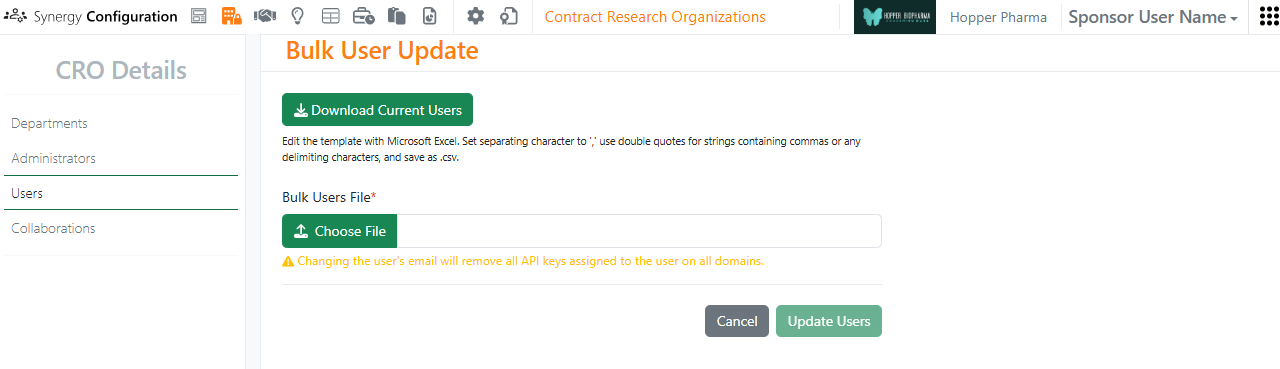
In Synergy Configuration > Contract Research Organizations > specific CRO > Users, Bulk Update CRO users now supports assignment to Departments, as well as setting a user as a Department Manager. A CRO user can be added or removed from Departments and promoted to or demoted from a Department Manager. To see an example of the format, use the Download Current Users button. In the CSV file, Departments are comma separated. For each Department listed, adding |Manager:true will promote the user to a Manager for that CRO Department. Removing |Manager:true will demote the user to only a Member of that CRO Department.

Data Workflows & Analytics

Image 17 from What's New 26.5.docx

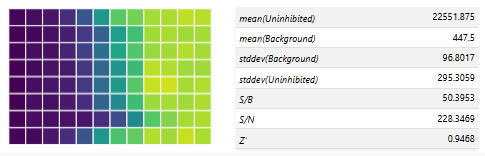
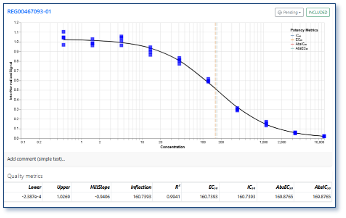
Additional Quality Control (QC) and Curve Fitting metrics will now be computed, displayed and available for publication:

- Signal-to-Background (S/B) ratio per plate

- Signal-to-Negative Control (S/N) ratio per plate

- Z` (Prime) Factor per plate

- Absolute EC/IC50 value from curve fit parameters for logistic regression curves

Users will now be able to select which QC and Curve Fitting metrics are published from all the available ones in a flexible manner.

Tables

Image 19 from What's New 26.5.docx

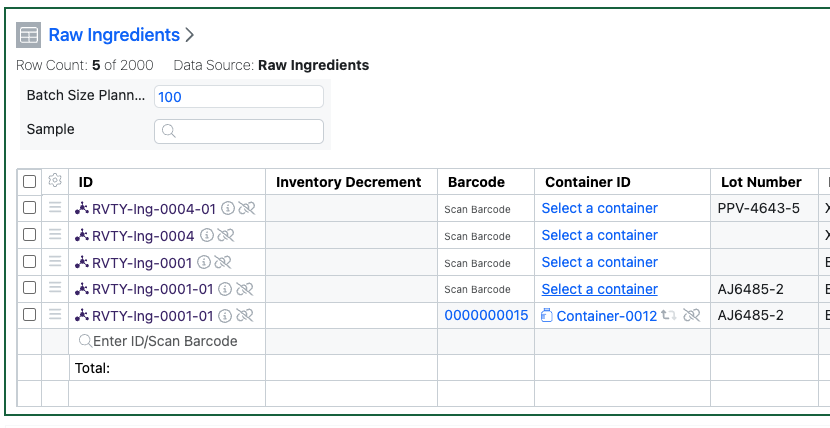
Admin Defined Tables, Variation Tables and Hierarchical Tables now allow Containers to be added to existing rows in Inventory linked tables. If the table uses the Inventory Columns that allow input of Containers, Assets or Batches via an Internal Data Source, the scientist can now add the Container in a subsequent action to adding an Asset or Batch. The scientist can either scan the barcode, or access a view of the appropriate Containers to choose from. Only Containers containing Batches of that Asset can be added.

Image 20 from What's New 26.5.docx
Image 21 from What's New 26.5.docx

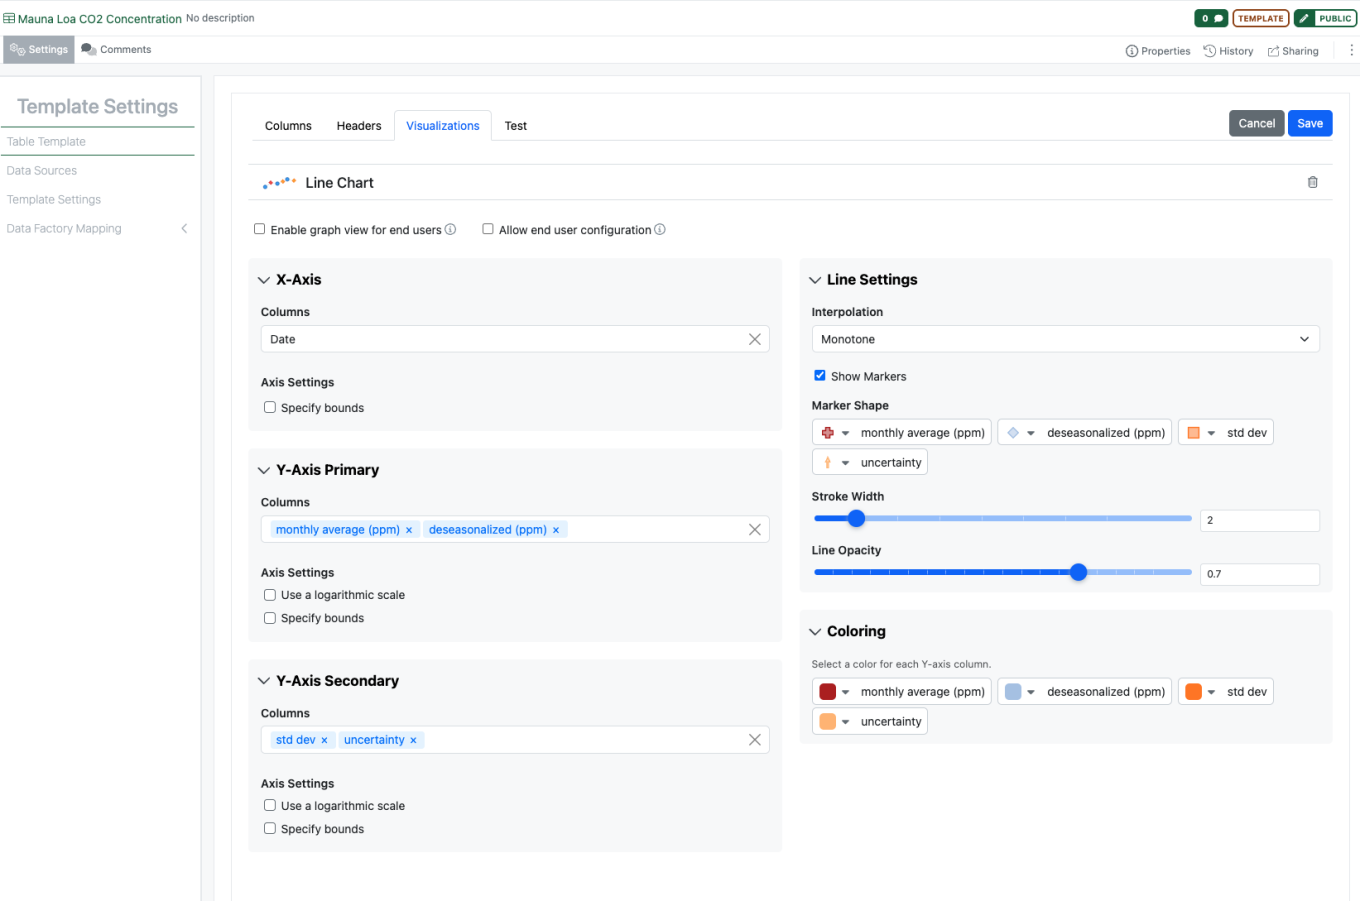
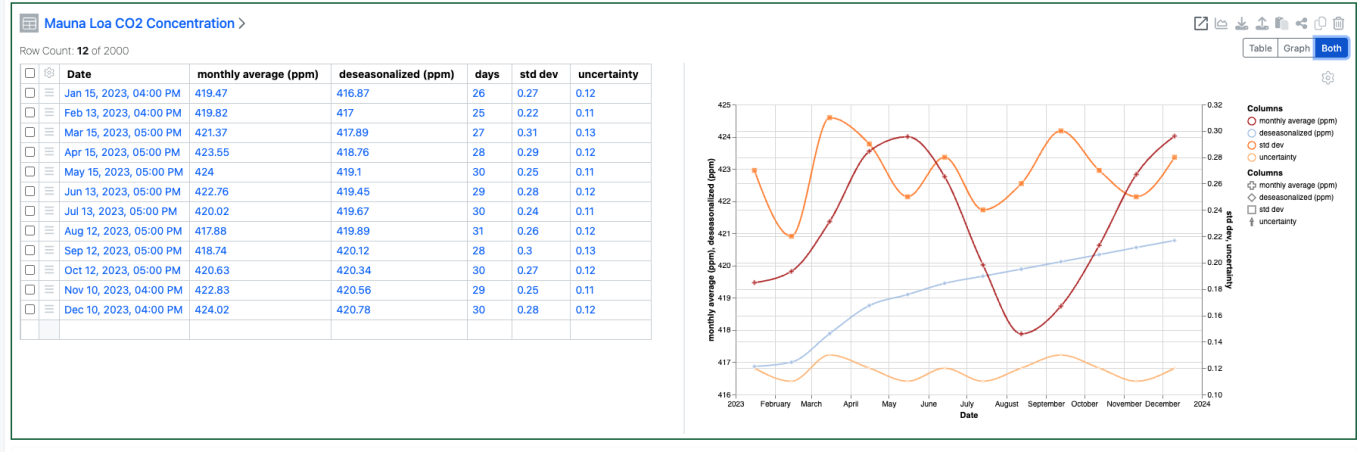
Configuration Administrators can now choose to define a Line Chart on Admin Defined Tables. Similar to the definition of Scatter Plots and Bar Charts, administrators can define the Line Chart on the Table template including setting properties for the X, Y and Secondary Y Axes. Admins can also define line properties such as color, marker, thickness, opacity and interpolation. The admin can also choose if the end user is able to adjust the settings for the chart.

Image 22 from What's New 26.5.docx

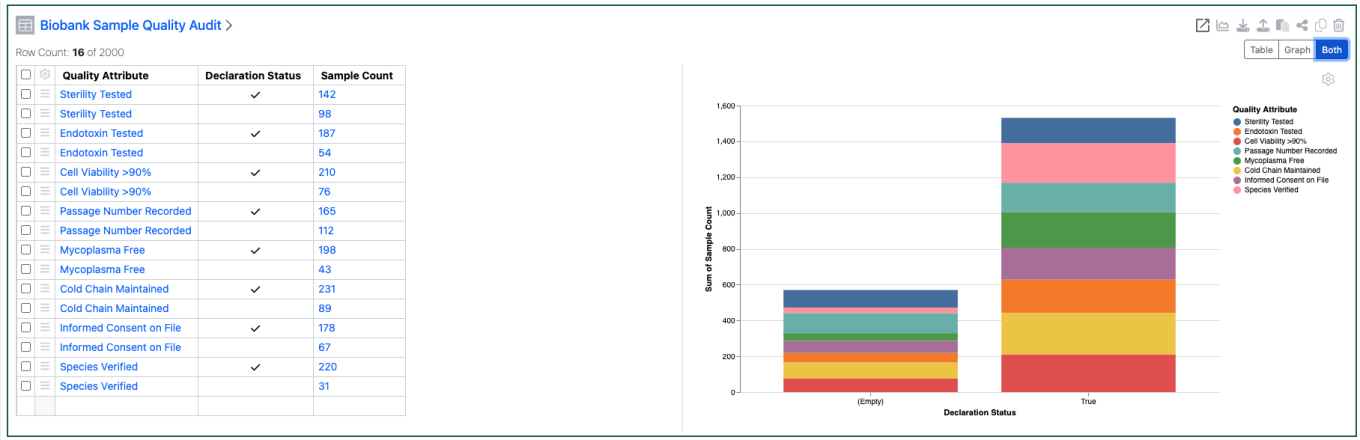
Configuration Admins can now also define that Checkbox, Variable Measure and Variable Properties can be used on the categorical axis of Bar Charts.

BioDesign

Image 23 from What's New 26.5.docx

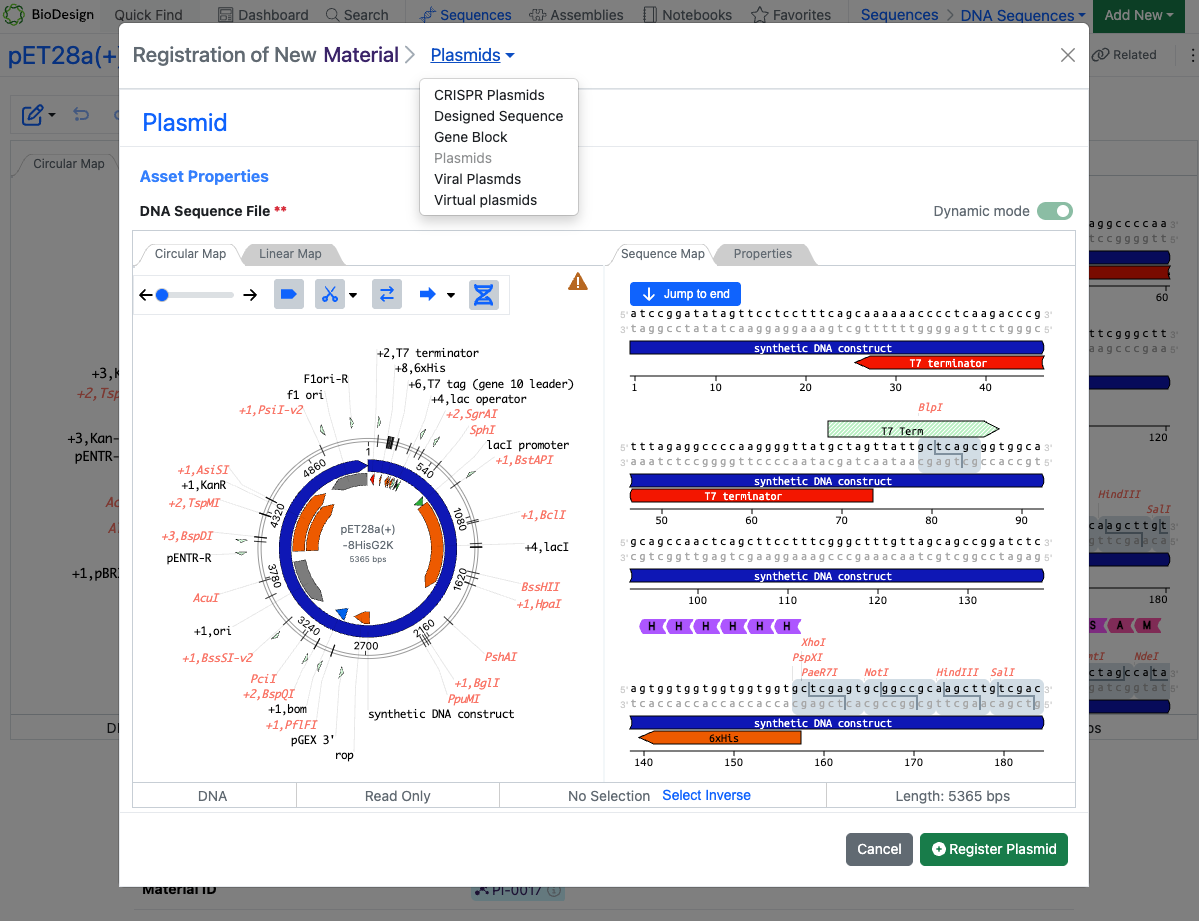
Users with a BioDesign and Signals Notebook or Signals One license can now register BioDesign sequences directly to Signals Materials. The sequence type must match the corresponding Material type. Upon successful registration, links are automatically created between the BioDesign Sequence and the Material in both directions.

Inventory

Image 24 from What's New 26.5.docx

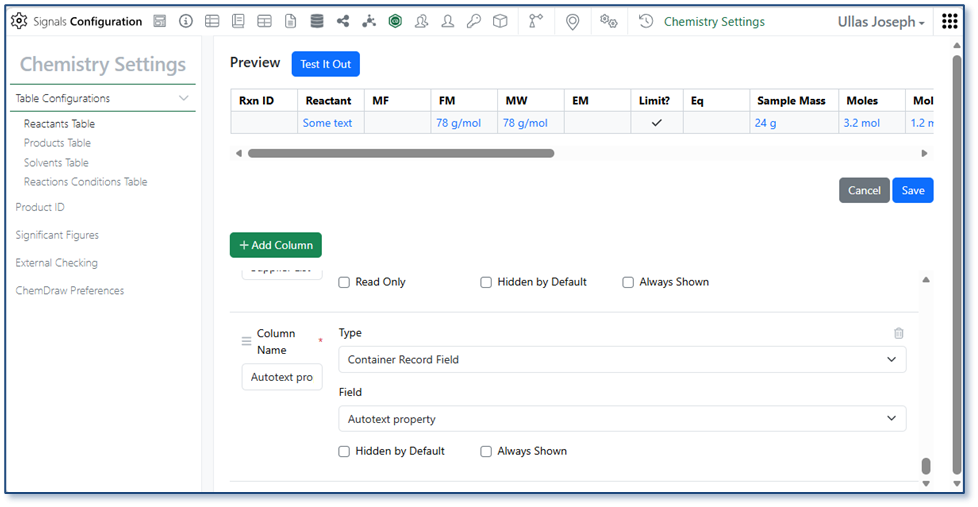
Administrators can now configure container-specific properties to display directly in the Reactants table. Container property columns are available under Container Record Field in the Reactants Table configuration within Chemistry Settings and appear as read-only fields, giving users immediate visibility into container details without leaving the experiment.

Image 25 from What's New 26.5.docx

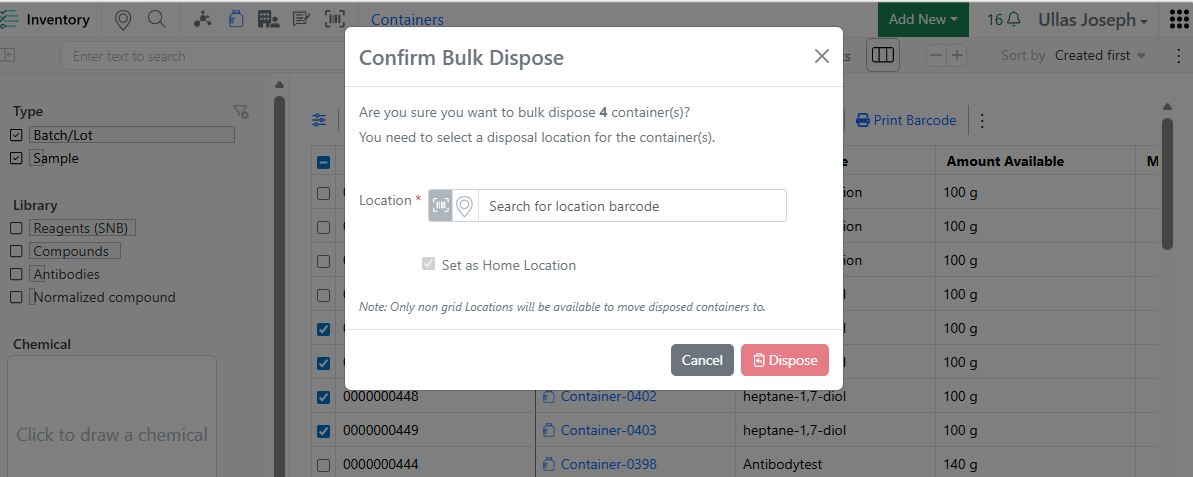
When disposing multiple containers from the Container Search Table, users are now prompted to move grid-located containers to a non-grid location before disposal — consistent with the single-container disposal workflow. This eliminates the need to open and dispose containers one by one, saving time and freeing up grid space more efficiently.

InventoryGo

Image 26 from What's New 26.5.docx
Image 27 from What's New 26.5.docx

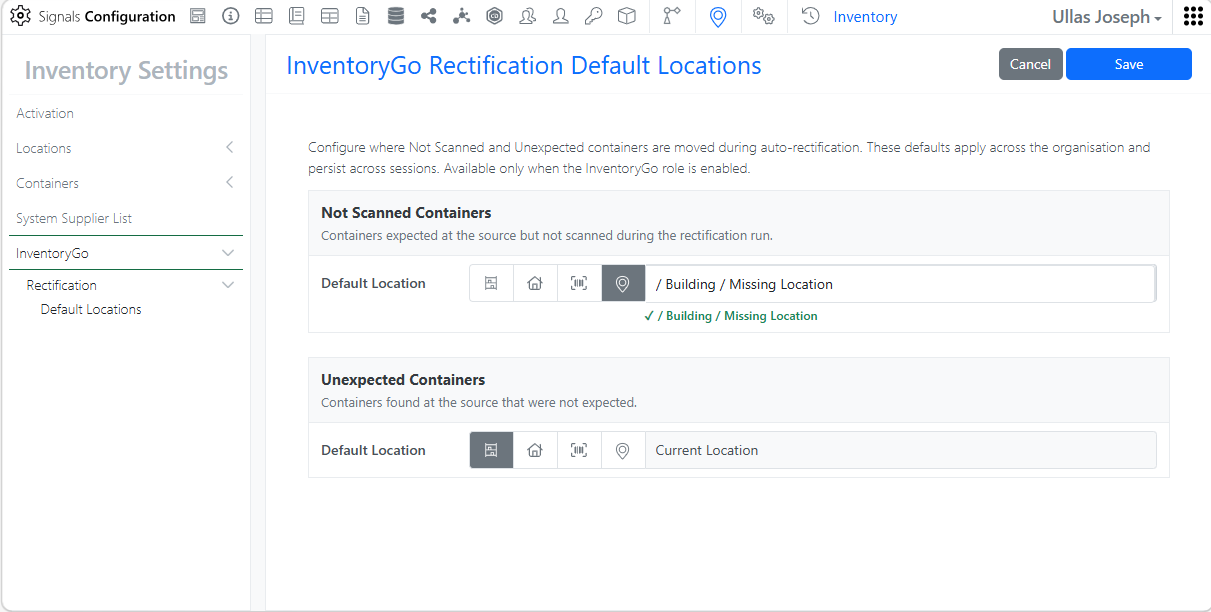
Rectification. Administrators can configure containers to be automatically moved to the currently scanned location or a predefined default location, reducing manual effort and speeding up the rectification workflow.

Materials

Image 28 from What's New 26.5.docx

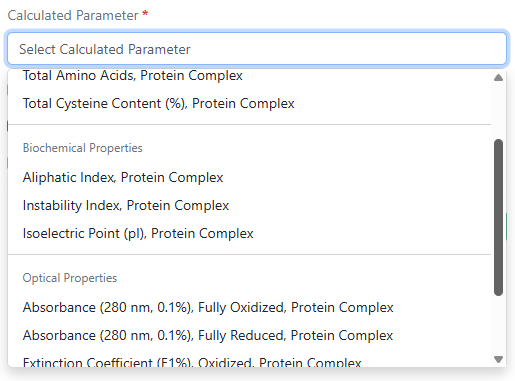
Absorbance (280 nm, 0.1%) fully oxidized, absorbance (280 nm, 0.1%) fully reduced, aliphatic index, instability index, and total cysteine content (%) are now available as additional calculated properties for protein complexes in Custom and Protein library types and in the pre-configured Antibodies library.

Image 29 from What's New 26.5.docx

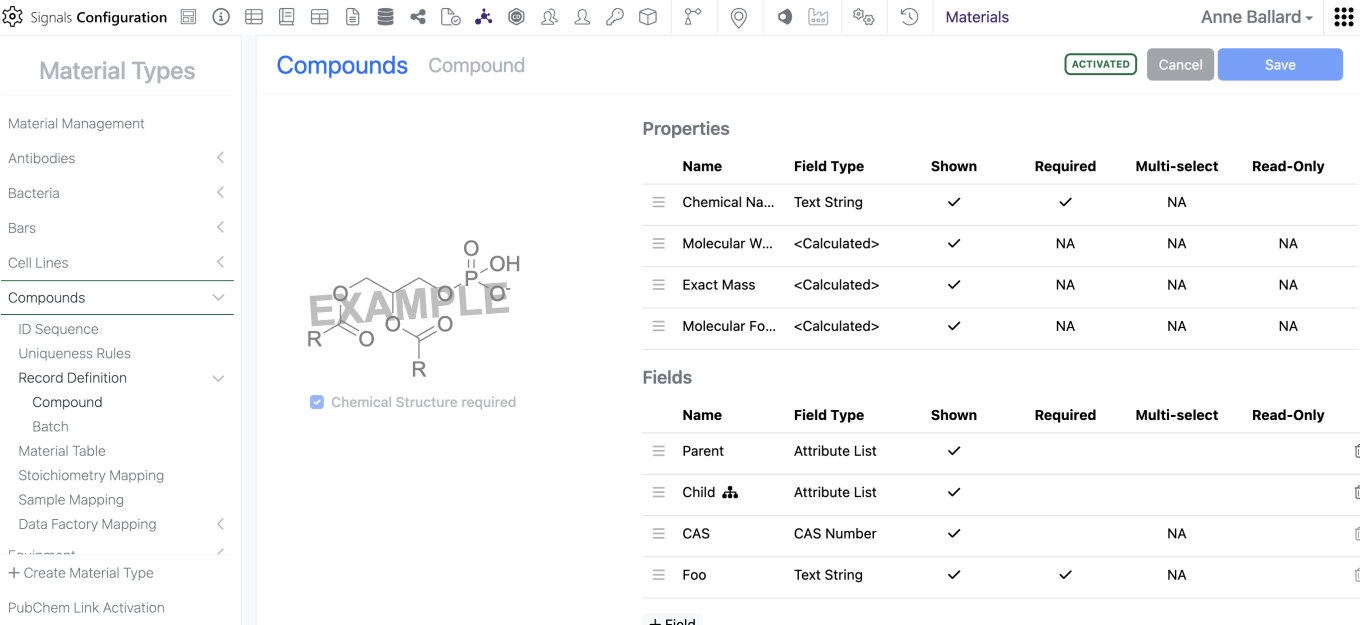
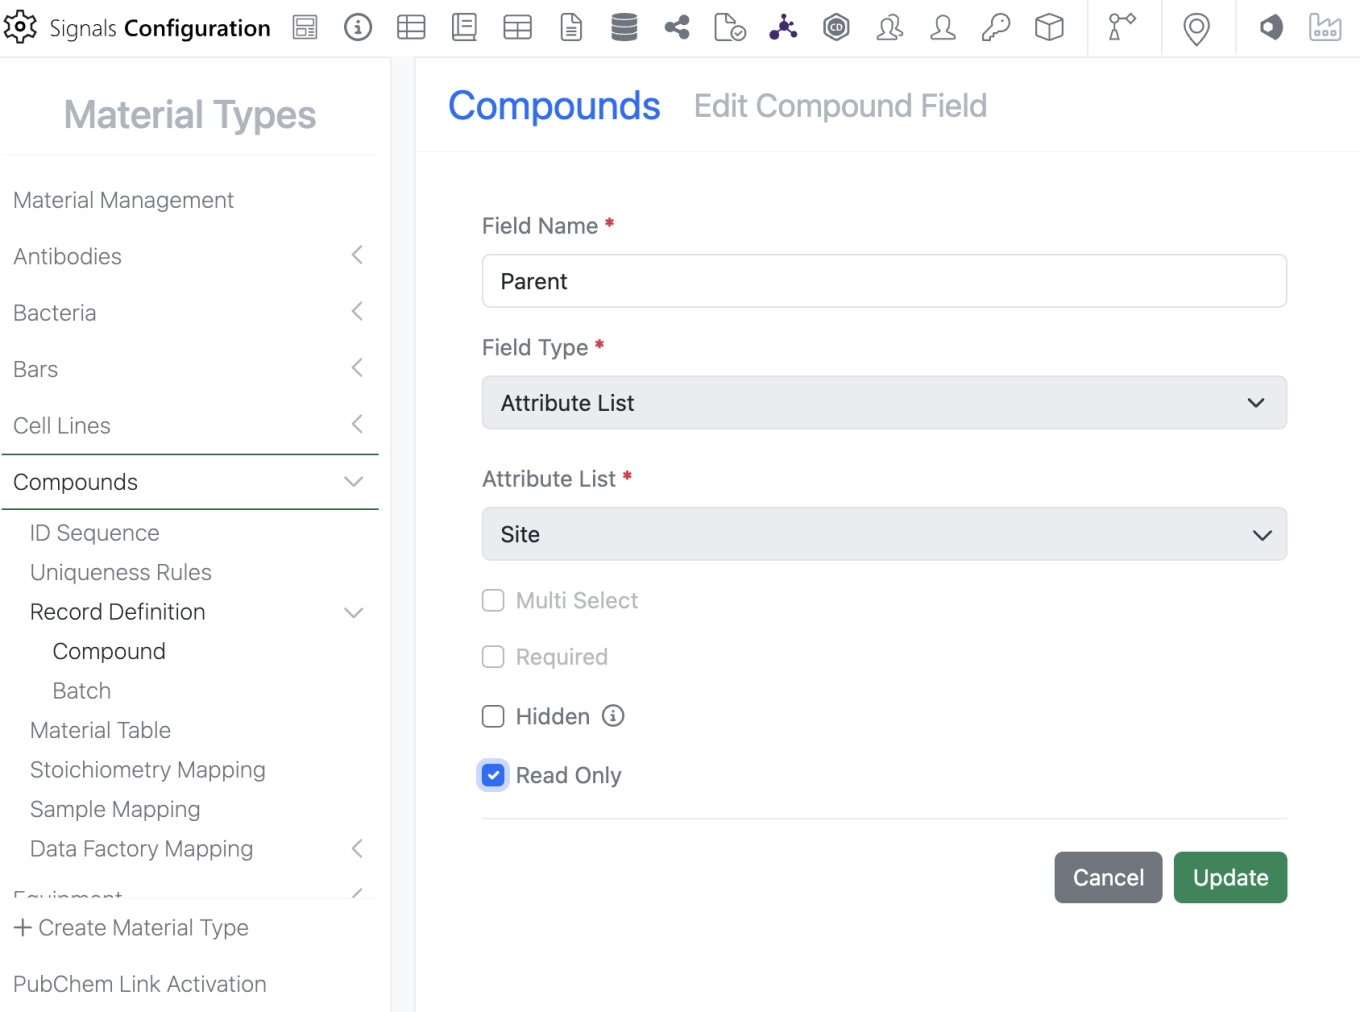
Admins can now mark Material properties “Read-Only” which prevents users from altering the data in the UI but does not limit update via the APIs. This does not alter which properties are available for update via the APIs.

Image 30 from What's New 26.5.docx

To mark a property as “Read-Only”, the admin can edit the property and select the new “Read-Only” option. Please note that a property can either be “Read-Only” OR “Required”, it cannot be marked as both.

Administration

Image 31 from What's New 26.5.docx

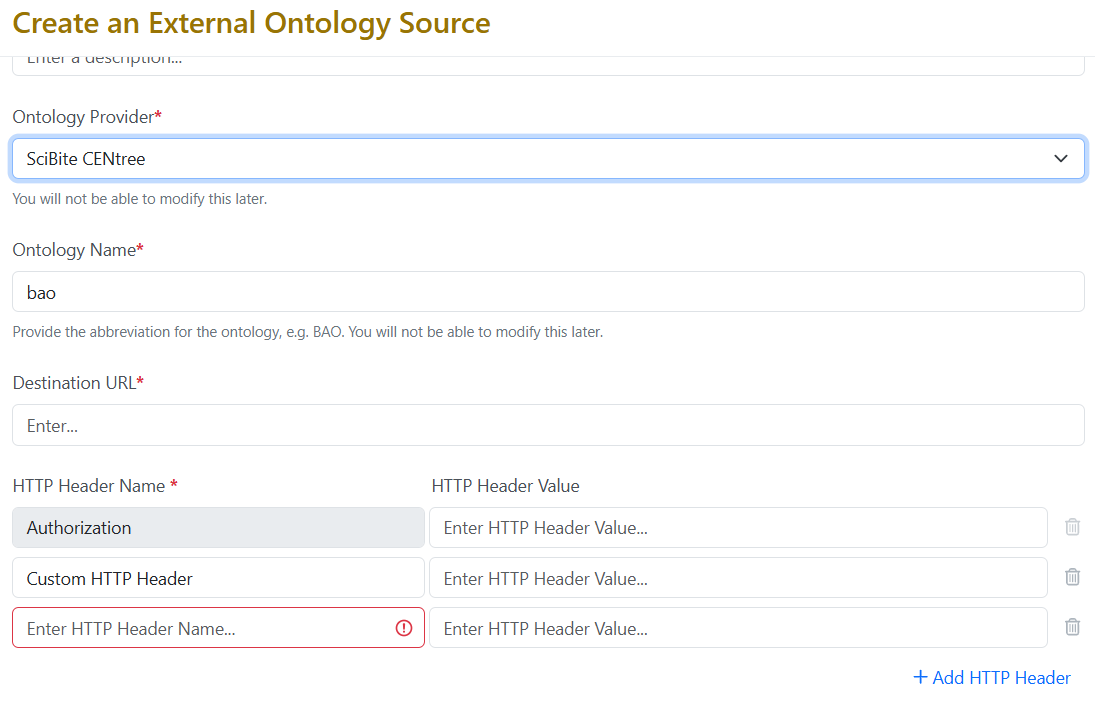
External Ontology Source for the provider SciBite CENtree now support up to twenty custom HTTP headers, enabling compatibility with more complex authentication schemes.

Integrations & APIs

Image 32 from What's New 26.5.docx

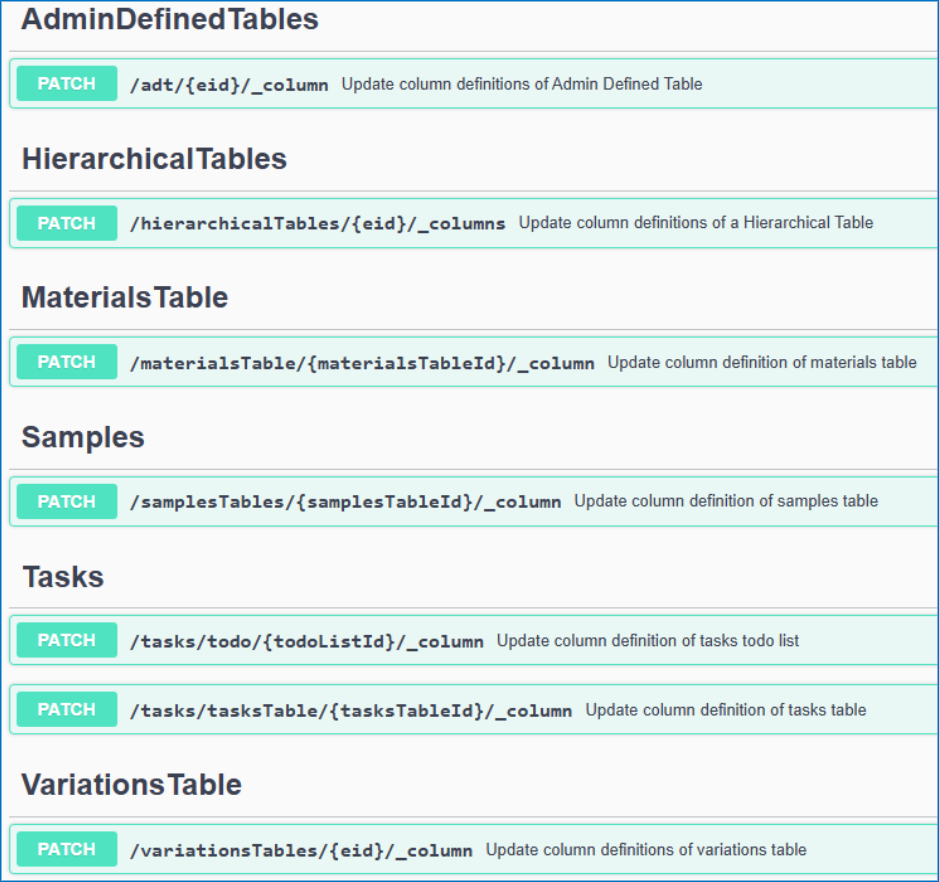
We have added API support for hiding and unhiding of table columns via API.

Image 33 from What's New 26.5.docx

We have added a new API to move Experiments to different parent Notebooks.

Image 34 from What's New 26.5.docx

We have added new APIs for returning closed entities from an archive state to Closed.

Image 35 from What's New 26.5.docx

We have enhanced existing APIs for fetching the Material Library definitions to allow for specifying the specific Material Library to fetch. This is an optional “name” parameter that when not included will return all libraries definitions.

Image 36 from What's New 26.5.docx
Image 37 from What's New 26.5.docx

We have enhanced the User fetch API to allow for fetching all CRO users in a tenant. A new “userType” parameter has been added that defaults to “systemStd”. To fetch CRO users this is set to “cro”.

Image 38 from What's New 26.5.docx

We have enabled additional CRO APIs for interacting with Chemical Drawings. These are intended for use in Sponsor integrations via Bearer Token, CRO users cannot have API keys generated for them.

Beta Features

The following capabilities are in beta and are available for users, administrators and developers on the Signals platform upon request. Please contact your account representative or our support team if you would like access to the following features.

Synergy

Image 39 from What's New 26.5.docx

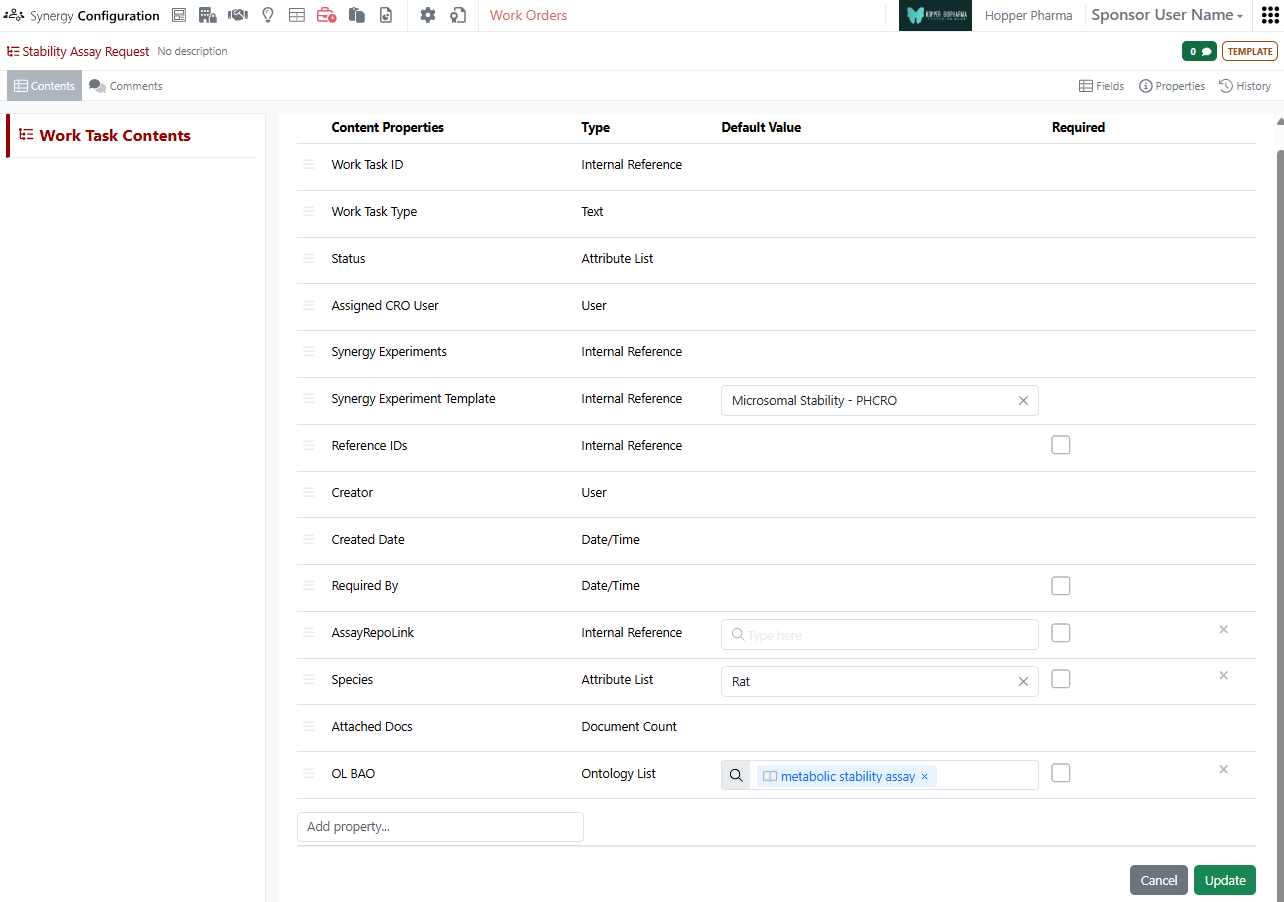
As part of the existing Synergy Work Tasks beta feature, Work Task Templates now support default values. On a Work Task Template, the administrator can specify the default Synergy Experiment Template to be used or default values for other admin-defined properties. When a Work Task is created from this template, the property will be pre-filled with this default value, but can be adjusted if needed. This ensures the Work Task properties are specified correctly for the CRO and reduces the number of clicks and required manual entry by the Sponsor.

Materials

Image 40 from What's New 26.5.docx

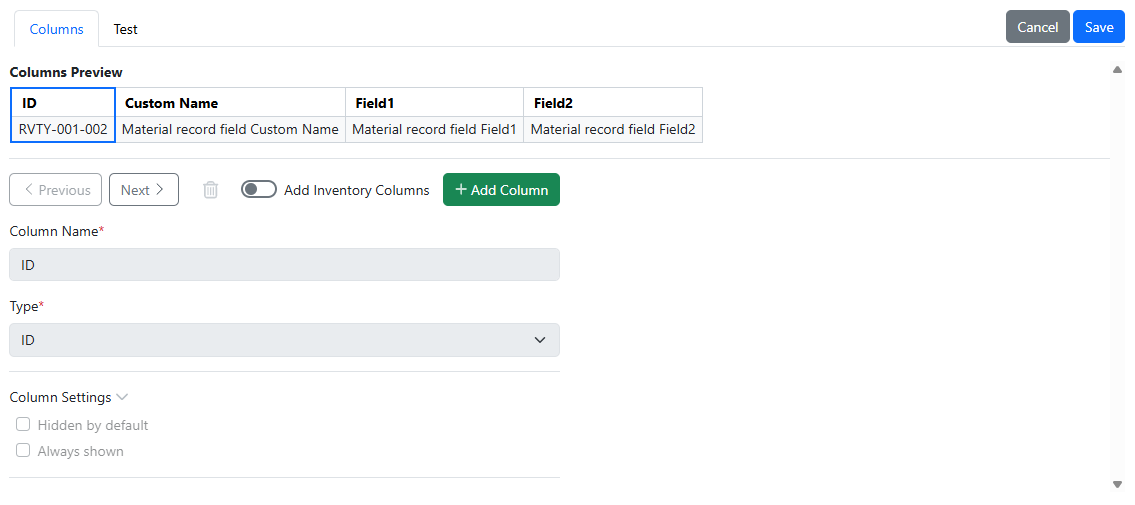
The user interface for Admin configuration for materials tables in Signals Configuration has been updated.

Administration

Image 41 from What's New 26.5.docx
Image 42 from What's New 26.5.docx
Image 43 from What's New 26.5.docx

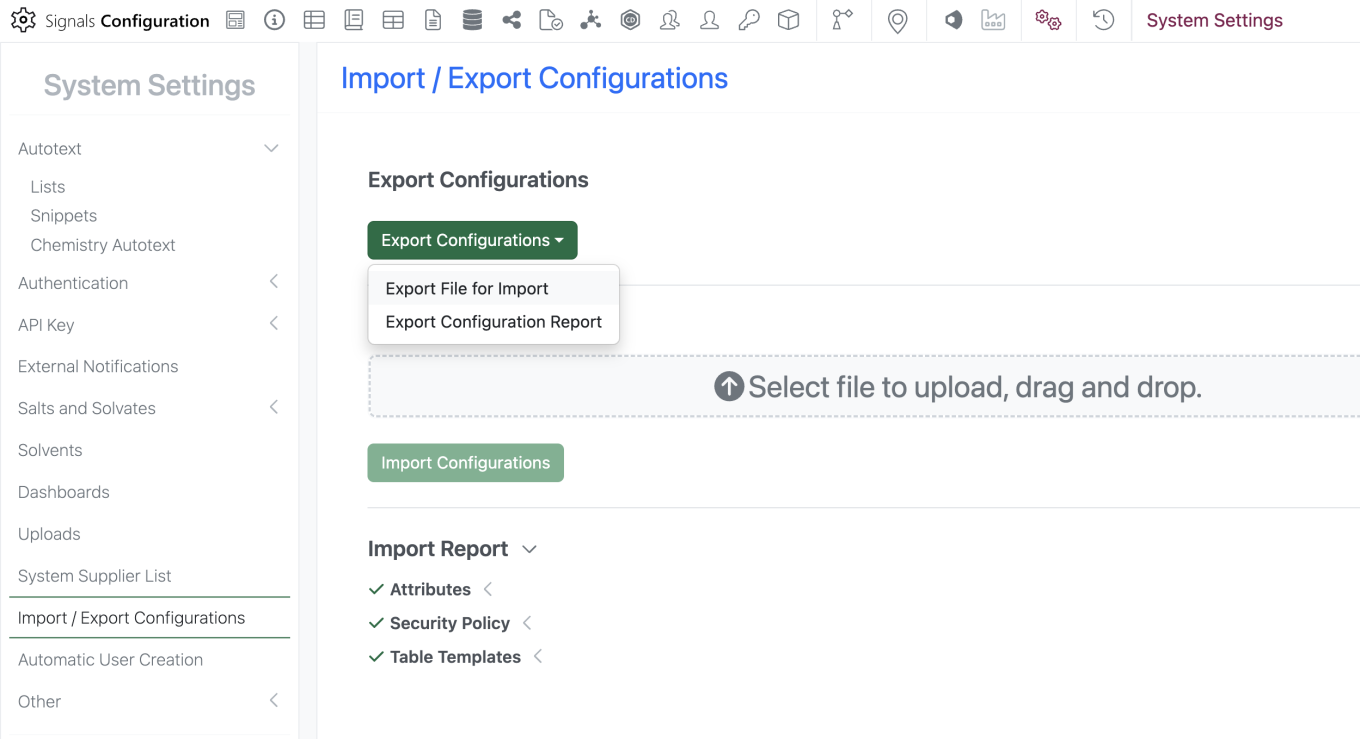
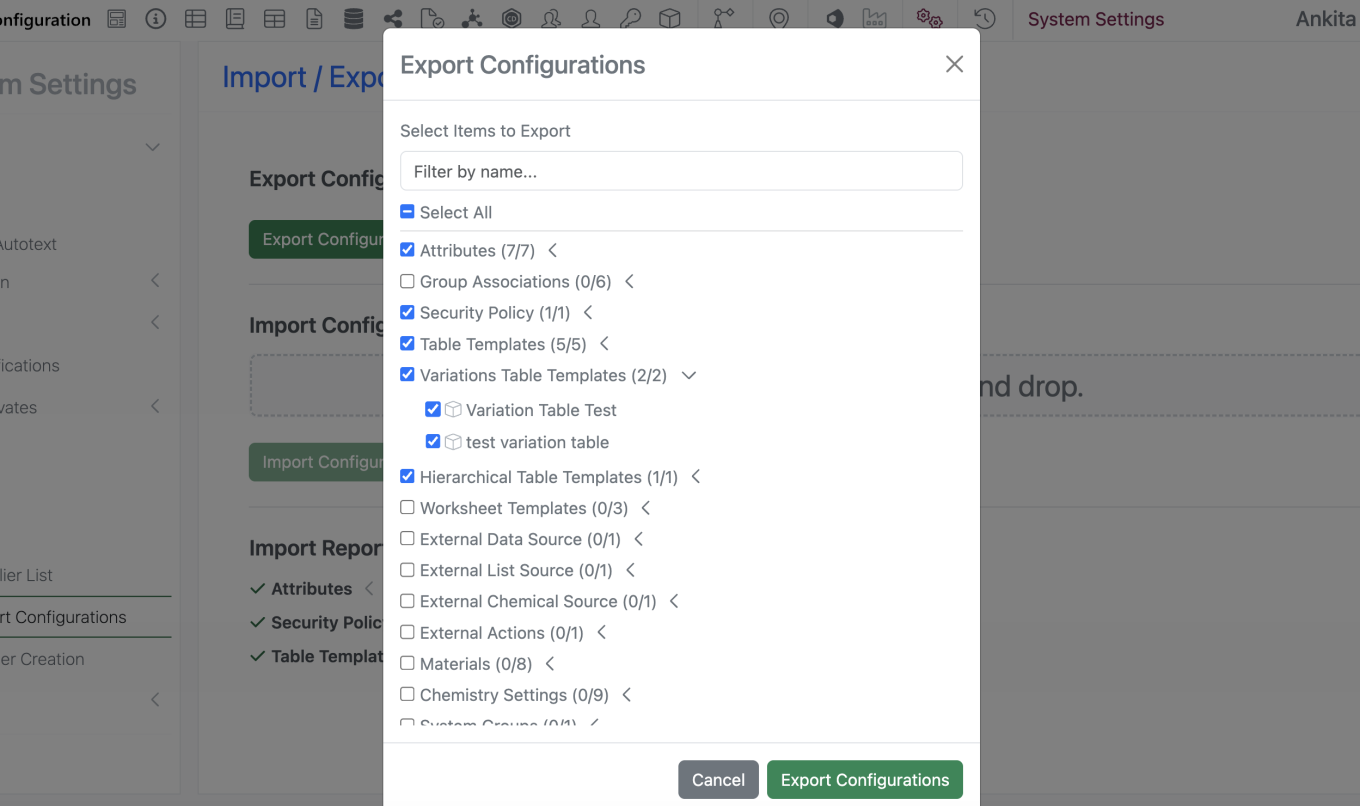
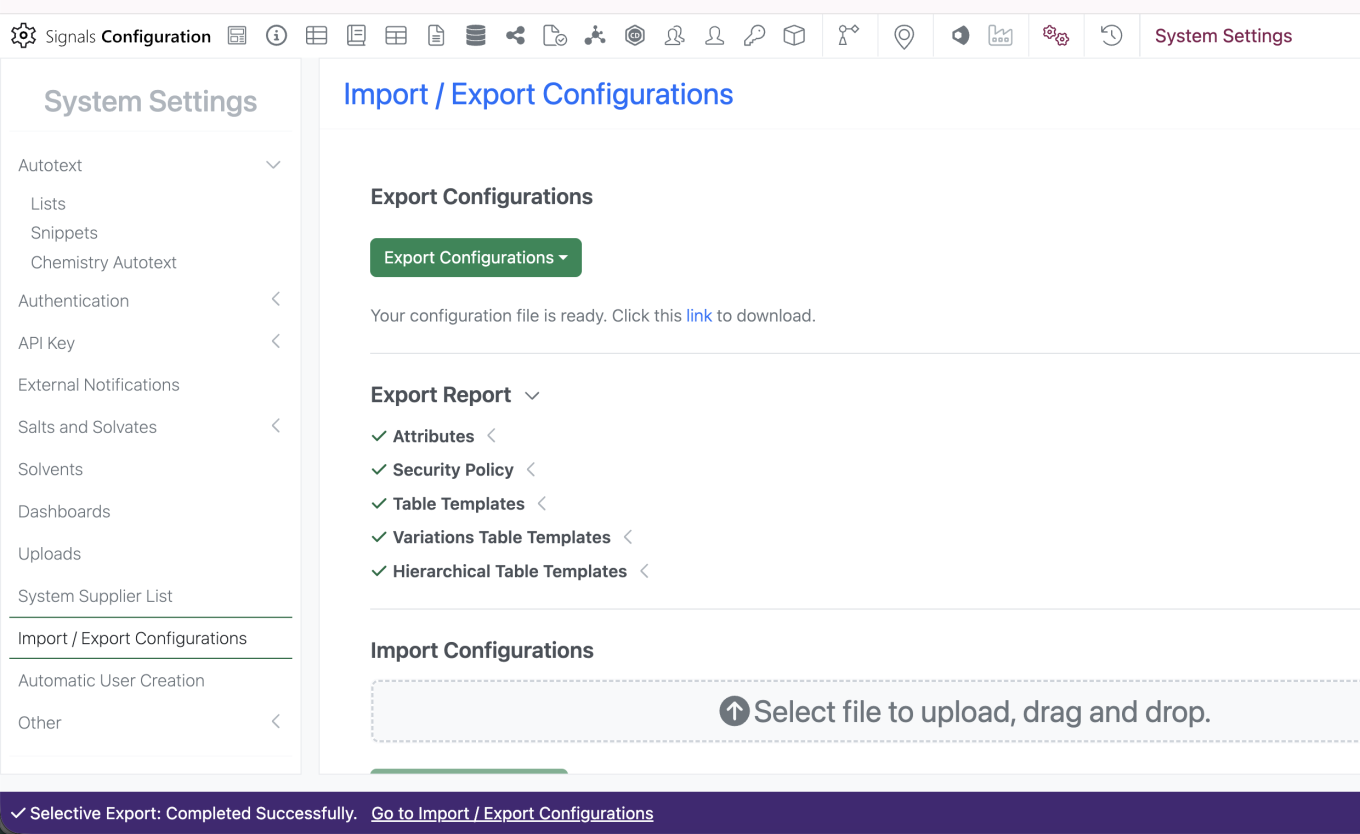
Selective export for configuration migration between tenants is now available. Admins can navigate to the “Import / Export Configurations” interface and select ‘Export Configurations’ > ‘Export File for Import’. Admin is prompted to enter password to navigate to the ‘Export Configurations’ modal. Admin is able to select specific objects to include in the export file and filter by name to narrow down the menu. Admin can select the link to Export the file.

Revvity Signals™ One, including Signals Notebook, Update

What’s New

We are delighted to release our new version of Signals, 26.7.

The following improvements are available for users, administrators and developers on the Signals platform. Certain features may only be available with appropriate licensing and/or with enablement by an administrator.

  • Fundamentals
    - Register Assays and their Variants in the new Assay Library (beta)*
    - Audit trail displays highlighted granular changes for layout changes
    - Performance improvements to Parallel Experiments External Enumeration
  • AI*
    - Prompt-to-Filter is available to all systems
    - AI Explorer (Beta)
  • Data Workflows & Analytics*
    - Additional set of plate, batch and curve-based metrics
  • SAR & Decisioning*
    - Use new ChemCharts data functions to convert structures to HELM, and to calculate nucleotide and protein properties
    - Define number formatting directly within ChemCharts visualizations
  • Synergy†
    - Workflow and privilege options to allow CRO users to Close and/or Reopen their Synergy Experiments
    - Global auto-numbering controls for Work Orders
    - Work Tasks in Work Orders is available to all systems
    - Define default values, including Synergy Experiment Template, on Work Tasks Templates is available to all systems
    - Notification to Sponsor administrators when a CRO admin adds or deactivates a CRO user
    - Notification to CRO user when a Work Order is recalled
    - Publish Data Exchange Results Tables from Synergy Experiments (beta)
  • Chemistry
    - Copy individual structures from Reactants or Products tables
    - Naming of mixtures now reflects component ratios
  • Tables
    - Bucketed numerical column can be used for Categorical axis on a Box Plot*
    - Color Box Plots by aggregated numerical values*
    - Define if outliers are displayed in a Box Plot*
    - Hover over segments in Box Plots to see associated rows*
    - Add a second property to the Categorical axis of Box Plots*
    - Display secondary data of a Box Plot in a table*
    - Define a categorical column for markers in a Line Chart*
    - Trellis Charts*
  • Inventory
    - View Container Location Details in Stoichiometry and Materials tables
    - Bulk Edit Home Locations with Blank Home Location Support
    - Home Location Assignment Enhancements in Create/Edit Grid Location and Bulk Edit workflows with visual indicators and validation to ensure Home Location uniqueness
    - Improved Auto Fill Grids logic to automatically select occupied grid cells and skip only cells that are already assigned as Home Locations
    - Added row-level warning indicators in Inventory Decrement Auto Fill to clearly identify containers that are ineligible for inventory decrement
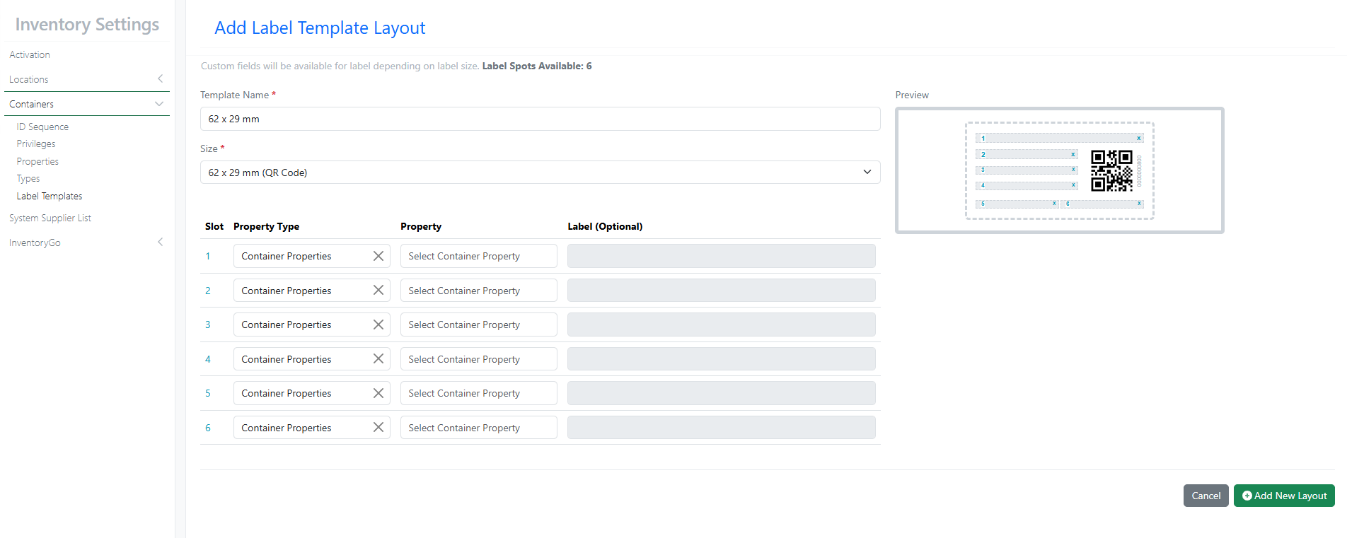
    - New Label Templates (76×25 mm (6 slots) & 62×29 mm QR)
  • InventoryGo ‡
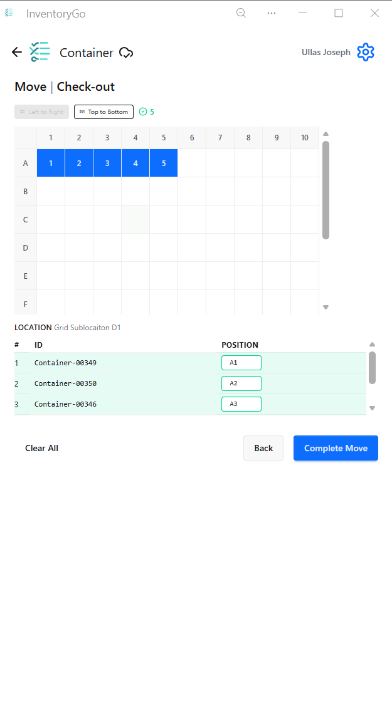
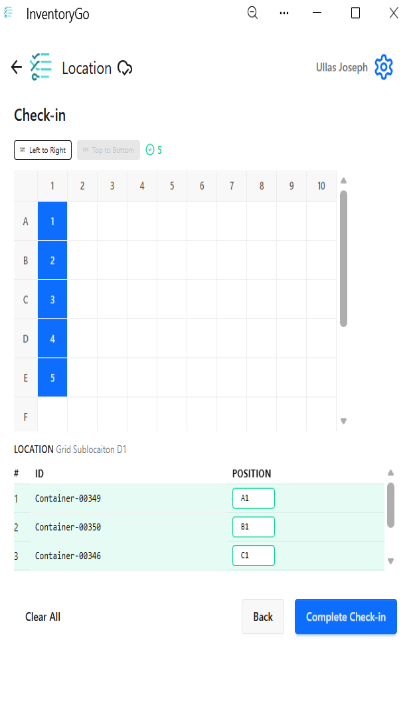
    - Grid Position Selection During Check In/Out
    - Material ID & Expiration Date in Reconciliation Reports
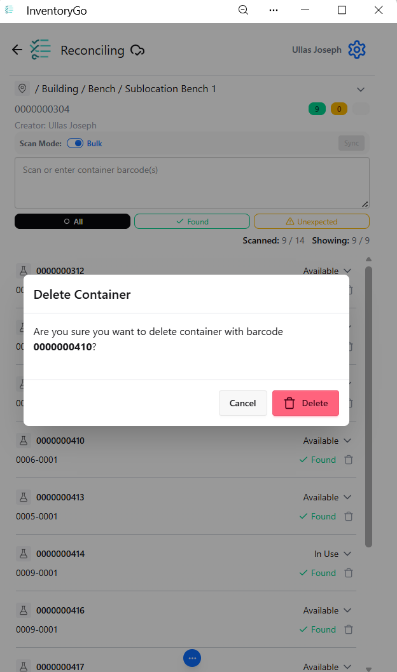
    - Confirmation Prompts for Delete in Reconciliation Actions and Consume workflow
    - Reconciliation Details in Inventory Application for both Locations and Container
  • Tasks and Requests
    - Complete Task within same experiment
  • Administration
    - Access Data Factory audit events from the Signals audit log*
    - Selective export for configuration migration is available to all systems
    - A matching Configuration Report (PDF) generates based on selective configuration export is available to all systems
  • Integrations & APIs
    - Revoke Bearer tokens API
    - Expanded Chemical Structures output for Material Fetch API
    - RDF Files support for External Enumerator API 
    - Fetch Parser Definitions API
  • Xynthetica* 
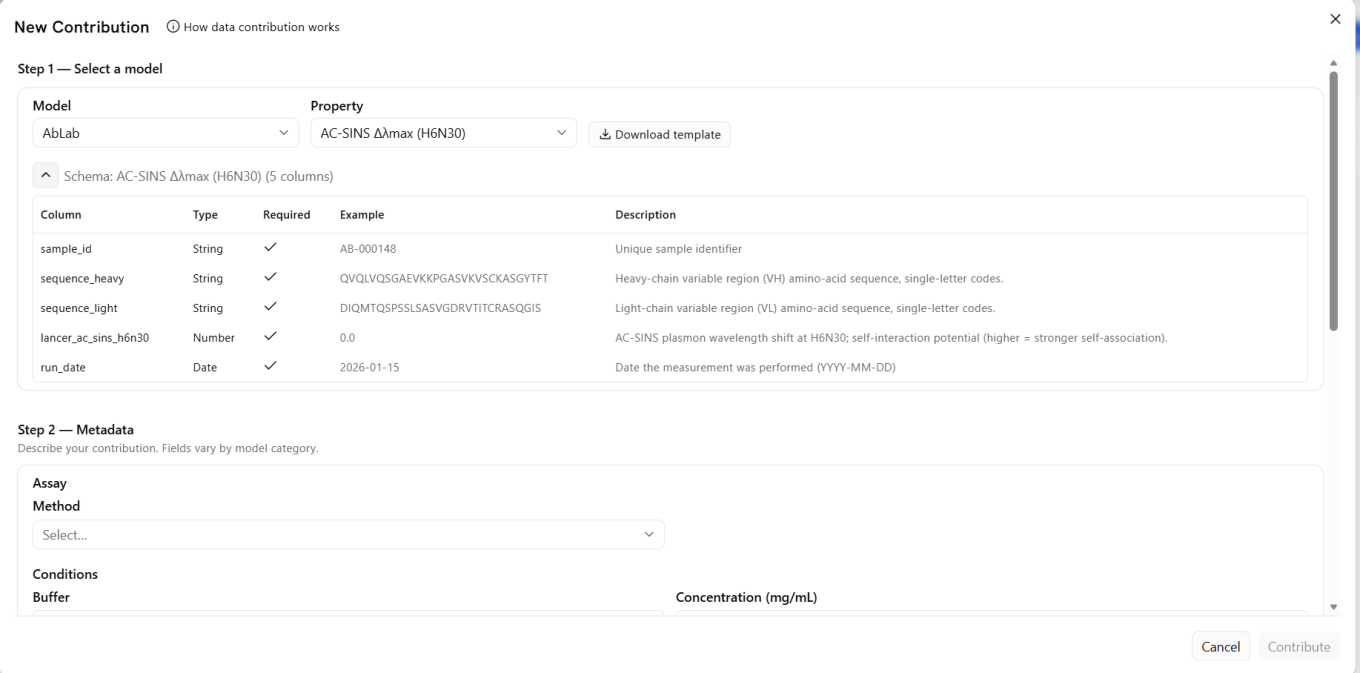
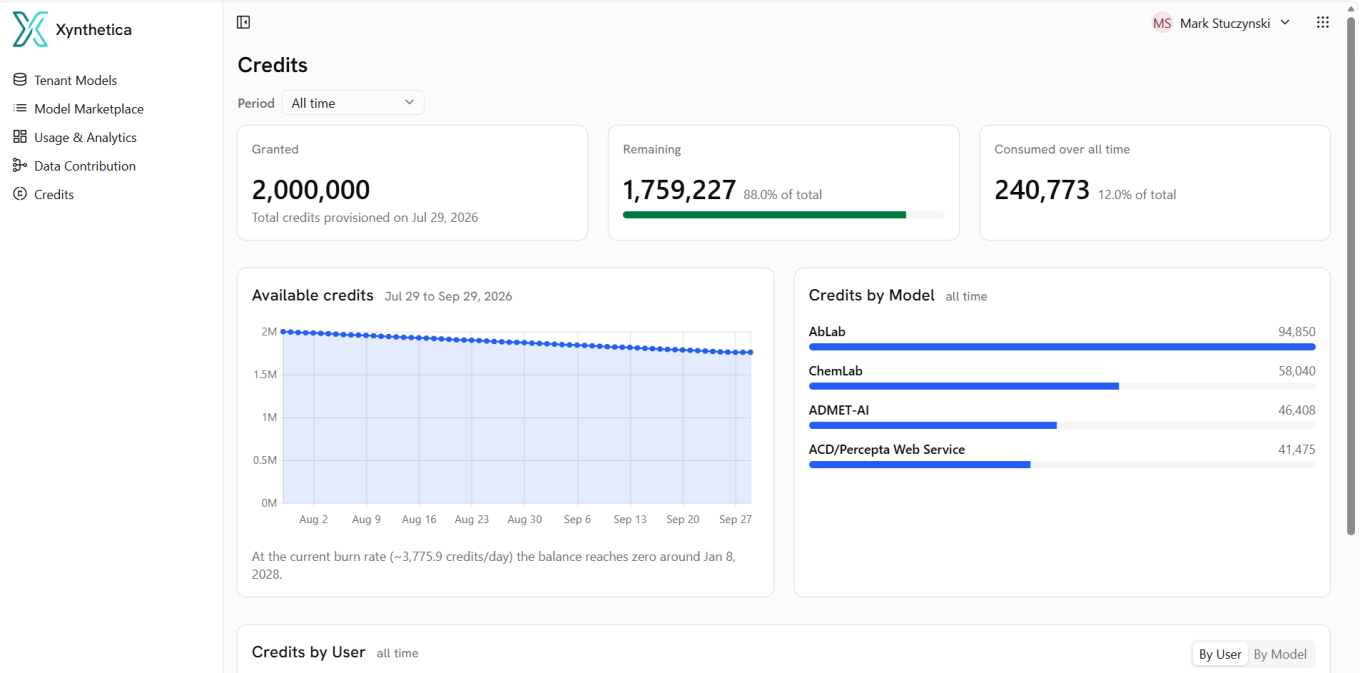
    - ChemCharts access for RDKit, Percepta, and Tunelab models (beta)

* Requires Signals One license

† Requires Signals Synergy license

‡ Requires InventoryGo license

We also fixed several small bugs in this release. Details of the enhancements are described below.

The following OnDemand videos for Signals Synergy are now available

  • Configuring Initial & Ongoing Signals Synergy Needs
  • Understanding Fundamental Concepts for Signals Synergy

Data Factory Administrators should complete migration of legacy data factory projects before 27.4; after this, legacy projects will become read-only and no longer support data publication.

Data Factory administrators should also note that the Advanced Security policies in Inventa apply an “AND” logic across all user groups, restricting access if any groups lack permissions. This behavior differs from the standard Signals security model and will be fixed to align with the standard in a future release.

Developers should note that starting in the upcoming 26.8 release, fetching structure data will no longer provide the InChI property for new chemicalDrawing records. Instead, a new property, SMILES, will be provided. Please update any downstream integrations to prepare for using the SMILES field instead of InChI.

Administrators are recommended to subscribe to the channels within our support news site found at https://support.revvitysignals.com/hc/en-us/categories/360004446171-Support-News which contains more information about releases and other pertinent product information.

This content is anticipated for release on our Production E3 environments, and for Private Cloud customers on our deferred release schedule, in March 2027.

Further Details

The following improvements are available for users, administrators and developers on the Signals platform. Certain features may only be available with appropriate licensing and/or with enablement by an administrator.

Fundamentals
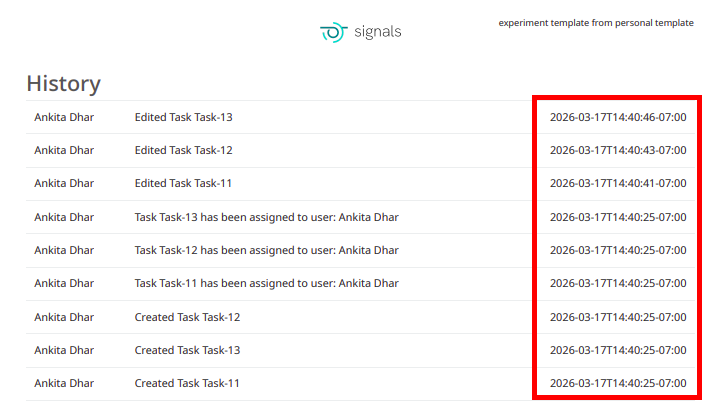
Image 1 from What's New 26.7_finalupdatedv2.docx
Image 2 from What's New 26.7_finalupdatedv2.docx

Performance improvements to the External Enumerator were completed. Performance for large enumerations was drastically improved.

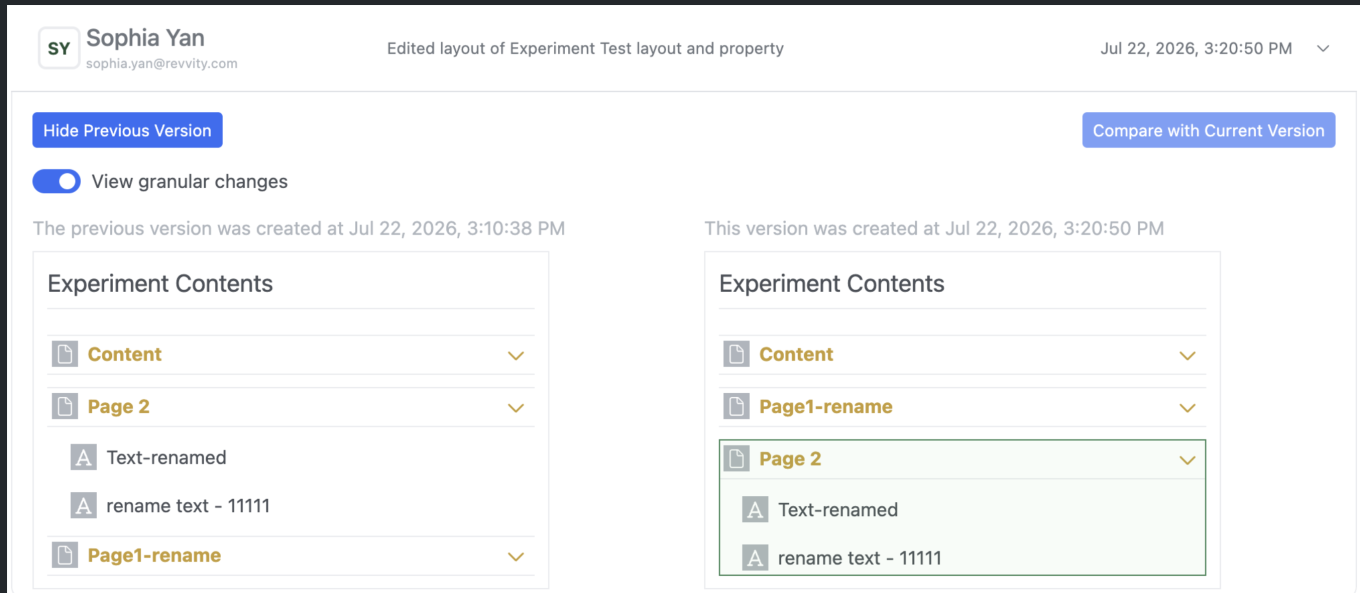
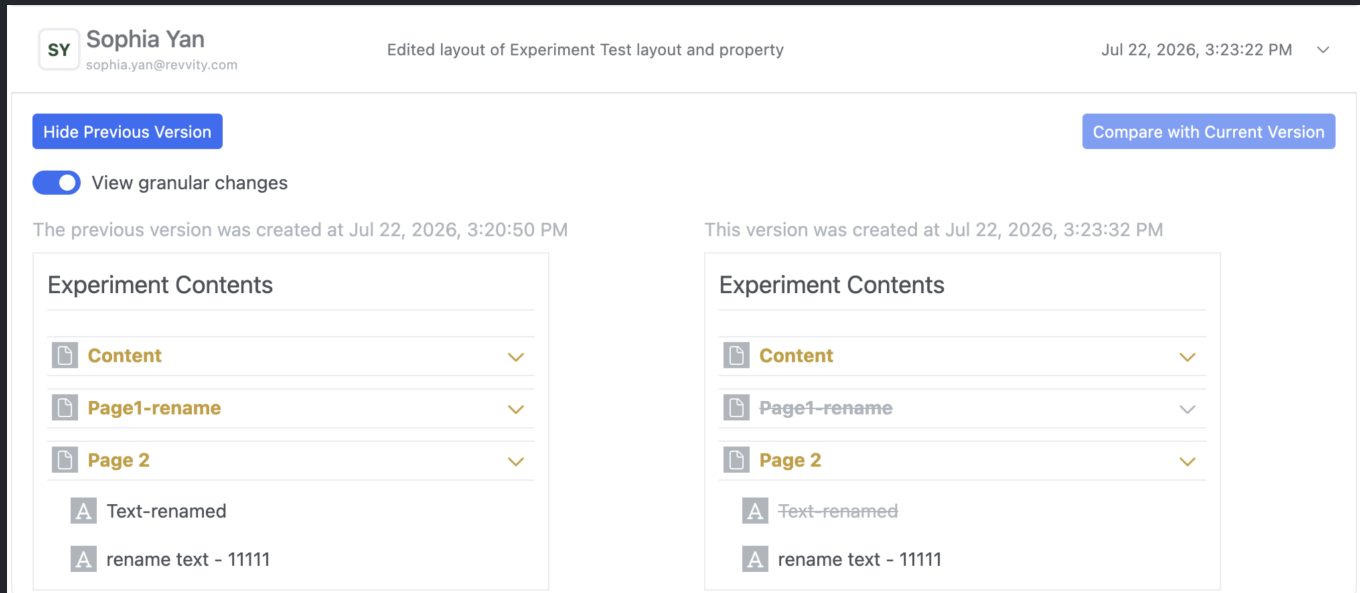
Audit trail displays highlighted granular changes for layout changes. This feature applies to adding, deleting, moving, or renaming a page/element within experiment-like objects, tasks, requests, samples, synergy, work orders/tasks, etc.

AI

Image 3 from What's New 26.7_finalupdatedv2.docx

Prompt-to-Filter is available to all systems.

Data Workflows & Analytics

Image 4 from What's New 26.7_finalupdatedv2.docx

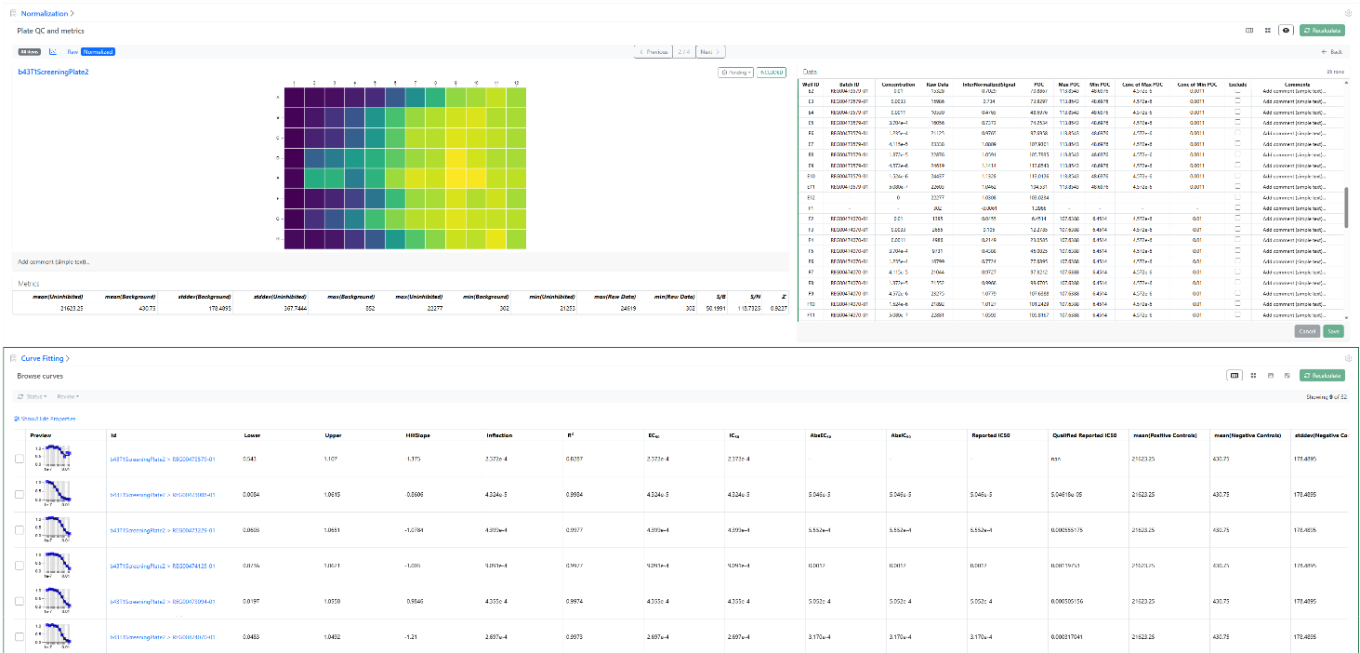
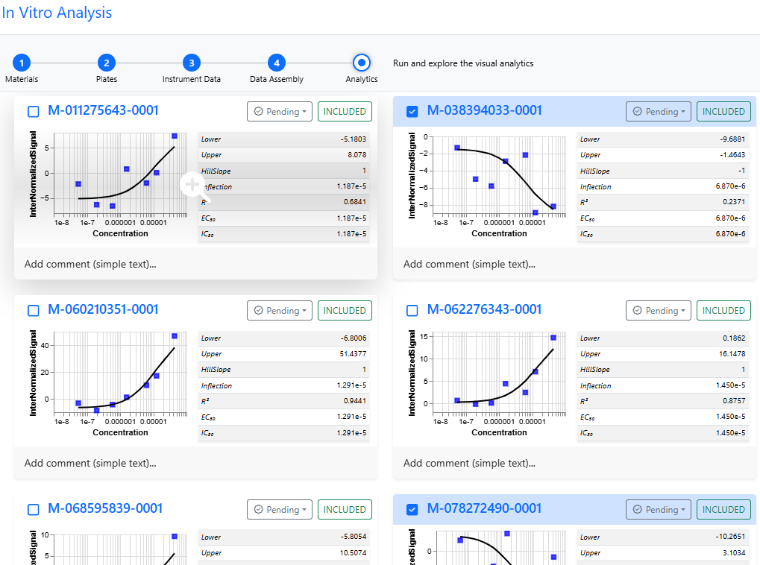
Additional QA/QC Metrics are now available at the level of plate wells (batches) as well as curve fits and can be visualized using the detailed views or the table view of the curve fits.

These new metrics include for each curve a Qualified Reported IC50, based on the maximum and minimum Percentage of positive Control (POC) and the respective dose associated, which can be published and used for decision making.

SAR & Decisioning

Image 5 from What's New 26.7_finalupdatedv2.docx
Image 6 from What's New 26.7_finalupdatedv2.docx

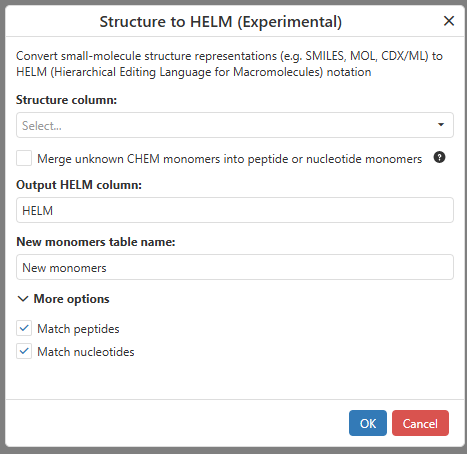
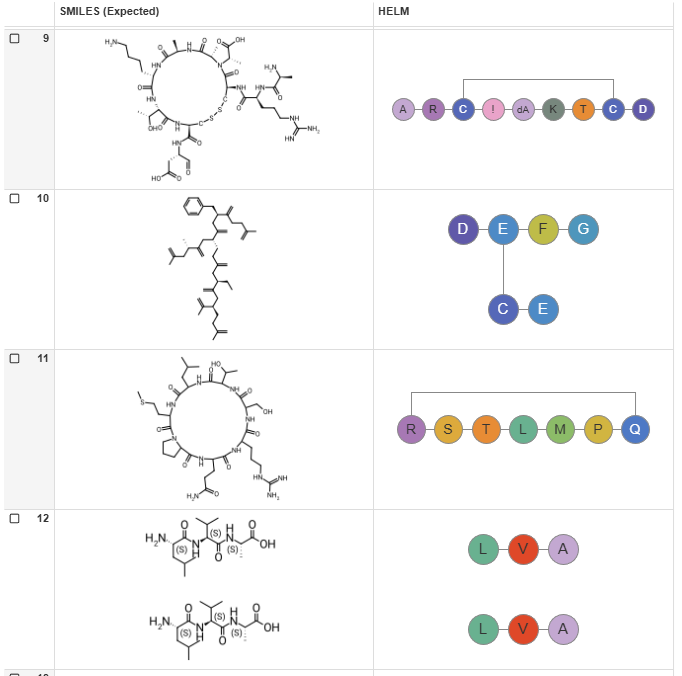
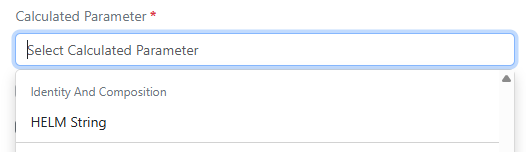
ChemChart’s Structure to HELM data function allows users to convert molecular structures from common chemical formats into HELM notation.
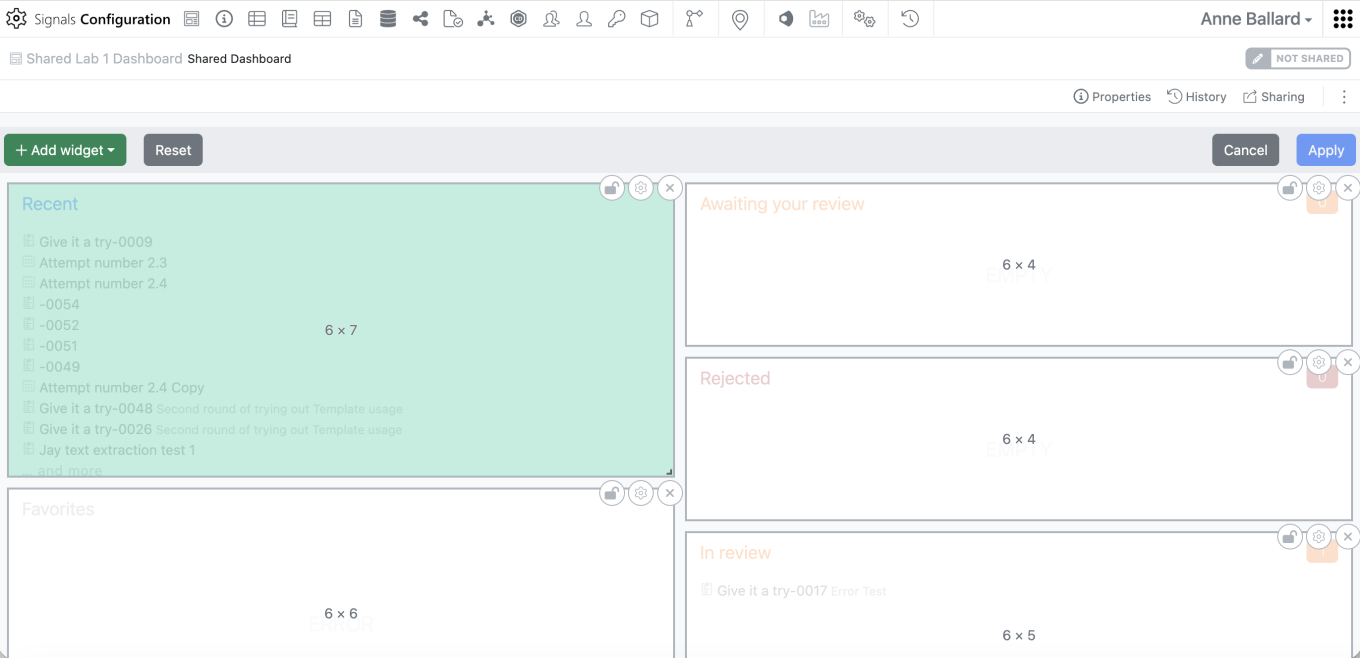
Image 7 from What's New 26.7_finalupdatedv2.docx

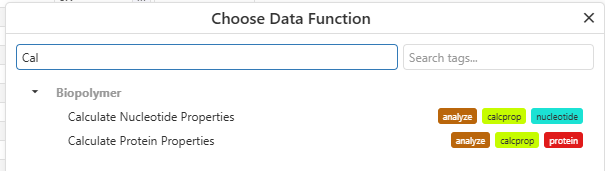
Users can now calculate nucleotide and protein properties directly within ChemCharts. Supported calculations include sequence composition, molecular weight, isoelectric point, aromaticity, extinction coefficients, and other commonly used nucleotide and protein metrics.
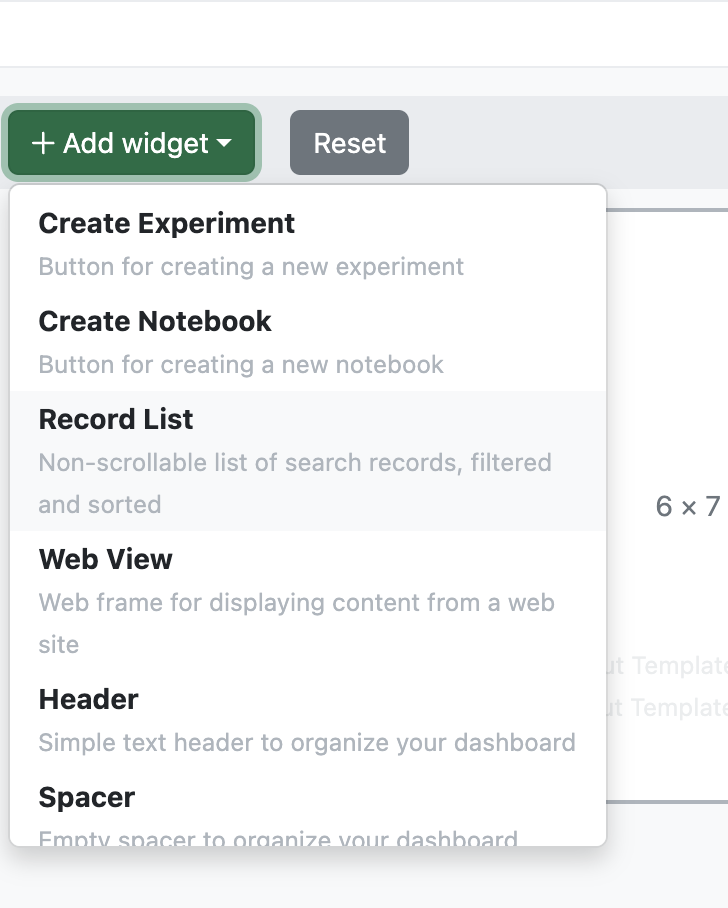
Image 8 from What's New 26.7_finalupdatedv2.docx

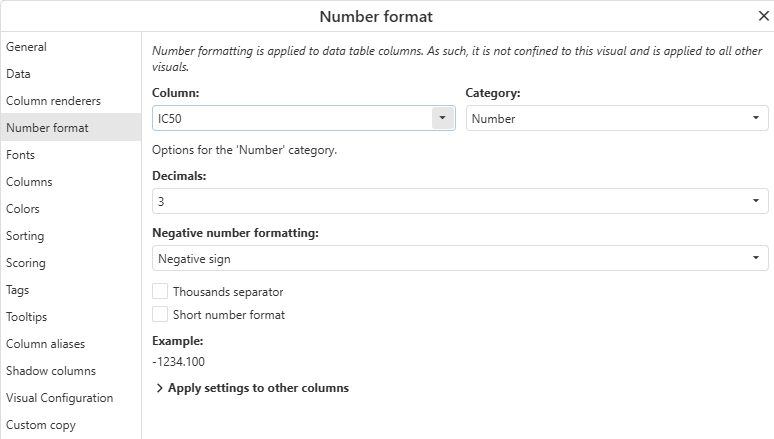
Users can now configure numeric column formatting directly from ChemCharts including decimal precision, scientific notation, and other details. Formatting settings can also be applied to multiple numeric columns at once for consistent data presentation across visualizations.

Synergy

Image 9 from What's New 26.7_finalupdatedv2.docx
Image 10 from What's New 26.7_finalupdatedv2.docx
Image 11 from What's New 26.7_finalupdatedv2.docx

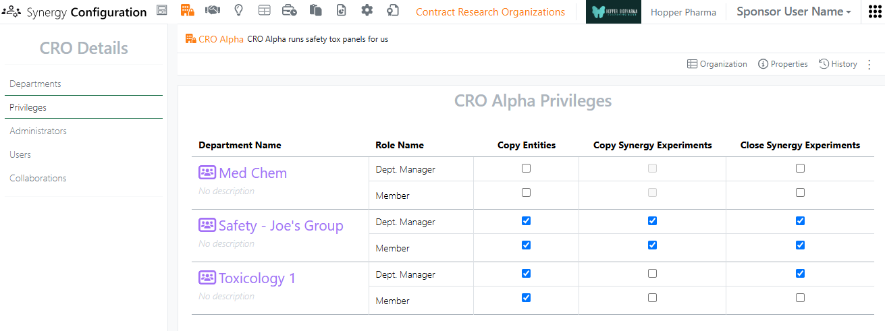
Release 26.6 introduced the concept of CRO privileges in Synergy Configuration. This release introduces a new CRO privilege for Close Synergy Experiments. By default, the Sponsor user is responsible for closing Synergy Experiments after they are submitted by the CRO. However, there are cases where the CRO closing their own Synergy Experiments may be more efficient without compromising necessary oversight. Now, the Close Synergy Experiments privilege is granted to CRO users on a per CRO Department basis, either to all members of the Department or only CRO Department Managers.

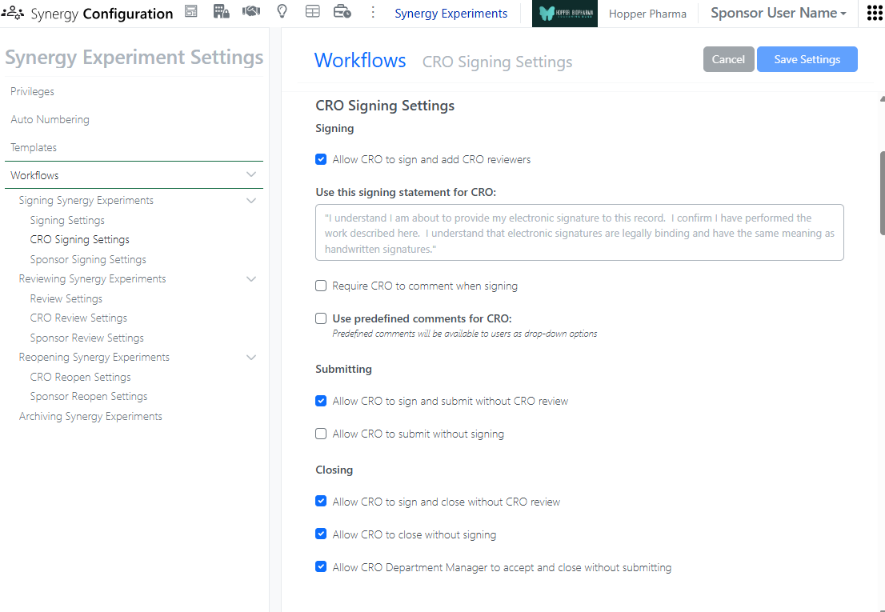
In order to allow privileged CRO users to Close their own Synergy Experiments, the Synergy Experiment Workflows (under Synergy Configuration > Synergy Experiments > Workflows) must also be configured to (i) Allow CRO to sign and close without CRO review, (ii) Allow CRO to close without signing, or (iii) Allow CRO Department Manager to accept and close without submitting. If Allow CRO to sign and close without CRO review is enabled, privileged CRO users will be able to transition a Synergy Experiment from Active to Closed using a Sign and Close option. If Allow CRO to close without signing is enabled, privileged CRO users will be able to transition a Synergy Experiment from Active to Closed using a Close option (no signing required). If Allow CRO Department Manager to accept and close without submitting is enabled, privileged CRO Department Manager will be able to transition a Synergy Experiment from In CRO Review to Closed using an Accept and Close option, when they are assigned as a Reviewer. If all the options are enabled, all options will be available to the CRO users.

Image 12 from What's New 26.7_finalupdatedv2.docx

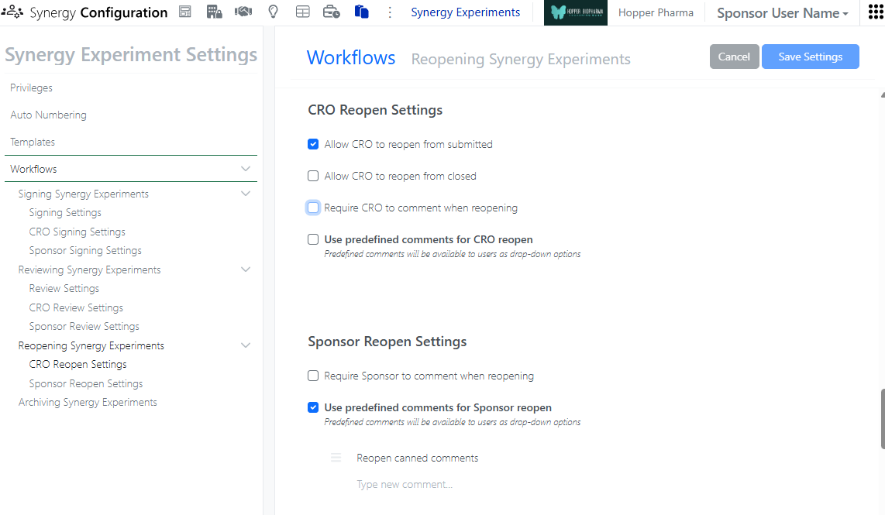
In addition, Synergy Experiment Workflows now provides options to allow CRO users to Reopen their experiments.

Image 13 from What's New 26.7_finalupdatedv2.docx

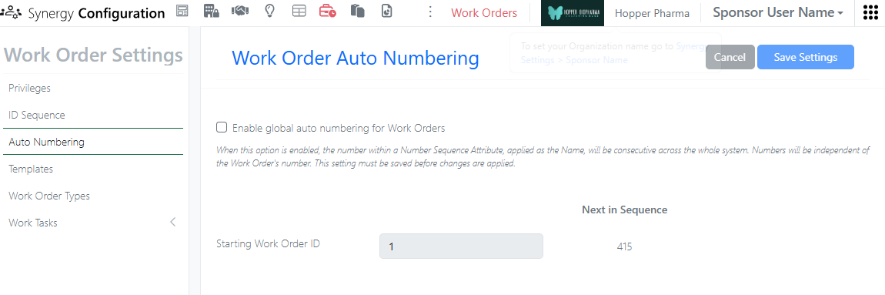
In Synergy Configuration, a Sponsor administrator with the privilege to Administer Synergy can now turn Work Order global auto numbering on or off. By default, Work Order global auto numbering is enabled; each new Work Order will take the next number in sequence, regardless of the Work Order ID sequence and regardless of the location. This is the recommended setting to ensure that Work Order naming is always unique. When Work Order global auto numbering is turned off, a new Work Order will take the next number in sequence in a given Collaboration. This allows sequential numbering of Work Orders within each Collaboration, but does not ensure unique Work Order naming. If global auto numbering is turned off, we recommend including the Collaboration Name in the Work Order ID sequence for clarity.

Image 14 from What's New 26.7_finalupdatedv2.docx

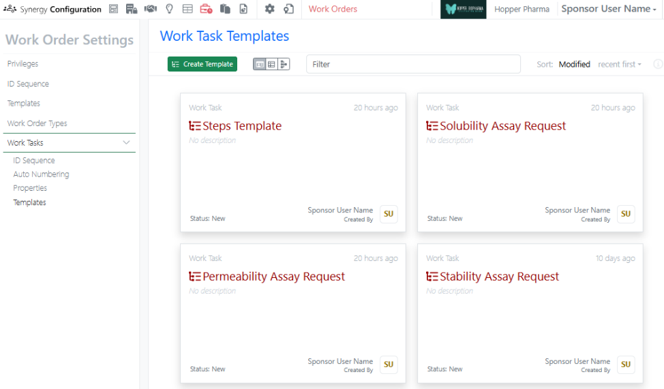
Work Tasks, which can be added to Work Orders, are now available to all systems. Work Tasks create a series of trackable, assignable, and templateable sub-tasks for a Work Order. Work Tasks can be configured in Synergy Configuration > Work Orders > Work Tasks.

Image 15 from What's New 26.7_finalupdatedv2.docx

Work Tasks can be associated with specific References (Reference IDs), specified Synergy Experiment Templates, and assigned to different CRO users. Note: When specifying a Synergy Experiment Template for a Work Task, Work Tasks can be added to Work Orders using Add Content or directly from a set of selected References in the Reference Table (new this release). For additional details about Work Tasks, please review What’s new content from 26.5 ad 26.6 or refer to the Help Center.

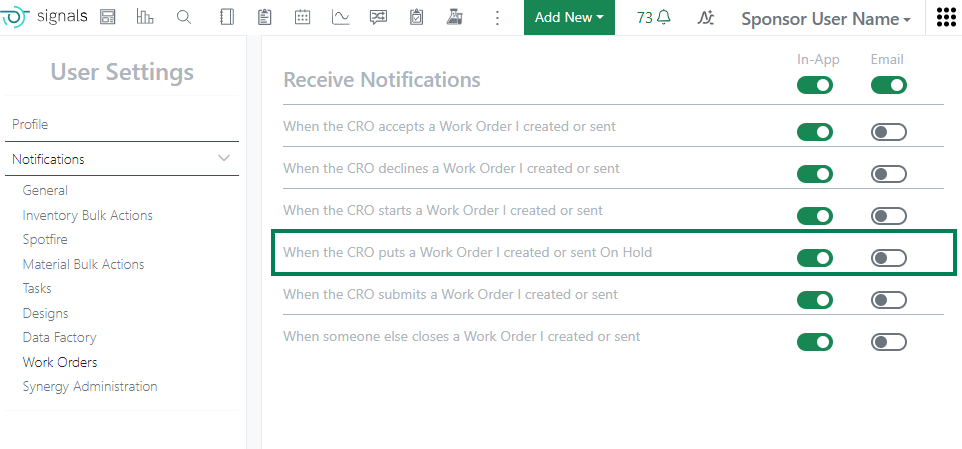
Two new notifications have been added related to Synergy. First, System and Synergy Administrators can now receive a notification when a CRO Administrator adds, removes (deactivates), or bulk uploads CRO users to their CRO. This allows the Sponsor to manage any required IdP changes (As a reminder, a CRO Administrator is a CRO user granted the Role CRO Admin. The CRO Administrator role is completely optional, but allows the Sponsor to delegate the responsibility of CRO user management to a trusted person(s) at the CRO). Second, CRO users can now receive a notification when a Work Order is recalled by the Sponsor. For both Sponsor and CRO users, notifications are configured under the User Name menu.

Chemistry

Image 16 from What's New 26.7_finalupdatedv2.docx

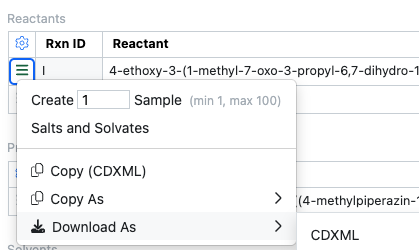
Chemists can copy or download individual chemical structures in CDXML or other chemical formats directly from the Reactants or Products tables. This is also available in content that is not editable such as Closed experiments.

Image 17 from What's New 26.7_finalupdatedv2.docx

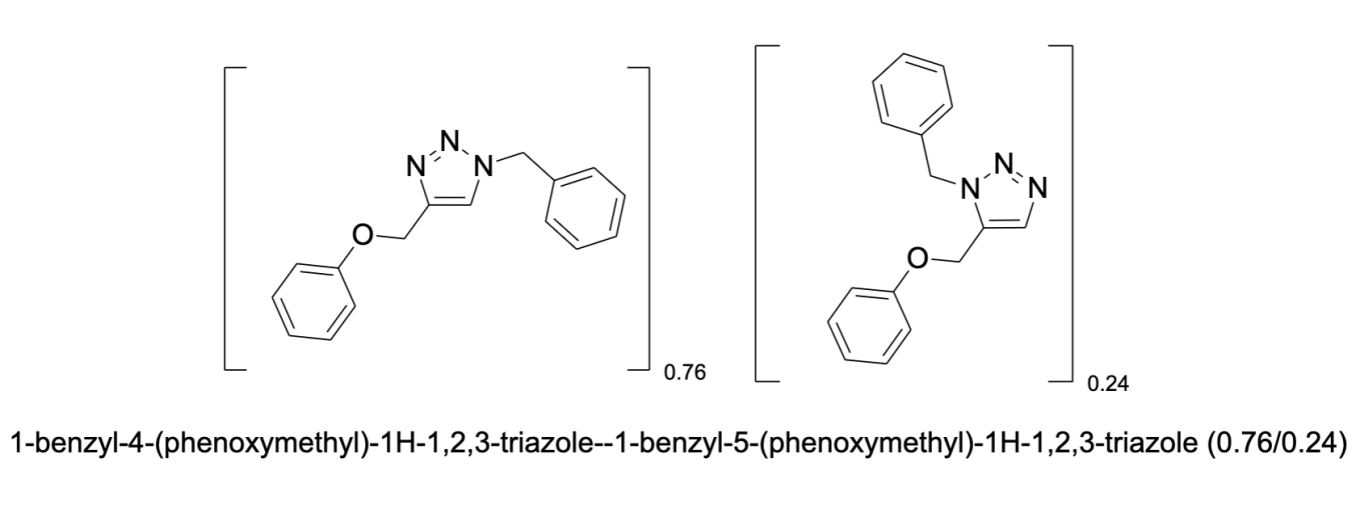
Mixture names in ChemDraw now reflect the assigned component ratios, ensuring generated names display the actual ratio values when custom ratios are defined.

Tables

Image 18 from What's New 26.7_finalupdatedv2.docx

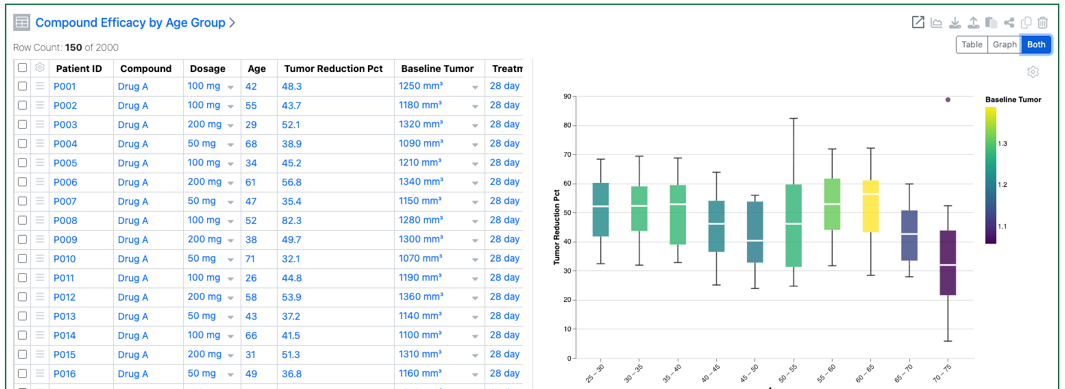
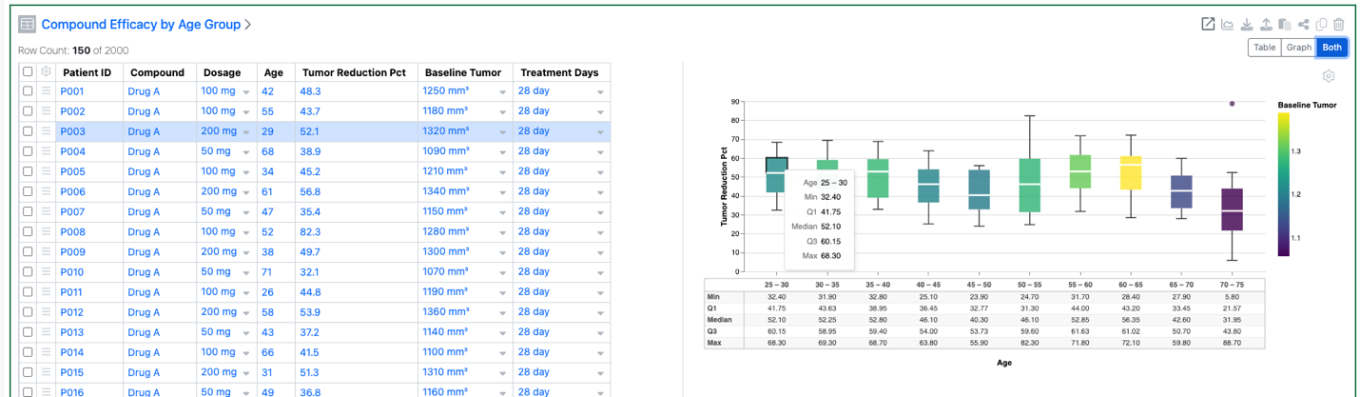
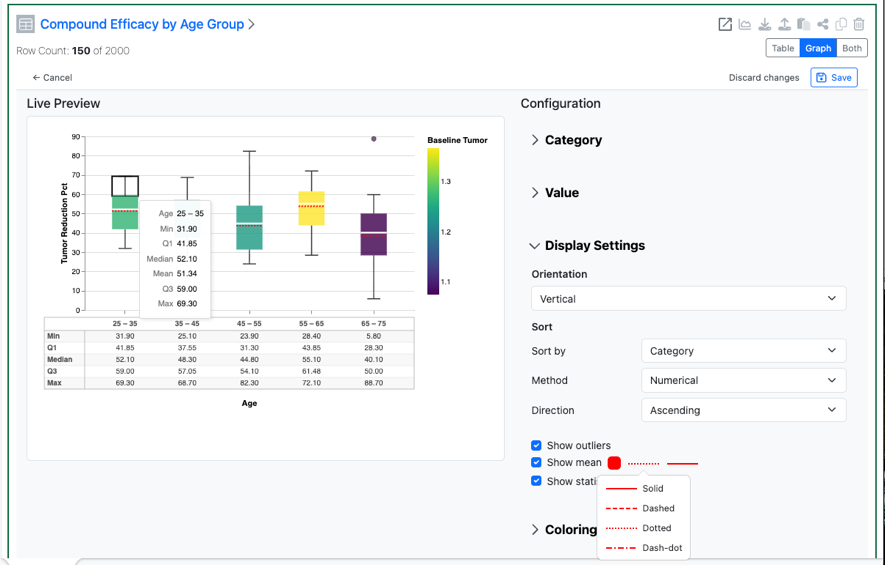
Numerical properties can now be bucketed and used on the categorical axes of a Box Plot. A numerical property can also be used to define the colors of the Box Plot

Image 19 from What's New 26.7_finalupdatedv2.docx

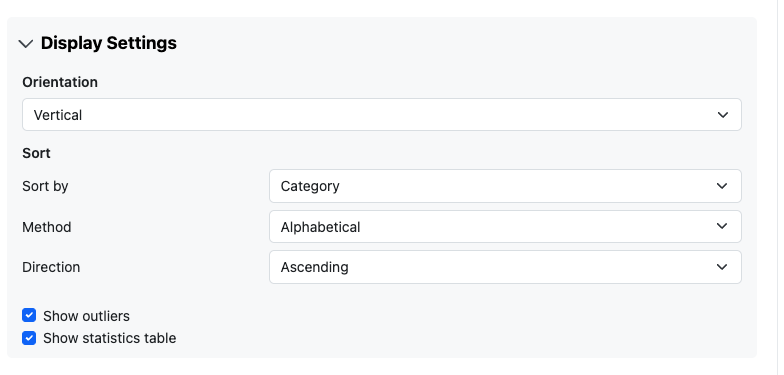
Box Plots can also be configured to show or hide outliers. They can also be configured to show a summary table of the statistics. The statistics table is only available for a vertical oriented box plot.

Image 20 from What's New 26.7_finalupdatedv2.docx

Hovering over a quadrant of the box plot will now highlight the associated rows, and visa-versa.

Image 21 from What's New 26.7_finalupdatedv2.docx

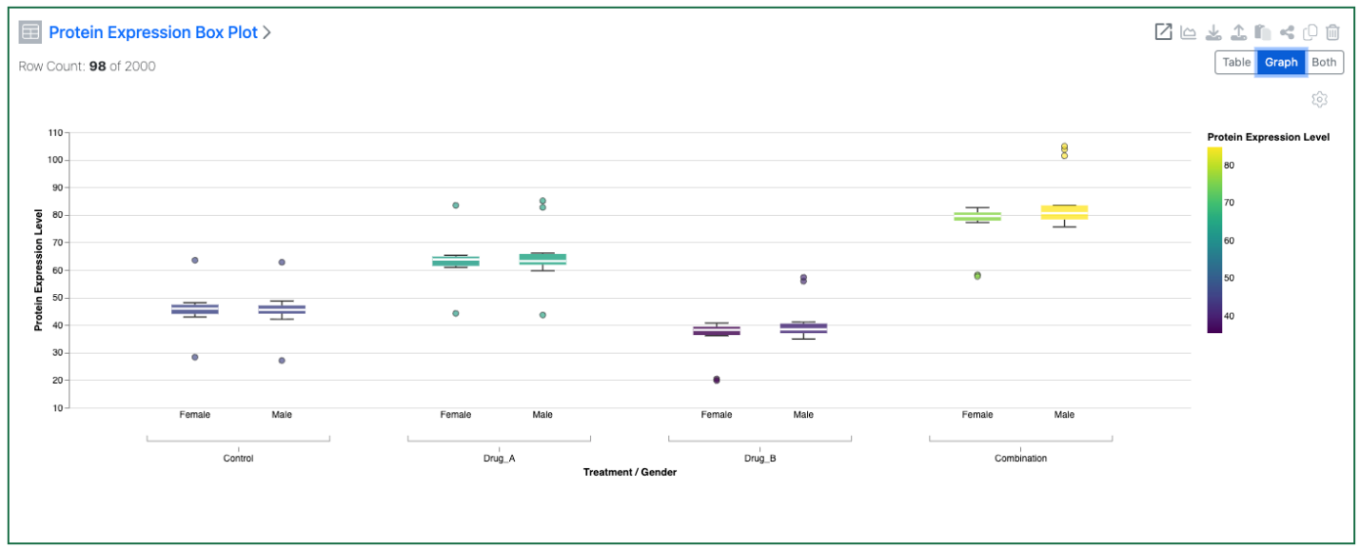
A second categorical property can also be added to the Categorical axis on Box Plots

Image 22 from What's New 26.7_finalupdatedv2.docx
Image 23 from What's New 26.7_finalupdatedv2.docx

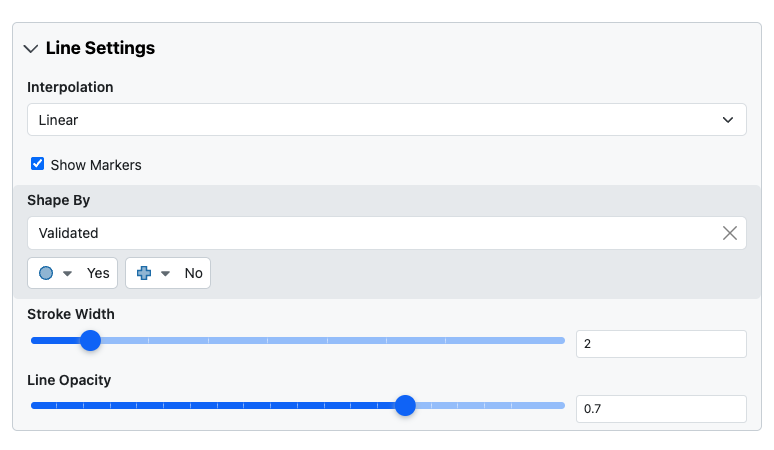
Markers on Line Charts can now be set by values in a categorical column. This option is only available if the Y axes are not aggregated.

Image 24 from What's New 26.7_finalupdatedv2.docx

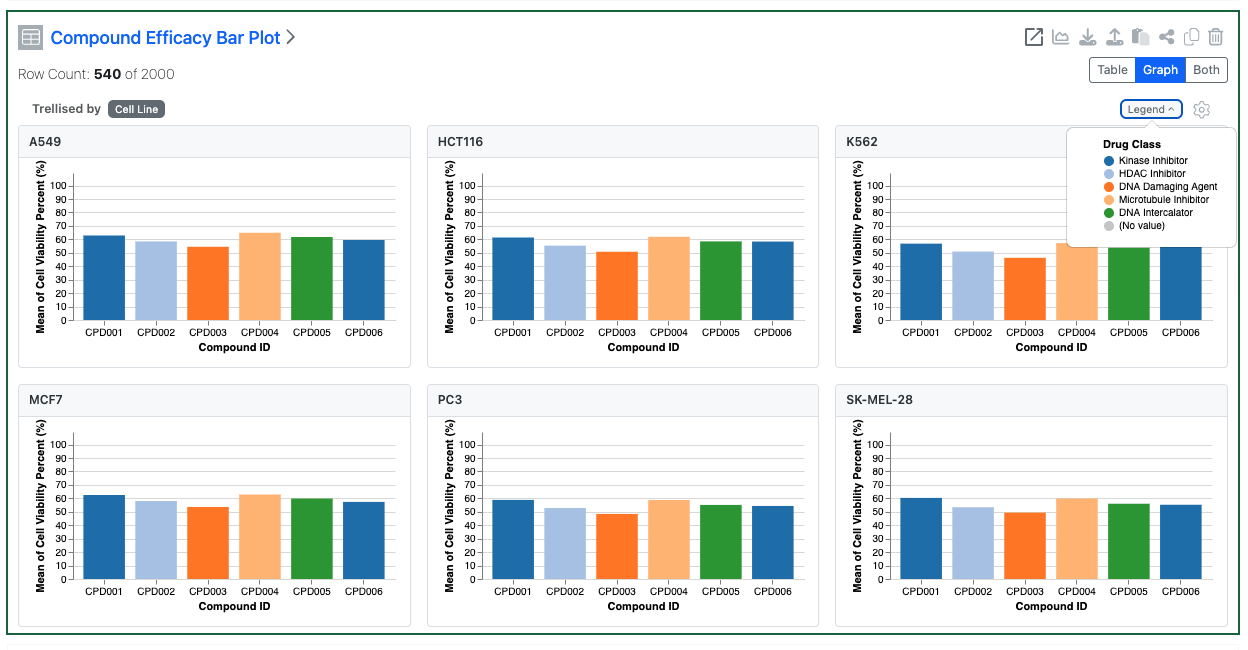
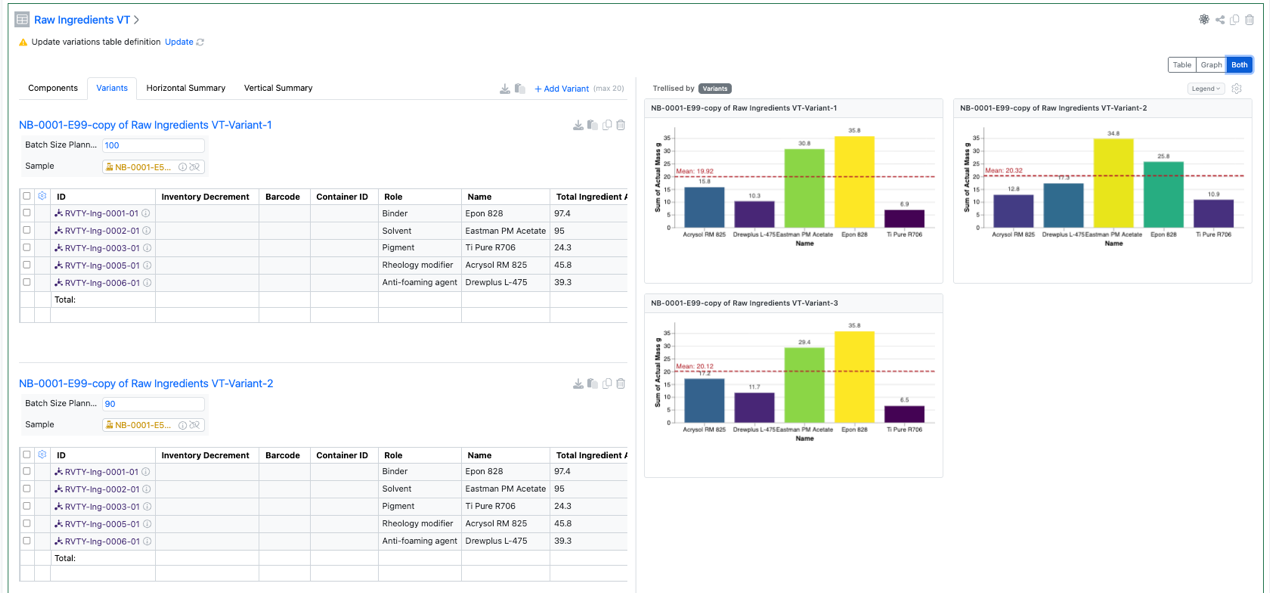
Tables can now be configured to display multiple charts, trellised via a categorical column. Configuration options include optionally setting the number of columns and setting if the trellised charts have synchronized axes.

Image 25 from What's New 26.7_finalupdatedv2.docx

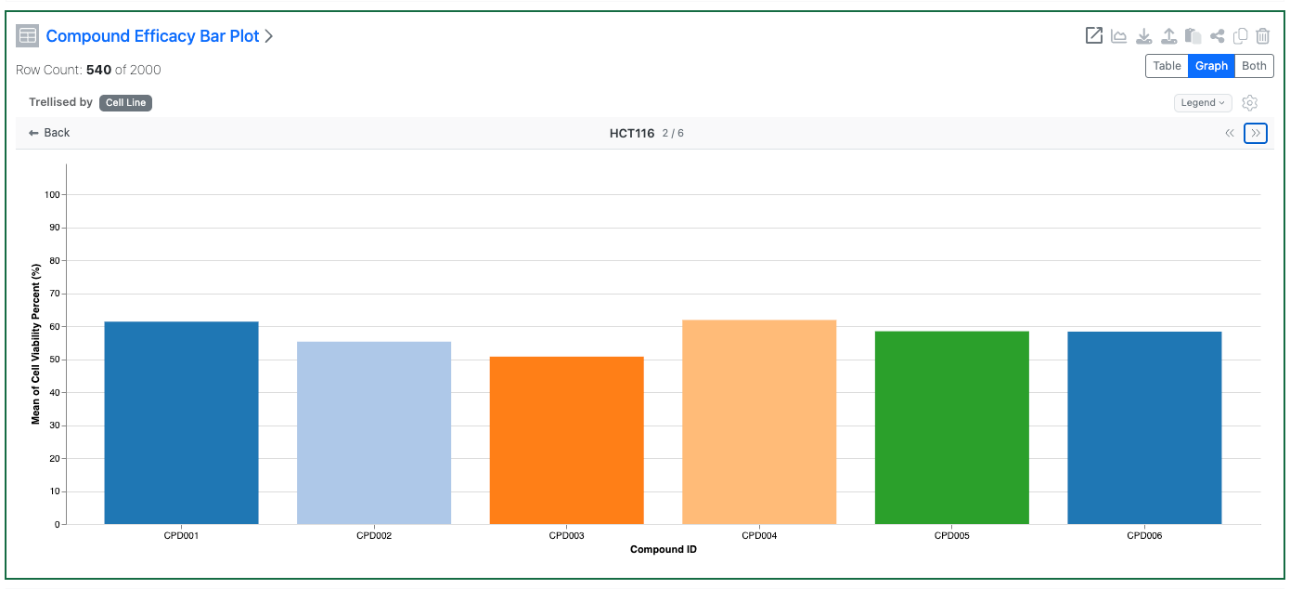
The user can choose to focus on a single trellised chart in more detail and iterate through the charts.

Inventory

Image 26 from What's New 26.7_finalupdatedv2.docx
Image 27 from What's New 26.7_finalupdatedv2.docx

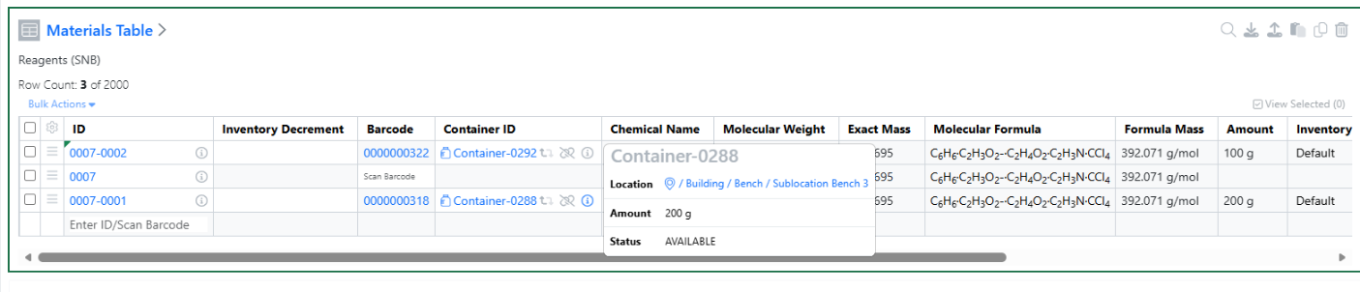
Added quick access to container location details directly from the Stoichiometry and Materials tables, allowing users to verify container information without leaving their current workflow.

Image 28 from What's New 26.7_finalupdatedv2.docx

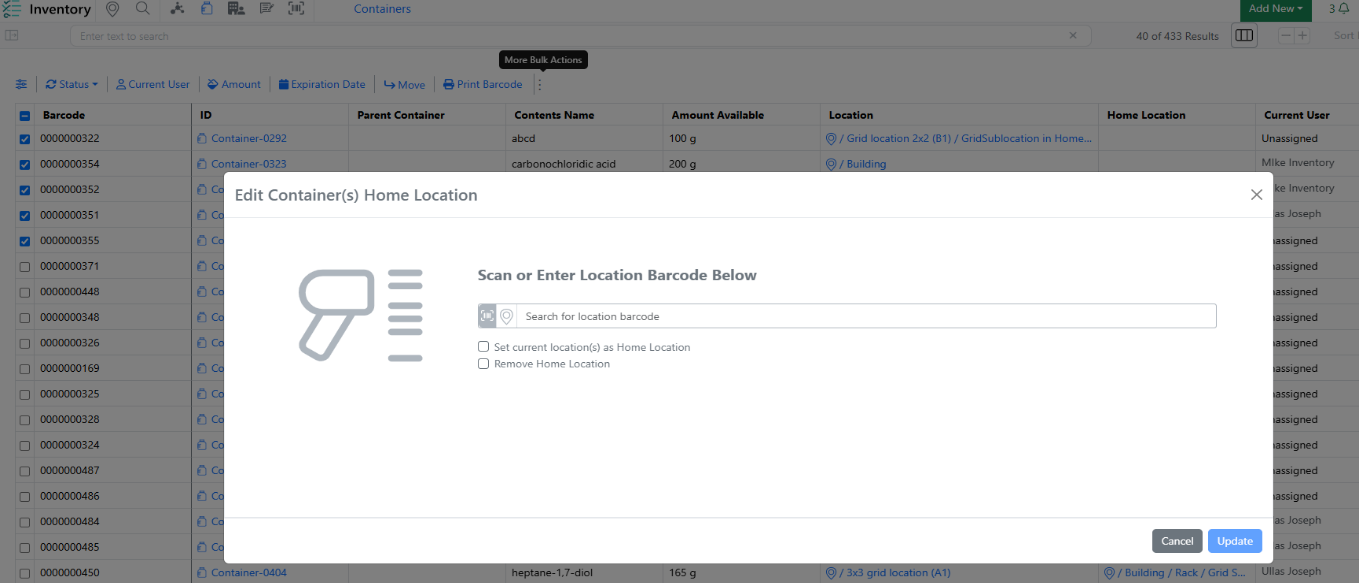
Bulk Edit Home Locations now supports blank Home Location values, providing greater flexibility when updating container location assignments. Users can now clear or leave Home Location values blank during bulk updates, simplifying location management and reducing manual effort.

Image 29 from What's New 26.7_finalupdatedv2.docx

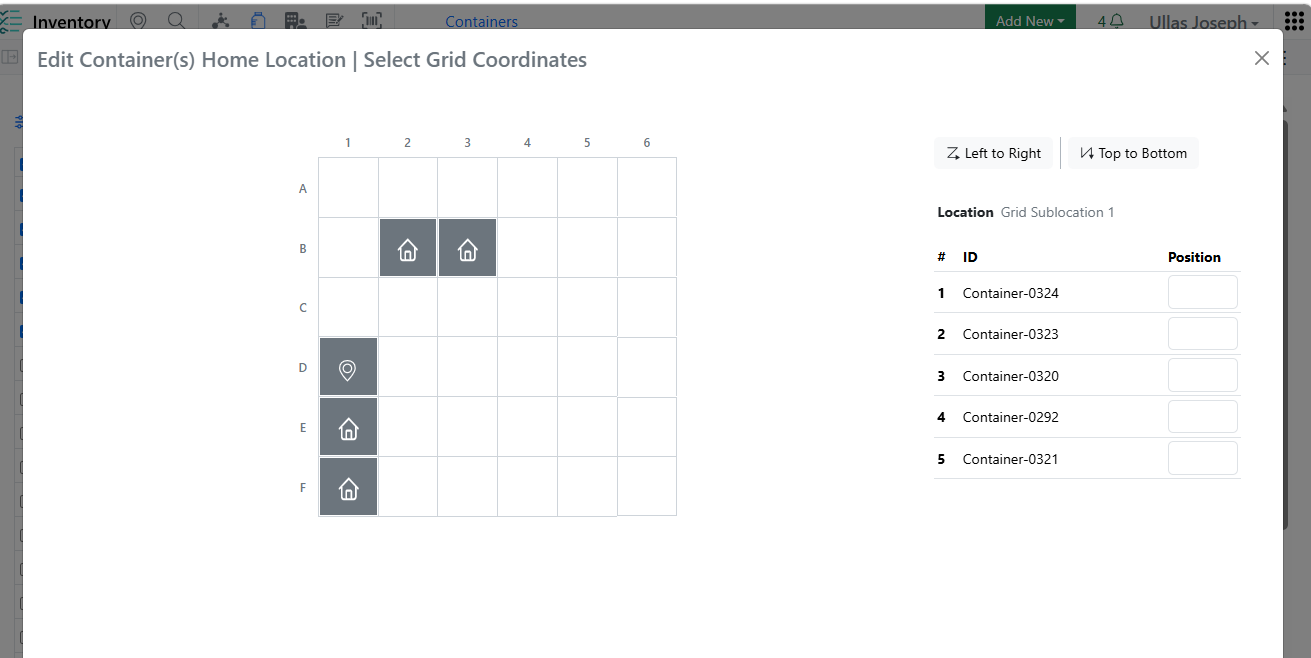
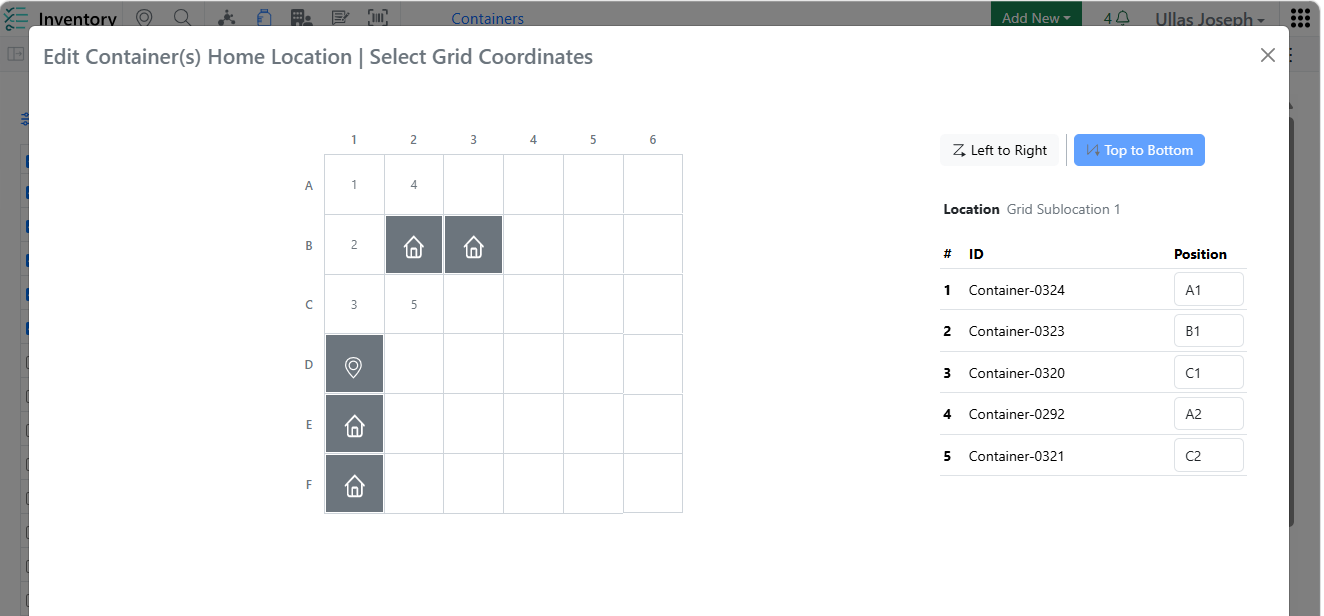
Enhanced Home Location assignment across Create/Edit Grid Location and Bulk Edit workflows with visual indicators and validation rules to ensure Home Location uniqueness and improve data accuracy.

Image 30 from What's New 26.7_finalupdatedv2.docx

Improved the Auto Fill Grids logic to automatically select occupied grid cells while skipping only those designated as Home Locations, making container assignments faster and more intuitive.

Image 31 from What's New 26.7_finalupdatedv2.docx

Added row-level warning indicators in Inventory Decrement Auto Fill to clearly identify containers that are not eligible for inventory decrement, helping users avoid errors while maintaining workflow efficiency.

Image 32 from What's New 26.7_finalupdatedv2.docx

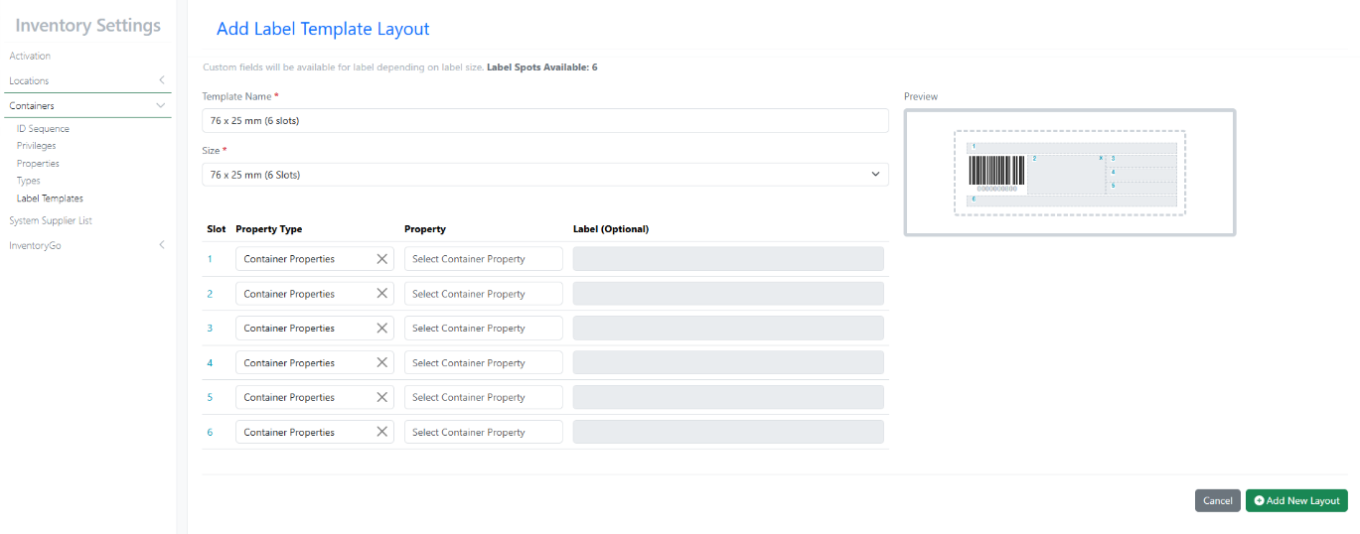
New Label Templates 76×25 mm (6 Slots)

Image 33 from What's New 26.7_finalupdatedv2.docx

New Label Templates 62×29 mm QR

InventoryGo

Image 34 from What's New 26.7_finalupdatedv2.docx
Image 35 from What's New 26.7_finalupdatedv2.docx

Users can now select a specific grid position during Check In and Check Out operations, providing greater control over container placement and improving location accuracy.

Image 36 from What's New 26.7_finalupdatedv2.docx

Reconciliation reports now include Material ID and Expiration Date information, providing better traceability and supporting more effective inventory audits and reviews.

Image 37 from What's New 26.7_finalupdatedv2.docx

Added confirmation prompts for delete actions in Reconciliation and Consume workflows to help prevent accidental data changes and improve user confidence.

Image 38 from What's New 26.7_finalupdatedv2.docx
Image 39 from What's New 26.7_finalupdatedv2.docx

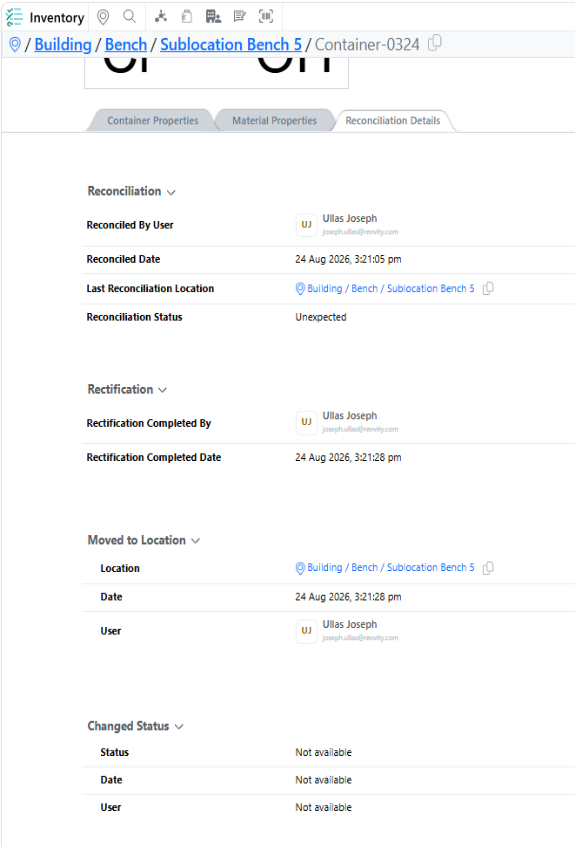
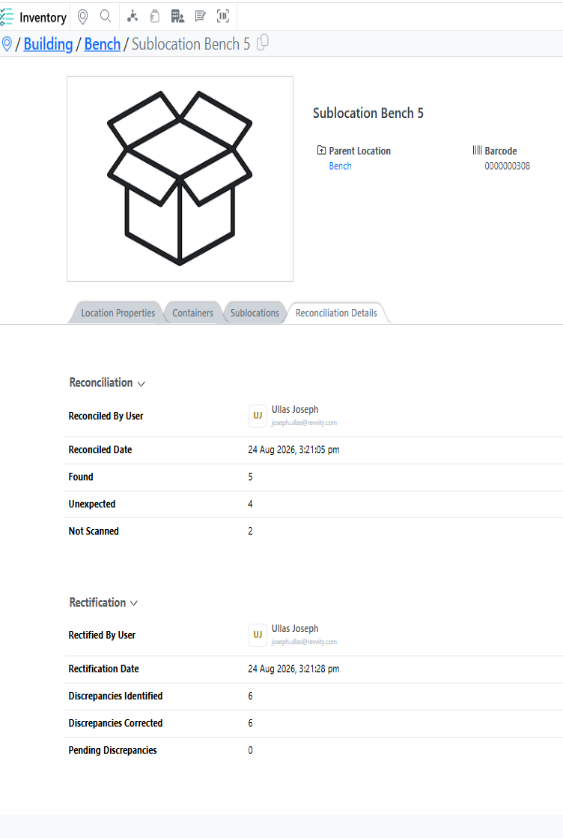
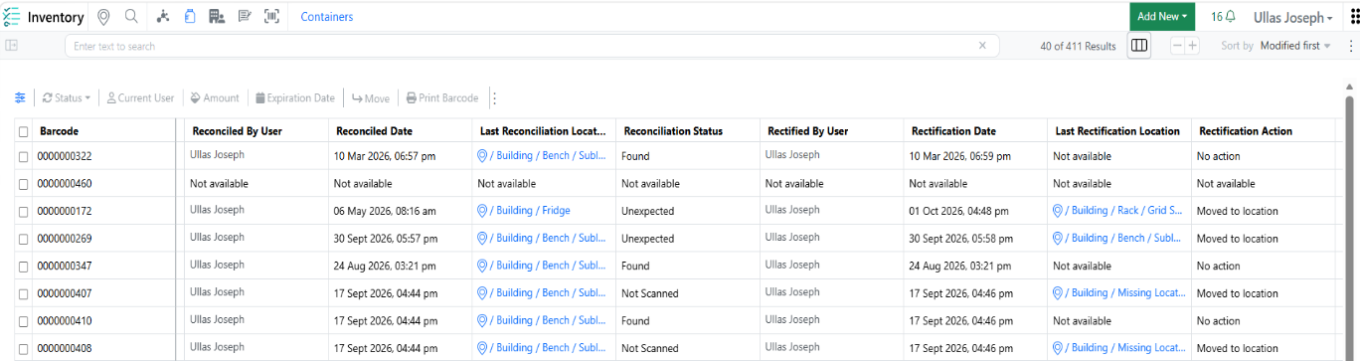
Reconciliation details are now available directly within the Inventory application for both locations and containers, providing greater visibility into reconciliation activities without leaving the inventory workflow.

Tasks and Requests

Image 40 from What's New 26.7_finalupdatedv2.docx

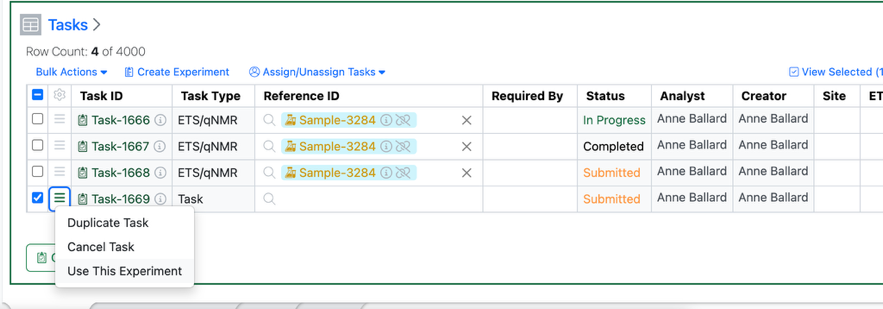
Users will now have the option of completing a Task within the originating experiment assuming the user 1) has write access to the task’s originating experiment and 2) the user in question is assigned the task.

Image 41 from What's New 26.7_finalupdatedv2.docx

If both of these criteria are met, the new “Use This Experiment” option will be available under the hamburger menu and the Bulk Actions menu.

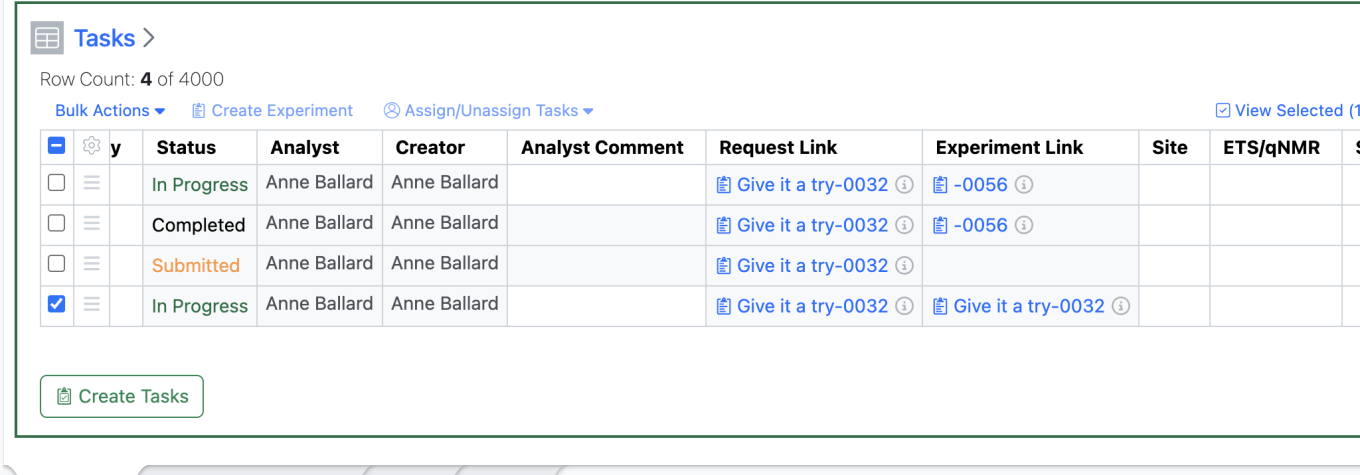
Selecting “Use this Experiment” updates the Task Status to “In Progress” updates the “Experiment Link” to the same Experiment as the “Request Link” and opens up the Analyst fields for the user to update in the Task Table.

This will also allow the analyst/user to transition the Task to “Closed” from this same table allowing the user to complete their task workflow within the same experiment.

Administration

Image 42 from What's New 26.7_finalupdatedv2.docx
Image 43 from What's New 26.7_finalupdatedv2.docx

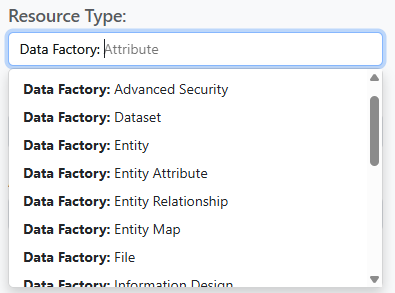
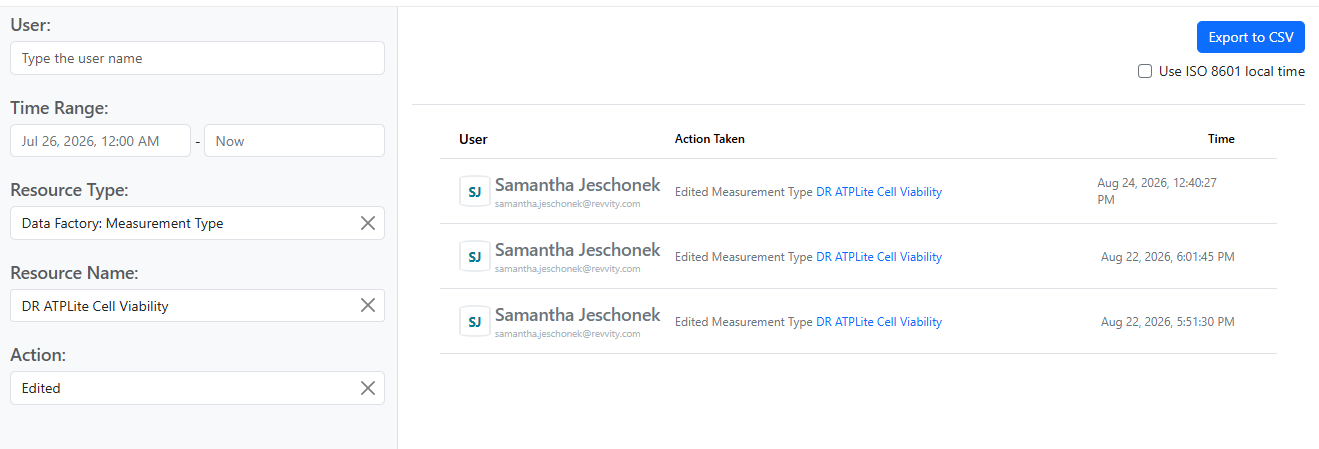
Data Factory audit events are now accessible from the Signals Audit Log. Data Factory actions are organized by Resource Type, and can be further filtered by Resource Name and Action.

Integrations & APIs

Image 44 from What's New 26.7_finalupdatedv2.docx

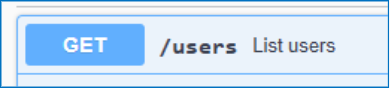
We have added new APIs to revoke bearer tokens via API. Bearer tokens can be revoked by email or for all users simultaneously.

Image 45 from What's New 26.7_finalupdatedv2.docx


We have enhanced the Material Fetch APIs to support expanded Chemical Structures output. A new URL parameter “structureFormat” is optionally available. The structure is returned as json encoded strings.

Image 46 from What's New 26.7_finalupdatedv2.docx

We have enhanced the External Enumerator APIs to support RDF files. The “Content-Type” header must best set to “chemical/x-mdl-rdfile".

Image 47 from What's New 26.7_finalupdatedv2.docx

We have added a new API to fetch JSON formatted parser definitions.

The following capabilities are in beta and are available for users, administrators and developers on the Signals platform upon request. Please contact your account representative or our support team if you would like access to the following features.

Fundamentals

Image 48 from What's New 26.7_finalupdatedv2.docx

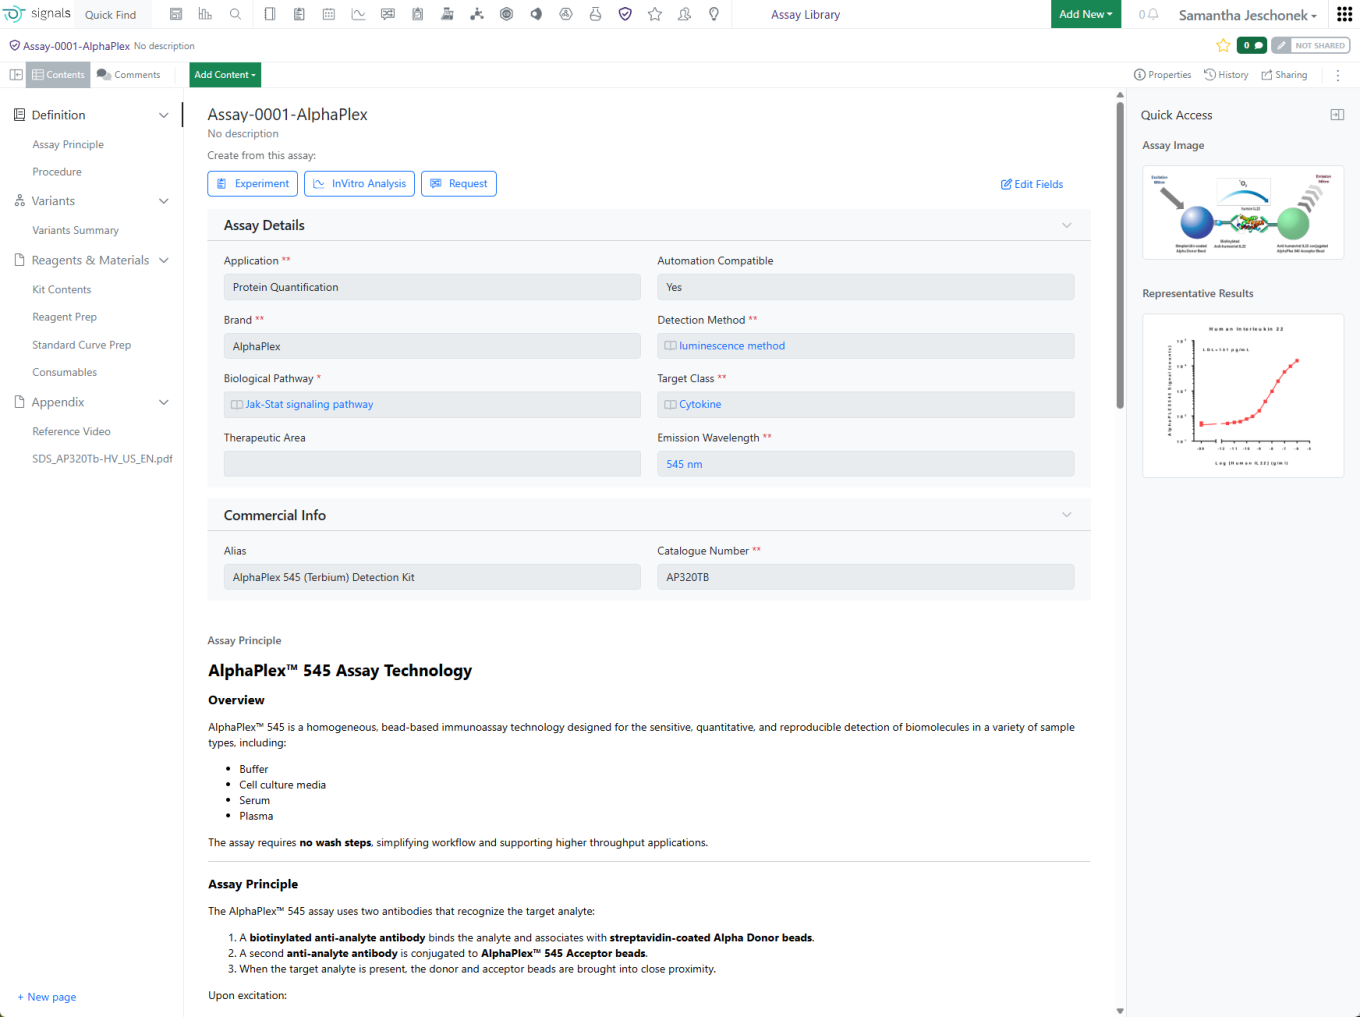
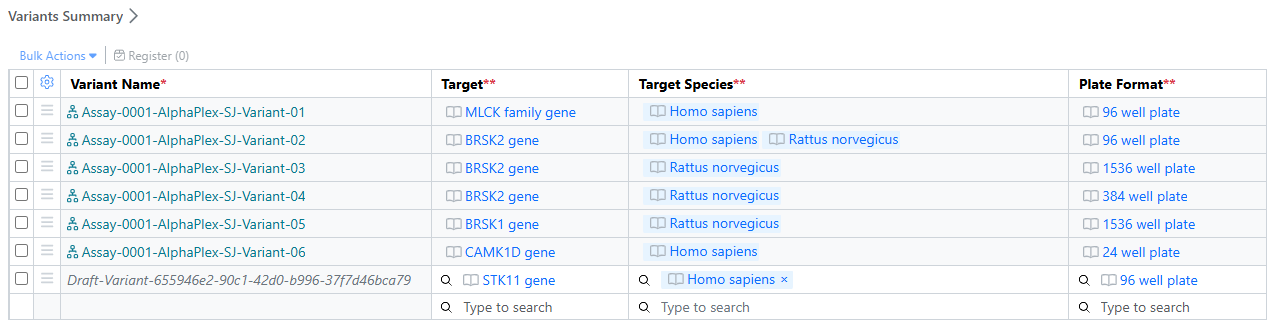
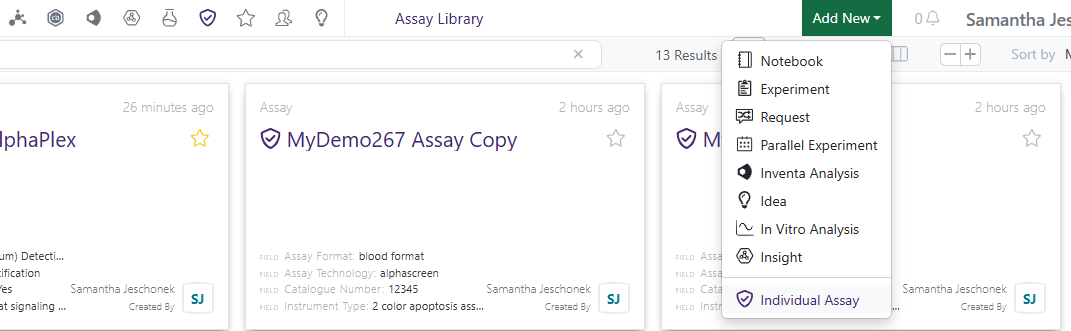
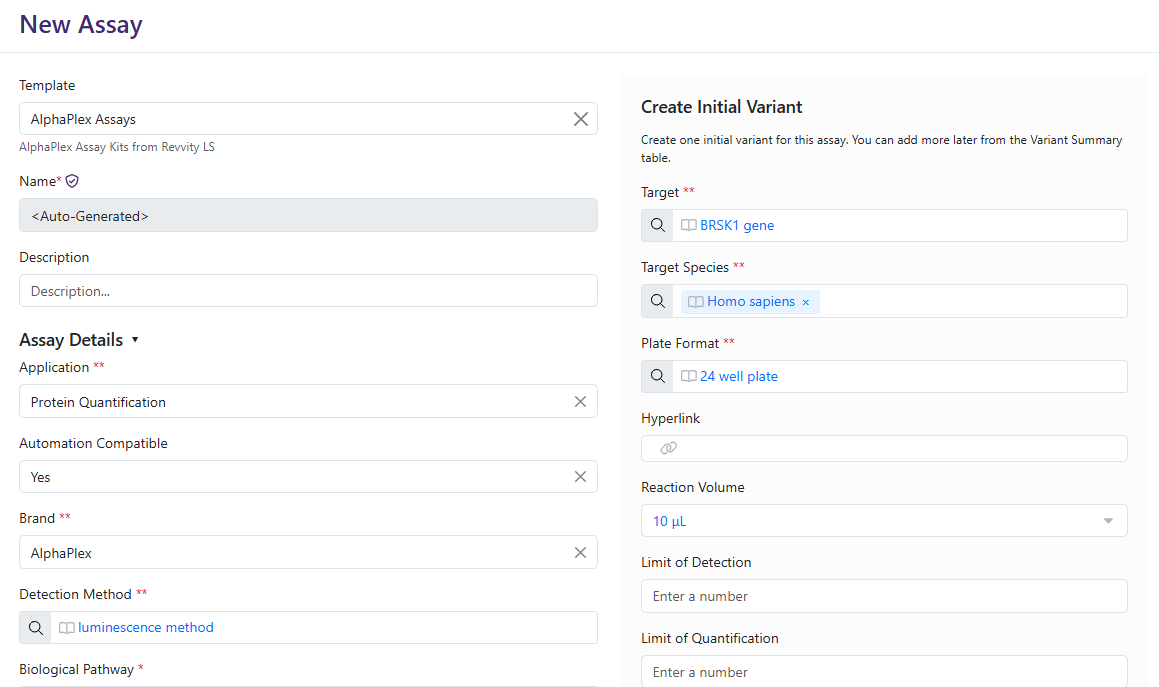
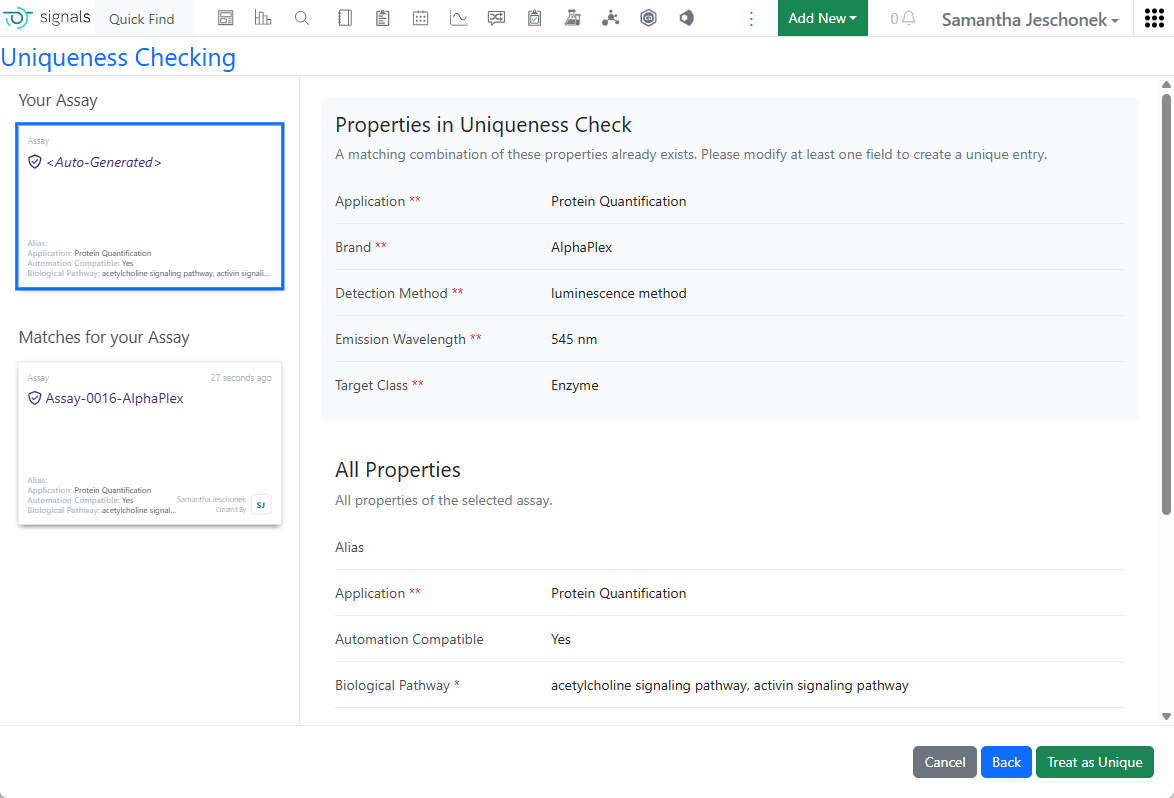
The Assay Library (beta) enables organizations to register unique Assays and their associated Variants in a centralized repository. Assay and Variant metadata are captured in structured templates, helping standardize assay definitions and improve consistency.

Assays include one or more Variants, allowing users to represent planned experimental differences such as target, cell line, plate format, or other assay conditions while maintaining a clear relationship to the parent assay.

Administrators configure reusable Controlled Fields to enforce standardized terminology across assay registrations. As part of the Assay Template, these fields can also be designated for uniqueness checking.

When registering a new assay, the system automatically evaluates configured uniqueness criteria and alerts users when a potentially duplicate assay already exists.

Assays provide a structured overview of key metadata, supporting content, and registered variants within a single record.

Image 49 from What's New 26.7_finalupdatedv2.docx

The Variant Summary provides a consolidated view of assay variants and their key attributes, making it easier to compare experimental conditions.

Image 50 from What's New 26.7_finalupdatedv2.docx

Controlled Fields allow organizations to standardize terminology across different assay templates, which encourages better data governance and discoverability.

Image 51 from What's New 26.7_finalupdatedv2.docx

When creating an Assay template, administrators must choose from the list of predefined Controlled Fields. Fields can be organized into sections for clearer organization. Configurable uniqueness checking helps prevent duplicate assay registrations by evaluating a defined combination of assay properties and alerting users when similar assays already exist.

Image 52 from What's New 26.7_finalupdatedv2.docx
Image 53 from What's New 26.7_finalupdatedv2.docx

Once Assays are activated and a template is created, shared, and registration privileges defined, Signals One licensed users can begin to register assays. The Assay Library is available from the navigation tool bar.

Image 54 from What's New 26.7_finalupdatedv2.docx

Assay and the initial Variant registration occur together.

Configurable uniqueness checking helps prevent duplicate assay registrations by evaluating a defined combination of assay properties and alerting users when similar assays already exist.

AI

Image 55 from What's New 26.7_finalupdatedv2.docx

Signals AI Explorer is the AI assistant built into Signals Notebook. It helps you explore and understand your Signals Notebook data using natural language instead of manual searching.

Explorer’s Thinking panel lists every step it took to answer a question — for example, establishing who is asking, then finding that user’s experiments, notebooks and pending reviews before responding.

Image 56 from What's New 26.7_finalupdatedv2.docx

Answers come back as real tables built from your records, with the highlights called out, what is waiting on you, and sensible follow-up questions offered.

Image 57 from What's New 26.7_finalupdatedv2.docx

When you ask about an open experiment, the Context line lists exactly what Explorer pulled in — the experiment, the chart, and the rest of its contents.

Image 59 from What's New 26.7_finalupdatedv2.docx
Image 60 from What's New 26.7_finalupdatedv2.docx

Explorer can build hypotheses nobody wrote a report for, laying out a mechanism-of-action hypothesis from experiment data and diagramming the pathway, with every observation linked back to the experiment it came from.

It shows its working and its doubts: building the mechanism from the same records, drawing it, and stating plainly what the data cannot yet support, with follow-up questions offered to close each gap.

Image 61 from What's New 26.7_finalupdatedv2.docx

Explorer will also tell you when the data does not support a stated conclusion — for example, reading a gel table, comparing it with the recorded write-up, flagging that a ‘no contamination’ conclusion is not supported, and suggesting how to resolve it.

Synergy

Image 62 from What's New 26.7_finalupdatedv2.docx

The Synergy Data Exchange is powerful feature that converts unstructured, excel-based reports from CROs into structured, columnar Results Tables ready to use in Data Factory. Under beta, Data Exchange Results Tables can now be published directly from Synergy Experiments.

To publish Data Exchange Results Tables, the administrator must first configure the specific Data Exchange Transformation for publication. In Synergy Configuration > Data Exchange > Library, select a Transformation. In the upper right, click Data Factory Mapping and then Add New Mapping.

Image 63 from What's New 26.7_finalupdatedv2.docx

A map specifies which columns to publish to which Data Factory Measurement Type Attribute and is specific to a Data Factory Project and Measurement Type. First, the administrator selects a Data Factory Measurement Type for the Summary Results Table and then maps the Results Table columns (left) to the Measurement Type Attributes (right). (The system will attempt to auto-map the columns but values should be adjusted as needed.) When the map is complete, press Save Map.

Image 64 from What's New 26.7_finalupdatedv2.docx

Most Transformations produce pairs of Results Tables, such as a Summary table of the calculated endpoints and a Well Details table of the individual measurements. Mapping the Well Details table is optional. The Measurement Type for the Well Details table must a be a child/details Measurement Type for the Summary table Measurement Type. When published together, these Summary and Well Details data will be automatically joined in Data Factory via the Join Value in the Results Tables.

Image 65 from What's New 26.7_finalupdatedv2.docx

After mapping is complete, Activate publishing. The Transformation card will then show a green mapping icon indicating that publishing is activated.

Image 66 from What's New 26.7_finalupdatedv2.docx

Note, to publish Data Exchange Results Tables, the Synergy Experiment must also be mapped and activated for publishing. To map and activate publishing for a Synergy Experiment Template, go to Synergy Configuration > Synergy Experiments > specific Template > Data Factory Mapping. Here the fields of the Synergy Experiment Template, including those which are Hidden from CRO, can be mapped to Data Factory Attributes and will be included in any publication from this type of Synergy Experiment.

Image 67 from What's New 26.7_finalupdatedv2.docx
Image 68 from What's New 26.7_finalupdatedv2.docx

In Synergy, the Sponsor can then publish results from a Data Exchange with this Transformation. First, the Data Exchange element is added to a Synergy Experiment which is activated for publishing and the Transformation is selected. When the CRO user adds the report to the Data Exchange, the Results Tables are automatically populated. After submitting the Synergy Experiment, the Sponsor user selects the Data Factory Project for publication in the Properties (if not already selected) and presses the green Publish button in the upper right corner of the Synergy Experiment. The Sponsor is presented with all tables for publication, which may include Tables and Data Exchange Results Tables. After publication, a notification is provided and the Publication results can be reviewed under Publication in the toolbar.

Xynthetica

Image 69 from What's New 26.7_finalupdatedv2.docx

Xynthetica is an AI inference feature currently in Beta. Tenants with Xynthetica beta access can now use AI models in ChemCharts to model predictive properties via Inventa.

Image 70 from What's New 26.7_finalupdatedv2.docx
Image 71 from What's New 26.7_finalupdatedv2.docx

Users can edit in Spotfire as expected. When users select data functions, they will have access to inference models under MaaS (Models-as-a-Service).

Image 72 from What's New 26.7_finalupdatedv2.docx
Image 73 from What's New 26.7_finalupdatedv2.docx

Users should select parameters of interest and progress will display in the lower right as the model computes.

Image 74 from What's New 26.7_finalupdatedv2.docx

Calculations will appear in the table, after which users can graph conventionally.

What's New

We are delighted to release our new version of Signals, 26.8.

The following improvements are available for users, administrators and developers on the Signals platform. Certain features may only be available with appropriate licensing and/or with enablement by an administrator.

  • Fundamentals
    - SMILES management in Solvate list
    - Product selection on Bulk Sample creation in Parallel Experiments
    - Mapping of HELM string in External Enumerator
    - Audit trail displays highlighted granular changes for structured tables such as hierarchical tables, variations tables, materials tables, etc is available to all systems
    - Audit trail displays highlighted granular changes for worksheets is available to all systems
    - Audit trail displays highlighted granular changes for ChemDraw Stoich Grid
    - Manage assay variant lifecycles and compliance* (beta)
  • Data Workflows & Analytics*
    - Create and assign custom parameter sets
    - Fit linear concentration data using new system Agonist and Antagonist dose-response models
  • SAR & Decisioning*
    - Use Insights to query, generate, and analyze Measurement and SAR Tables directly in Signals is available to all systems
    - Explore key results faster in Insights with a cleaner default SAR table and dynamic chemical structure filtering directly
    - ChemCharts: New antibody engineering and molecule alignment data functions, plus updates to visualization settings including visual cloning and per-column tooltips
  • Synergy†
    - Designs now support LogP, predicted pKa, Labute ASA, and other calculated properties
    - Designs import now supports CSV with HELM notation
    - Work Order properties can inherit from Collaboration properties
    - CRO users can print Synergy Experiments to PDF
    - New Sponsor notification when a CRO user puts a Work Order On Hold
    - Audit trail displays highlighted granular changes for Design tables
  • Tables
    - Default values for Headers and Properties in Admin Defined Tables and Variation Tables
    - Default values for Headers and Properties in Hierarchical Tables*
    - Display Mean in Box Plots*
    - Define Reference Lines on charts*
    - Define charts on Variation Tables*
  • Plates
    - Hide column in table when Annotation layer is hidden
  • Inventory
    - Record consumed quantities directly from a container while automatically tracking the remaining balance and vice versa
    - Support for Material Orders custom field types
    - Faster Quick Add Workflow in ChemDraw Document
    - Prevent the creation of grid sub-locations within designated home location cells
    - New Container Label Templates - 50 x 30 mm (QR Code) and 50 x 30 mm (4 slots)
    - Design and customize Inventory label templates layouts (beta)
    - Reconciliation and Rectification details added to Container Search Table
  • InventoryGo ‡
    - Support for Barcode and QR Code Scanning via Camera scanning
  • Materials
    - Bulk update materials tables
    - HELM String calculated property
  • ELN Archive
    - Combined ELN Archive and Signals Search (beta)
  • Administration
    - Configure Data Factory maps to support user-defined fixed values*
  • Integrations & APIs
    - Create Material Order via API
    - FASTA support for writing to Chemical Drawings via API
    - Fetch Material Reports via API
  • Xynthetica*
    - Xynthetica Administrative UI (beta)
  • Formulations*
    - Formulations Development (beta)

* Requires Signals One license

† Requires Signals Synergy license

‡ Requires InventoryGo license

We also fixed several small bugs in this release. Details of the enhancements are described below.

The following OnDemand videos for Signals Notebook Administrators are now available:

  • Data Exchange Mapping Settings for Publication to Data Factory
  • Synergy Experiment Mapping Settings for Publication to Data Factory

Data Factory now enforces a limit of 100 endpoints per measurement type

Data Factory administrators should be aware that all primary APIs will be deprecated in a future release.

Data Factory administrators should be aware that ‘username’ has been removed from the primary API GET /datafactory/search-service/my-saved-searches

Data Factory Administrators should complete migration of legacy data factory projects before 27.4; after this the migration deadline, legacy projects will become read-only and no longer support data publication.

Data Factory administrators should also note that the Advanced Security policies in Inventa apply an “AND” logic across all user groups, restricting access if any groups lack permissions. This behavior differs from the standard Signals security model and will be fixed to align with the standard in a future release.

Administrators are recommended to subscribe to the channels within our support news site found at https://support.revvitysignals.com/hc/en-us/categories/360004446171-Support-News which contains more information about releases and other pertinent product information.

This content is anticipated for release on our Production E3 environments, and for Private Cloud customers on our deferred release schedule, in March 2027.

Further Details

The following improvements are available for users, administrators and developers on the Signals platform. Certain features may only be available with appropriate licensing and/or with enablement by an administrator.

Fundamentals

Image 1 from What's New 26.8.docx

In preparation for expanding the Salt Stripping functionality of Normalized Compounds to Solvates, the Solvates list in the SN Config has been updated to allow for SMILES management as well.

To manage Solvate SMILES, the user can navigate to the Solvate list in the System Settings

Image 2 from What's New 26.8.docx

The SMILES for the System provided Solvate list can be added by “Exporting System Solvates To .csv” and Bulk updating Solvates. Individual Solvate SMILES can be entered directly in the Text SMILES column.

In Parallel Experiments, users will now have the option to select which Product to use on Bulk Sample creation. When the user goes to Bulk create samples, there will now be an option to select which product to use in sample creation, ie. P1 or P2. Utilizing the “All Products” selection will preserve existing behavior.

Image 3 from What's New 26.8.docx

The HELM string is now an available option for mapping the Chemical Structure in the External Enumerator.

Image 4 from What's New 26.8.docx

Users can view visual granular change comparisons for ChemDraw Stoichiometry Grids in the audit trial. When enabling the “View granular changes” toggle, field and value updates are clearly highlighted: green indicates newly added data, a green dashboard boarder denotes modified data, and gray represents removed entries. This visual comparison also applies to the Reactants Summary table as well as table visibility changes (showing or hiding stoichiometry tables). Note: visual diffs for Chemical drawings (molecular diagrams) are not supported by this tool.

Data Workflows & Analytics

Image 5 from What's New 26.8.docx

In the Curve Fitting step of the In Vitro Analysis, following an analysis run, it is now possible for Signals One users to select some of the curves and apply a new set of fit parameters to these curves specifically to improve their curve fitting.

Image 6 from What's New 26.8.docx

A new pull down menu in the bulk actions bar is now available to set the fit parameters:

Image 7 from What's New 26.8.docx

Each new set of curve fitting parameters, identified by a name, can then be applied to the selected curves for recalculating the curve fits.

Image 8 from What's New 26.8.docx

The name of the parameter set remains associated with the curves that were recalculated with it.

Image 9 from What's New 26.8.docx

Finally, the parameter sets in the analysis, which can be part of the In Vitro Analysis template, can be managed by clicking on the cog wheel in the upper right corner of the Curve Fitting element. The number of curve fits using each of the parameter sets is visible:

Image 10 from What's New 26.8.docx

When deleting a set of parameters used to recalculate some of the curves, the default parameters used for the initial global run are automatically reapplied.

Image 11 from What's New 26.8.docx

Moreover, in addition to the 3, 4 and 5 Parameters logistic curve fitting definitions, eight new system definitions are now available in the Analytics smart folder of Signals One configuration.

These new definitions, which can be enabled or disabled, allow using linear concentrations of agonists or antagonists with either raw or normalized signal.

SAR & Decisioning

Image 12 from What's New 26.8.docx

Use Insights to query, generate, and analyze Measurement and SAR Tables directly in Signals is available to all systems

Image 13 from What's New 26.8.docx
Image 14 from What's New 26.8.docx

Insights now supports advanced chemical filtering within SAR and Measurement Tables, including substructure, similarity, exact, full-structure, and tautomer matching. Multiple filters can be combined to refine results, while chemical fragment highlighting provides additional context during analysis. A cleaner default SAR table layout helps users focus on key endpoints, with additional data available through table configuration options.

Image 15 from What's New 26.8.docx
Image 16 from What's New 26.8.docx
Image 17 from What's New 26.8.docx
Image 18 from What's New 26.8.docx
Image 19 from What's New 26.8.docx
Image 20 from What's New 26.8.docx
Image 21 from What's New 26.8.docx
Image 22 from What's New 26.8.docx

ChemCharts introduces new data functions for antibody engineering and molecular alignment, along with visualization enhancements such as visual cloning and per-column form tooltips.

ChemCharts now supports assigning different form-based tooltips to individual columns, providing greater control over the contextual information displayed throughout a visualization. New visual cloning capabilities also make it easier to duplicate and adapt existing visualizations.​

The Antibody Numbering data function now supports ANARCII and can return prediction scores and confidence values for heavy and light chains.​

The Gaussian Molecular Shape Alignment data function aligns small molecules to a query structure using Gaussian 3D shape-based alignment. Results are returned in Query Conformers and Aligned Structures tables and can be explored using the Molecule Viewer.​

The Antibody Germline Prediction and Antibody Humanization data functions support complementary antibody engineering workflows. Germline Prediction identifies the most likely germline gene families for heavy and light chains and aligns sequences to identify mutations relative to the highest-probability germline sequence. Humanization then suggests sequence changes intended to improve predicted human-likeness while maintaining antibody chain pairing characteristics. When used with the Biomolecule Viewer, users can compare the original and predicted humanized structures.

Synergy

Image 23 from What's New 26.8.docx

Release 26.8 brings several updates to Synergy Designs. First, calculated properties, including a variety of physicochemical properties (e.g., Log P, predicted pKa), drug-likeness and ADME predictors (e.g, Labute ASA, Lipinski H-bond acceptors), structure and topology, ring system, atomic composition, and stereochemistry calculations, are now available for Synergy Designs. Administrators can selectively configure which properties to include in each library’s Designs Definition and Design Tables in Synergy Configuration by adding a new field and selecting Calculated Property.

Image 24 from What's New 26.8.docx

When new Designs are created, properties are automatically calculated and represented on the Design.

Image 25 from What's New 26.8.docx
Image 26 from What's New 26.8.docx
Image 27 from What's New 26.8.docx

In this release, bulk Import Designs to Designs Table now supports CSV files with HELM notation. Note that Designs already support HELM notation; this is an expansion of the import file CSV file support.

Image 28 from What's New 26.8.docx

Currently, Synergy Experiment properties can be configured to inherit property values from the parent Collaboration or associated Work Order. In 26.8, we extended this feature to Work Orders. Work Order Template attribute list fields can be configured to inherit a corresponding property value from the parent Collaboration. If a field is set to inherit from the Collaboration, the Work Order field will automatically populate with the corresponding value from the parent Collaboration at creation. As a result, the Sponsor user does not have to repeatedly populate the same property, such as Project Code or Disease Target, even when this property is Hidden from CRO.

Image 29 from What's New 26.8.docx

Similar to Sponsor users, CRO users can now Print to PDF their Synergy Experiments. As always, Hidden from CRO metadata is excluded from the print PDF functionality for CROs.

Image 30 from What's New 26.8.docx

Sponsor users can receive an in-app or email notification when a CRO user puts a Work Order On Hold.

Image 31 from What's New 26.8.docx

Sponsor Administrators can view visual granular change comparisons for fields in Synergy Design tables in the audit trial. When enabling the “View granular changes” toggle, field updates are clearly highlighted: green indicates newly added data, a green dashboard boarder denotes modified data, and gray represents removed entries. Use cases addressed include adding a new field to a Design, updating or clearing field values, renaming a field header, removing a field or reordering columns. Note: Design Structure previews are not supported by this tool.

Tables

Image 32 from What's New 26.8.docx

Configuration administrators can now define default values for Headers and Properties in Admin Defined Tables, Variation Tables and Hierarchical Tables. Default values can be set for all appropriate property types.

Image 33 from What's New 26.8.docx

The Mean can now be displayed in Box Plots. The Configuration Administrator, or optionally the end user, can set if the Mean is displayed or not, and define the color, line style and line thickness.

Image 34 from What's New 26.8.docx

Reference Lines can be displayed on numerical axes of charts. Lines can be set to be either a fixed value or at a calculated aggregate of a numerical column. The configuration administrator, or optionally end user, can define the line color, style and thickness, and the label display, for the reference lines.

Image 35 from What's New 26.8.docx

Graphing has also been extended to Variation Tables. All included chart types, namely Scatter Plots, Bar Charts, Bar Charts and Box Plots can be configured on Variation Table Templates. The Variant Name can be used as a categorical property, such as to Trellis By.

Plates

Image 36 from What's New 26.8.docx

When users Hide an Annotation layer in the plate, the corresponding column in the Plate table is also hidden. This will not alter the data stored on the plate.

Inventory

Image 37 from What's New 26.8.docx

Create and customise inventory label templates by defining label sizes, selecting displayed fields, positioning content, and configuring formatting options such as fonts, barcodes, and QR codes to meet site-specific labelling requirements.

Image 38 from What's New 26.8.docx

Enter the amount consumed directly during inventory updates. The system automatically deducts the consumed quantity and displays the remaining balance, simplifying inventory consumption tracking.

Image 39 from What's New 26.8.docx
Image 40 from What's New 26.8.docx

Configure custom fields for material orders and capture additional information tailored to your organization’s procurement and inventory workflows.

Image 41 from What's New 26.8.docx

When searching for items in Quick Add (via barcode scan, container ID, material name, or sample search), the system now automatically selects the item and bypasses the search
modal whenever a single match is found, eliminating unnecessary dialogs and clicks.

Image 42 from What's New 26.8.docx

To maintain location hierarchy integrity and prevent configuration conflicts, the system now validates grid cells before sub-location creation. Users are prevented from converting any grid cell that is already assigned as a container’s Home Location into a Grid-type sub-location.

Image 43 from What's New 26.8.docx
Image 44 from What's New 26.8.docx

New Container Label Templates - 50 x 30 mm(QR Code) and 50 x 30 mm(4 slots)

Image 45 from What's New 26.8.docx

Container search results now display reconciliation and rectification details, providing greater visibility into inventory status and recent inventory adjustments.

InventoryGo

Image 46 from What's New 26.8.docx

Scan barcodes and QR codes directly using your device’s camera, enabling faster identification and management of inventory items without dedicated scanning hardware.

Materials

Image 47 from What's New 26.8.docx

Materials tables within an experiment can now be updated in bulk to reflect the latest material changes. Users can now select multiple rows that contain stale data and update them in one action.

Image 48 from What's New 26.8.docx

A new calculated property in Compounds and Normalized Compounds libraries and the pre-configured Reagents (SNB) library is available to generate a HELM string of the structure drawn in the ChemDraw canvas.

Administration

Image 49 from What's New 26.8.docx
Image 50 from What's New 26.8.docx
Image 51 from What's New 26.8.docx
Image 52 from What's New 26.8.docx

Data Factory file maps now allow user to supply a constant value when publishing data via the Inventa Dashboard or Publish Results to Data Factory app. Administrators can enable the “Fixed” value from an Entity or Measurement Type map from the Data Factory configuration. When users select this map during publication either via the Inventa Dashboard or the Publish Results to Data Factory app they are prompted to enter a value. This value will appear on every row for that column in the publication.

Integrations & APIs

Image 53 from What's New 26.8.docx

We have added a new API to create material orders (POST /inventory/materialOrders). The request sets the order fields, for example Requestor, Supplier Name, Supplier Catalog Number, Destination Location and Status. The Destination Location can be a grid location. The Chemical Structure field accepts CDXML, SMILES, InChI, MOL V2000, MOL V3000 and HELM.

Image 54 from What's New 26.8.docx

We have enhanced the Chemical Drawing APIs to support FASTA sequences. The API to append a structure to a reaction (POST /chemicaldrawings/{eid}/reaction/{position}) now accepts the data types “fasta-dna”, “fasta-rna” and “fasta-peptide”.

Image 55 from What's New 26.8.docx

We have added new APIs to fetch the reports of all material bulk import, bulk export and bulk update jobs (GET /materials/bulkImport/jobs, /materials/bulkExport/jobs and /materials/bulkUpdate/jobs). Each API returns a paged list of jobs with their status and results.

Beta Features

The following capabilities are in beta and are available for users, administrators and developers on the Signals platform upon request. Please contact your account representative or our support team if you would like access to the following features.

Fundamentals

Image 56 from What's New 26.8.docx
Image 57 from What's New 26.8.docx
Image 58 from What's New 26.8.docx
Image 59 from What's New 26.8.docx
Image 60 from What's New 26.8.docx
Image 62 from What's New 26.8.docx

Assays and their Variants now support Archiving. If a Variant is no longer needed for production use, it can be marked as Archived, which will prevent further editing of the Variant, unless it is restored

Configuration admins may need to update a Variant template after its in use, for example to add an additional data capture field. When a administrator modifies a template, users will see an outdated message on the Variants Summary table. When they select update, the table will be updated with the latest definition, and the existing Variants checked for compliance with that new definition. Users can individually edit Variants to meet the up dated definition requirements. Assay state and compliance are both searchable fields and clear labels on the Variant. The parent Assay’s state and compliance is automatically updated based on it’s Variants.

ELN Archive

Image 63 from What's New 26.8.docx

Users can now conduct a simultaneous search across Signals Notebook and ELN Archive content. This search is available via a new combined Source and allows users to query both sets of content by text and chemical structure. Each set of content can be further refined using facets specific to that set of content.

Xynthetica

Image 64 from What's New 26.8.docx
Image 65 from What's New 26.8.docx

Xynthetica now supports a native admin UI.

The Tenant Models pane gives the administrator a navigable UI to see details around how their users are leveraging Xynthetica models.

Image 66 from What's New 26.8.docx

The Model Marketplace is used to gain access to models, and their model card information can be viewed by simply clicking into the relevant model of interest.

Image 67 from What's New 26.8.docx

Data Contribution allows users to commit training data to federated models. User selects values of interest and parameter, then submits relevant metadata to improve.

Image 68 from What's New 26.8.docx

Monitor credit spend in the Credits panel. The Xynthetica-Tunelab bundle includes 2M starter credits.

Formulations

Image 69 from What's New 26.8.docx

Formulation Development will need some administration set up before it can be used. Activation is in the System Objects à Formulation Experiment:

Image 70 from What's New 26.8.docx

There is only 1 Default System Template currently supported. User Roles has a heading for managing permission to User Roles. Formulation Experiments permissions are for Signals Notebook users:

Image 71 from What's New 26.8.docx

Recipe Designer App is for users that will be creating Parameters, Steps, Recipes and Formulation Experiment Designs:

Image 72 from What's New 26.8.docx

There is a new System Group called Recipe Builders. All Steps, Recipes and Formulations Experiment Designs are automatically shared with the Recipe Builder group by default. The Equipment Table for Formulations can be adjusted in the Material Library:

Image 73 from What's New 26.8.docx

A new Material Library called Formula (SNB) has been created and will need to be set up with an ID Sequence, Uniqueness Rule and Record Definition for both the Material and the Batch/Lot, as well as activated:

Image 74 from What's New 26.8.docx

Before any parameters can be created, the System Administrator must set up the Controlled Fields in the System Settings in SN Config:

Image 75 from What's New 26.8.docx

Once the above items have been configured, users with the role with Recipe Builder/permissions to the Recipe Designer App can log into the new app from the home page or via the top right navigation:

Image 76 from What's New 26.8.docx

In the Recipe Designer App, users can create Parameters, Steps, Recipes and Formulation Experiment Designs. Parameters are created from the Controlled Fields that the System Administrator has created:

Image 77 from What's New 26.8.docx

Parameters Table can have additional columns and calculations added to them:

Image 78 from What's New 26.8.docx

Use the Create New menu to create Steps, Recipes and Formulation Experiment Designs:

Image 79 from What's New 26.8.docx

Steps require the Instructions box, but Ingredients, Equipment and Parameters are optional. Steps can be deleted if not used, otherwise they can be retired.

Image 80 from What's New 26.8.docx

Recipes require space for Steps, but Ingredients, Equipment and Parameters are optional. Recipes can be deleted if not used, otherwise they can be retired.

Image 81 from What's New 26.8.docx

Parameters, Steps and Recipes can be used to create a Formulation Experiment Design. The Formulation Experiment Design acts like a template that Formulators can use to create new Formulation Experiments from.

Image 82 from What's New 26.8.docx

Select the Material Libraries that will be needed:

Image 83 from What's New 26.8.docx

Select Properties and Ingredients can be adjusted in the Ingredients Table in the Formulation Experiment Design or in the Formulation Experiment. Equipment types can be filled in. Recipes, Steps and Parameters can be added and adjusted on the Formulation Experiment Design. Once ready, share the Formulation Experiment Design with the correct Users or User Groups to be used in Signals Notebook. Formulation Experiment Designs can be deleted if not used or retired in the top right corner.

Image 84 from What's New 26.8.docx

Users in the role with permission to create Formulation Experiments will see the option under the Add New menu:

Image 85 from What's New 26.8.docx

Select a Formulation Experiment Design to start a new Formulation Experiment:

Image 86 from What's New 26.8.docx

Make updates to the Ingredients, Equipment, Recipes, Steps and Parameters as needed:

Image 87 from What's New 26.8.docx

When done making changes, click the Continue to Lots button. Select an asset from the Formula Library and enter the number of batches/lots to create for this experiment:

Image 88 from What's New 26.8.docx

Enter required data on the Lot Definitions before moving to the Lot Composition:

Image 89 from What's New 26.8.docx

Fill in the Lot Composition to Register the lots directly from the Formulation Experiment:

Image 90 from What's New 26.8.docx

Once the lots have been registered, users will see the Lot IDs have been replaced with real Material IDs and the Lot Recipes will be repeated on a per lot basis:

Image 91 from What's New 26.8.docx

Users can make changes on a per lot basis to the Recipe, Steps or Parameters. Once changes are completed, users can click the Start Execution button to capture the experiment data as they run the experiment: