Search

Your Notifications (0)

There are currently no notifications. You're all set!

What's New

Explore recent and historical product updates for Revvity Signals' Cloud Native SaaS Software 

Clear All Collapse All

8 releases — this page expanded. Collapse

What’s New

We are delighted to release our new version of NMR Predictors™, Version 2026.

Highlighted Features

  • Updated prediction databases.
  • Accurately predict 19F spectra of structures with diastereotopic fluorine atoms.

Administrators are recommended to subscribe to the channels within our support news site found at https://support.revvitysignals.com/hc/en-us/categories/360004446171-Support-News which contains more information about releases and other pertinent product information.

Further Details

Version 2026 includes updated prediction databases and an improved 19F prediction algorithm that recognizes diastereotopic fluorine atoms. There are also improvements to qNMR concentration calculations, 1D spectral similarity comparisons, and peak handling for strongly coupled ¹⁹F spectra.

Prediction

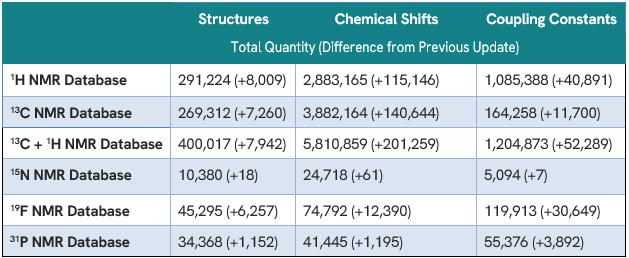
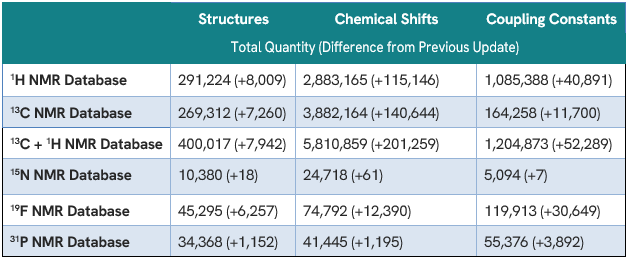
Updated Prediction Databases
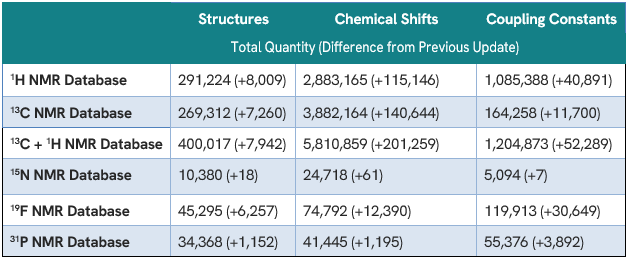
Image 1 from WN NMR Predictors v2026.docx
  • You can now predict spectra based on databases with thousands more structures, chemical shifts, and coupling constants.

Accurately Predict 19F Spectra of Structures with Diastereotopic Fluorine Atoms

  • You can now predict 19F spectra with an improved algorithm that recognizes diastereotopic fluorine atoms.

Data Analysis & Processing

Internal Standard qNMR Concentration Calculation Now Included Out of the Box

  • Internal standard qNMR calculations are now available in the interface, similar to the external standard workflow (previously available as a script provided upon request).

Conveniently Calculate Similarity Score Between Two 1D Spectra

  • You can now calculate the Hit Quality Index (HQI) between two 1D spectra of the same nucleus without the need for the reference spectrum to be in a database. This can provide a quick quantification of the match between the current sample spectrum and that of a standard.

Better Peak Handling for 19F Spectra with Strong Couplings

  • You can now automatically pick and assign peaks in 19F spectra of structures containing CHF2 groups more accurately. When the proposed structure contains these groups, the software checks the spectrum for peaks associated with a typical AB spin system for F atoms (two strongly coupled doublets with an evident ‘roof’ effect).

Expanded 1H-31P Coupling Ranges in Auto Assignment

  • You can now more accurately assign and verify structures whose spectra contain large 1H-31P coupling constants with increased upper limits for JHP. The new expanded ranges are: 
    • 3–20 Hz for 2JHP
    • 0–20 Hz for 3JHP
    • 0–6 Hz for 4JHP

Define Parameters Once for All Replicates in External Standard qNMR

  • You can now define parameters including pulse angle, scans, and receiver gain once and have them applied to all selected spectra in external standard qNMR workflows with replicates when they cannot be automatically extracted from the raw data files.

Databasing

Ease of Use

  • Choose to hide the “Custom Screen Form” toolbar for greater screen real-estate.
  • You now have a new option to visualize the stereochemical configuration of select stereocenters in database records. Previously you could either display or hide all stereocenters.

Reporting

Set the Relative Height of “Median” Peak in Report

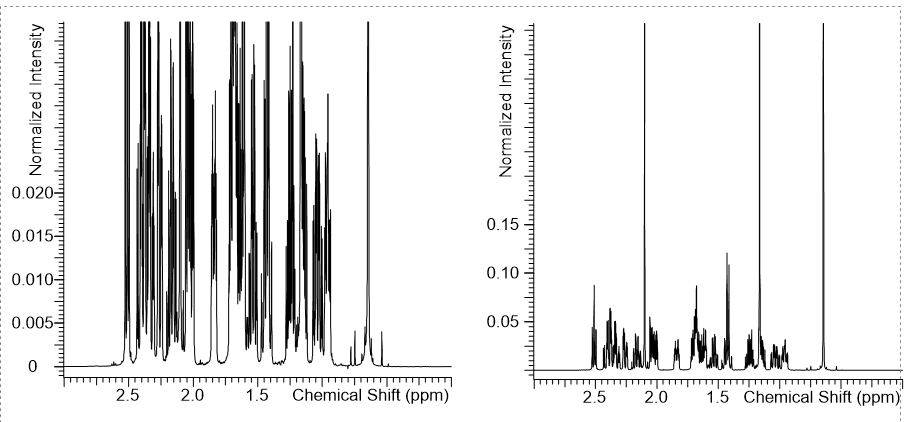
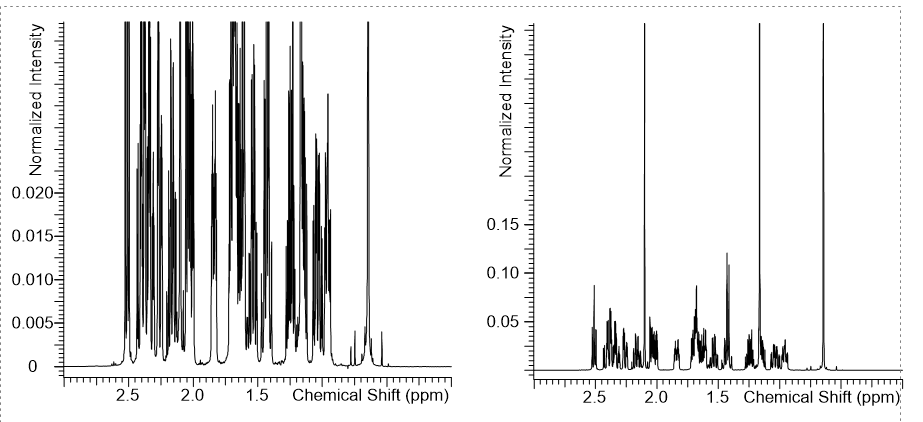
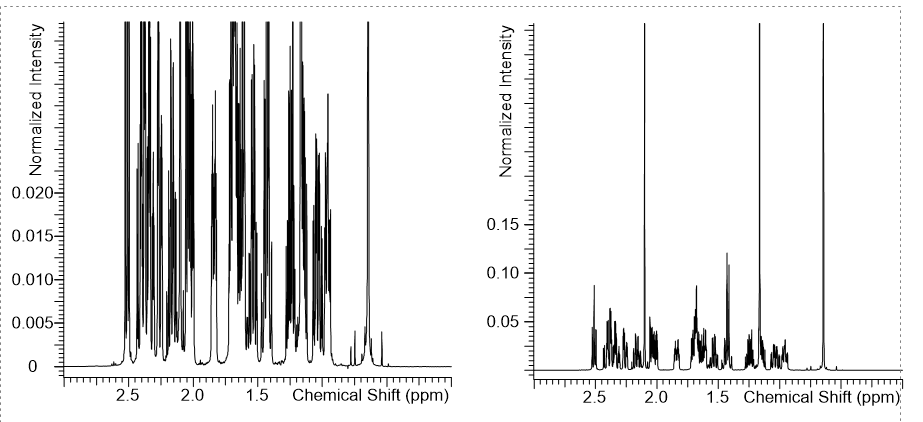
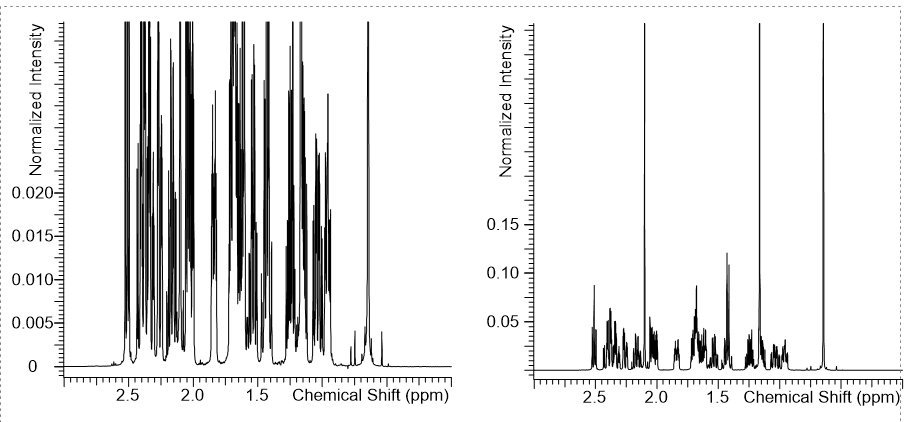
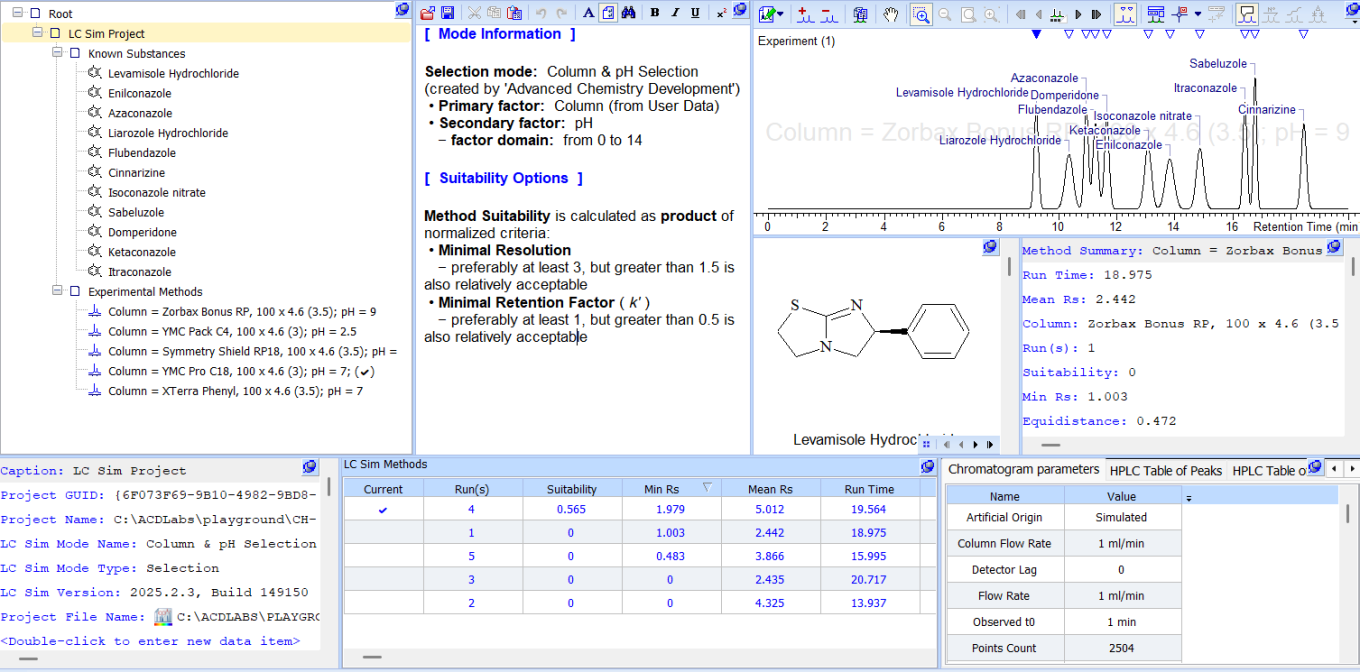
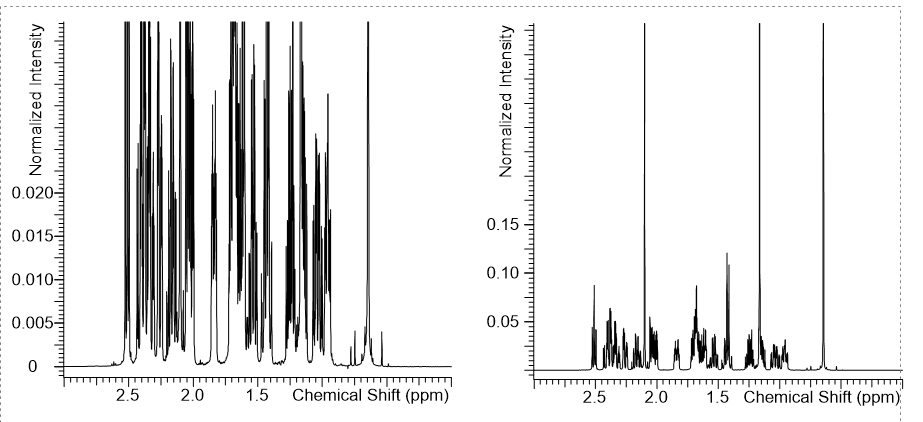
  • You can now better control the “Fit” option for dynamic Y-scaling of the 1D spectra in the reporting templates with the new Ratio parameter that allows you to specify the relative height of the “median” peak in the report. (Left spectrum has a fit = 90%, right = 10%.)
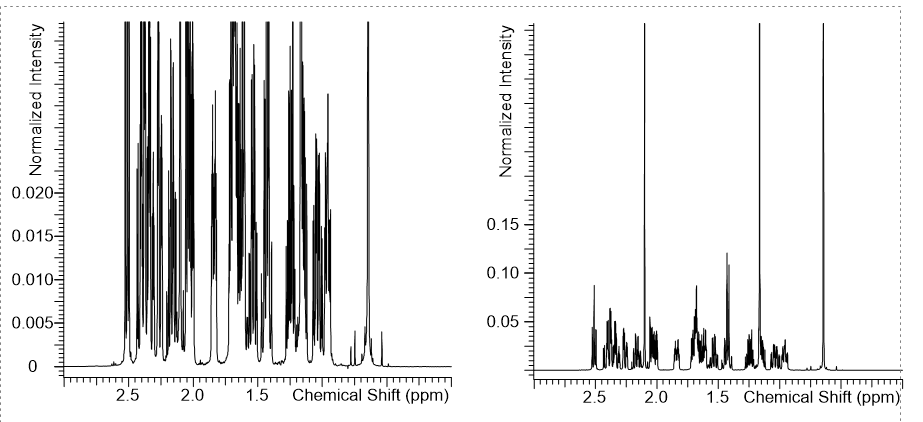
Image 2 from WN NMR Predictors v2026.docx

Use the new ratio parameter for dynamic y-scaling of 1D spectra. 
Left spectrum has a fit = 90%, right = 10%

Data Import & Export

Improved MS & Chrom Data Import

  • Improved import filters for Thermo UVPD MSn data.

Processing MS & Chrom Data

Data Analysis & Processing

Component Spectrum Flexibility

  • You can now create component spectra based on the most abundant adduct ion ([M+H]+, [M+NH4]+, [M+K]+, etc.) This is particularly useful when the [M+H]+ ion is weak or exhibits a very low intensity.

Better Handling of Peptide Structures

  • Peptides can now be displayed in a simplified form in the Table of Components, making it easier to distinguish and interpret individual structures.

Import Components without Retention Time Assignments

  • You can now use existing datafiles to generate target lists (.sdf) for more streamlined batch processing. Components can be imported with or without existing retention times, reducing erroneous assignments and enabling reuse of component files across targeted analysis and other workflows.

Display Combined Retention Time

  • You can now display the combined retention time (tR) instead of scan numbers for clearer interpretation of chromatographic data.

Reporting

Select Components for Reporting

  • You can now choose which components from the Table of Components are included in reports when using the Component/Peak Layout Organizer.

Simplified Peptide Reporting

  • You can now report peptides in a simplified form for clearer presentation in reports.
What’s New

We are delighted to release our new version of NMR Workbook Suite™, Version 2026.

Highlighted Features

  • Export all NMR spectra in a project to a single JSON file.
  • Automatically detect non-singlet water signal.
  • Improved recognition of CHF2 signals in HSQC spectra.
  • Account for signal attenuation due to water suppression.

Administrators are recommended to subscribe to the channels within our support news site found at https://support.revvitysignals.com/hc/en-us/categories/360004446171-Support-News which contains more information about releases and other pertinent product information.

Further Details

Version 2026 adds new features including the option to export all NMR spectra in a project to a single JSON file. There are also improvements to automatic processing and analysis tools to enable accurate analysis of data for structures containing CHF2 groups and spectra with suppressed water peaks.

Data Analysis & Processing

Automatically Detect Non-Singlet Water Signal

  • You can now automatically detect water signals in spectra where water suppression techniques result in distortion of the water peak shape from the typical broad singlet. The new Allow Any Multiplicity of Water Signal option identifies a signal within the water range in the 1H spectrum that does not have a match in the HSQC 1H projection as the water signal.

Improved Recognition of CHF2 Signals in HSQC Spectra

  • You can now automatically detect and assign CHF2 peaks in HSQC spectra more accurately with improved analysis and assignment algorithms.

Account for Signal Attenuation Due to Water Suppression

  • You can now account for attenuation of signals adjacent to the water peak due to water suppression techniques to enable accurate automatic assignment. The new Adjacent Signals are Attenuated option loosens the integral restrictions for all multiplets within 0.1 ppm of the position of the water peak in the auto-assignment protocol.

Internal Standard qNMR Concentration Calculation Now Included Out of the Box

  • Internal standard qNMR calculations are now available in the interface, similar to the external standard workflow (previously available as a script provided upon request).

Conveniently Calculate Similarity Score Between Two 1D Spectra

  • You can now calculate the Hit Quality Index (HQI) between two 1D spectra of the same nucleus without the need for the reference spectrum to be in a database. This can provide a quick quantification of the match between the current sample spectrum and that of a standard.

Better Peak Handling for 19F Spectra with Strong Couplings

  • You can now automatically pick and assign peaks in 19F spectra of structures containing CHF2 groups more accurately. When the proposed structure contains these groups, the software checks the spectrum for peaks associated with a typical AB spin system for F atoms (two strongly coupled doublets with an evident ‘roof’ effect).

Expanded 1H-31P Coupling Ranges in Auto Assignment

  • You can now more accurately assign and verify structures whose spectra contain large 1H-31P coupling constants with increased upper limits for JHP. The new expanded ranges are: 

    • 3–20 Hz for 2JHP

    • 0–20 Hz for 3JHP

    • 0–6 Hz for 4JHP

Define Parameters Once for All Replicates in External Standard qNMR

  • You can now define parameters including pulse angle, scans, and receiver gain once and have them applied to all selected spectra in external standard qNMR workflows with replicates when they cannot be automatically extracted from the raw data files.

Prediction

Updated Prediction Databases

Image 1 from WN NMR Workbook Suite v2026.docx
  • You can now predict spectra based on databases with thousands more structures, chemical shifts, and coupling constants.

Accurately Predict 19F Spectra of Structures with Diastereotopic Fluorine Atoms

  • You can now predict 19F spectra with an improved algorithm that recognizes diastereotopic fluorine atoms.

Databasing

Ease of Use

  • Choose to hide the “Custom Screen Form” toolbar for greater screen real-estate.
  • You now have a new option to visualize the stereochemical configuration of select stereocenters in database records. Previously you could either display or hide all stereocenters.

Reporting

Set the Relative Height of “Median” Peak in Report

  • You can now better control the “Fit” option for dynamic Y-scaling of the 1D spectra in the reporting templates with the new Ratio parameter that allows you to specify the relative height of the “median” peak in the report.
Image 2 from WN NMR Workbook Suite v2026.docx

Use the new ratio parameter for dynamic y-scaling of 1D spectra. 
Left spectrum has a fit = 90%, right = 10%

Data Import & Export

Export All NMR Spectra in a Project to a Single JSON File

  • You can now export all NMR spectra in a project to a single JSON file.

Import Bio-Sequence Assignments from Any NMR Spectrum

  • You can now import assignments for biomolecules from any NMR spectrum in STR format.

Include Structure Information in Data Exported in JSON Format

  • You can now include structure information in records/databases exported in JSON format via .mol files.

Improved MS & Chrom Data Import

  • Improved import filters for Thermo UVPD MSn data.

Processing MS & Chrom Data

Data Analysis & Processing

Component Spectrum Flexibility

  • You can now create component spectra based on the most abundant adduct ion ([M+H]+, [M+NH4]+, [M+K]+, etc.) This is particularly useful when the [M+H]+ ion is weak or exhibits a very low intensity.

Better Handling of Peptide Structures

  • Peptides can now be displayed in a simplified form in the Table of Components, making it easier to distinguish and interpret individual structures.

Import Components without Retention Time Assignments

  • You can now use existing datafiles to generate target lists (.sdf) for more streamlined batch processing. Components can be imported with or without existing retention times, reducing erroneous assignments and enabling reuse of component files across targeted analysis and other workflows.

Display Combined Retention Time

  • You can now display the combined retention time (tR) instead of scan numbers for clearer interpretation of chromatographic data.

Databasing

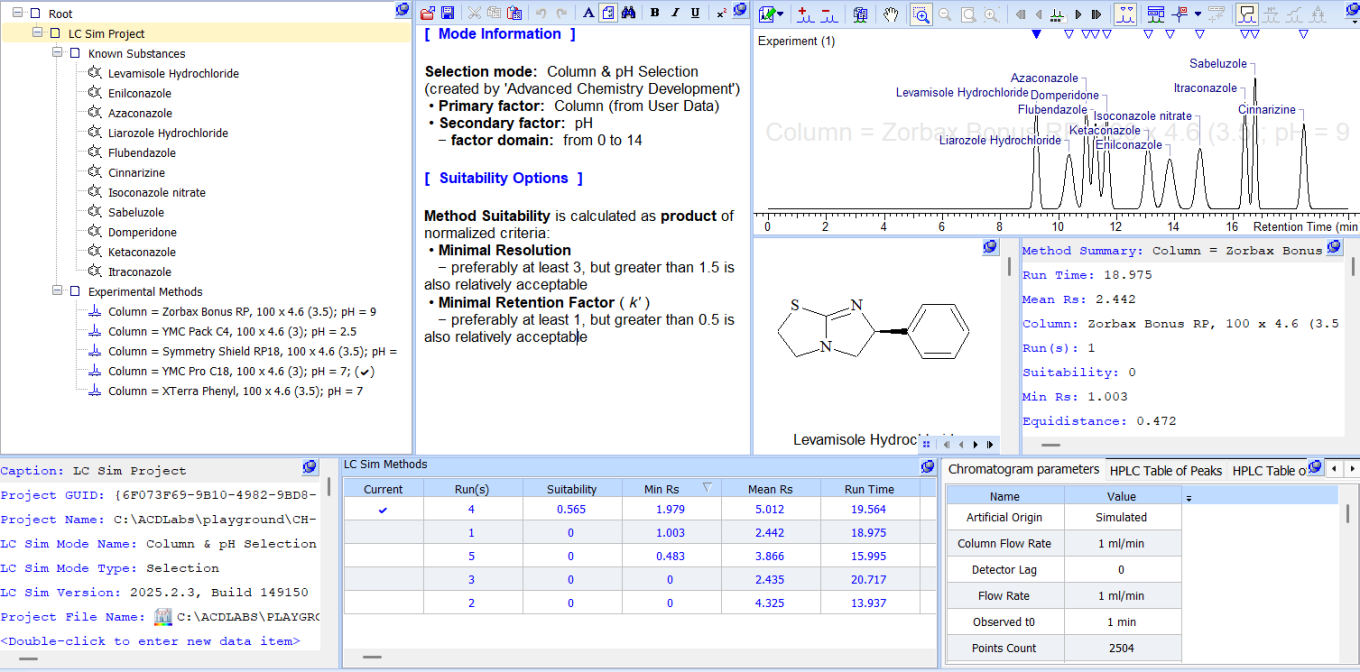
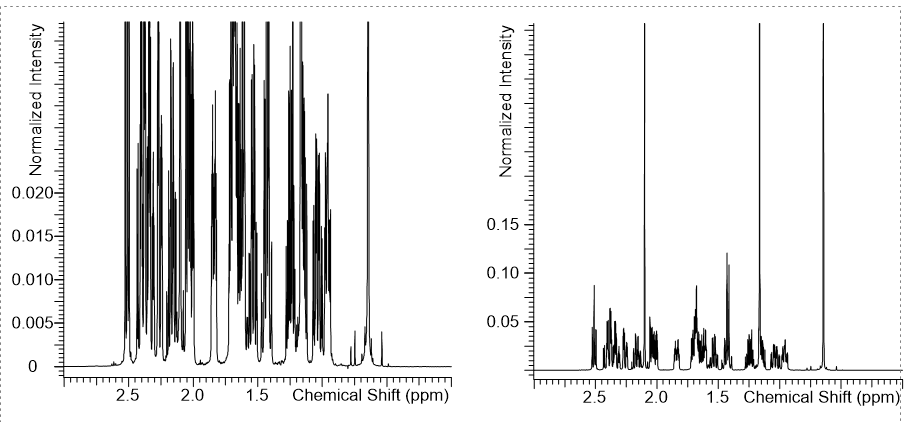
Create, View, and Edit LC Simulator Files in the Database

  • You can now edit and update LC Simulator .lc7 files in Spectrus databases.
  • You can now create a Spectrus DB screen form for convenient review of LC Simulator Project records.
Image 3 from WN NMR Workbook Suite v2026.docx

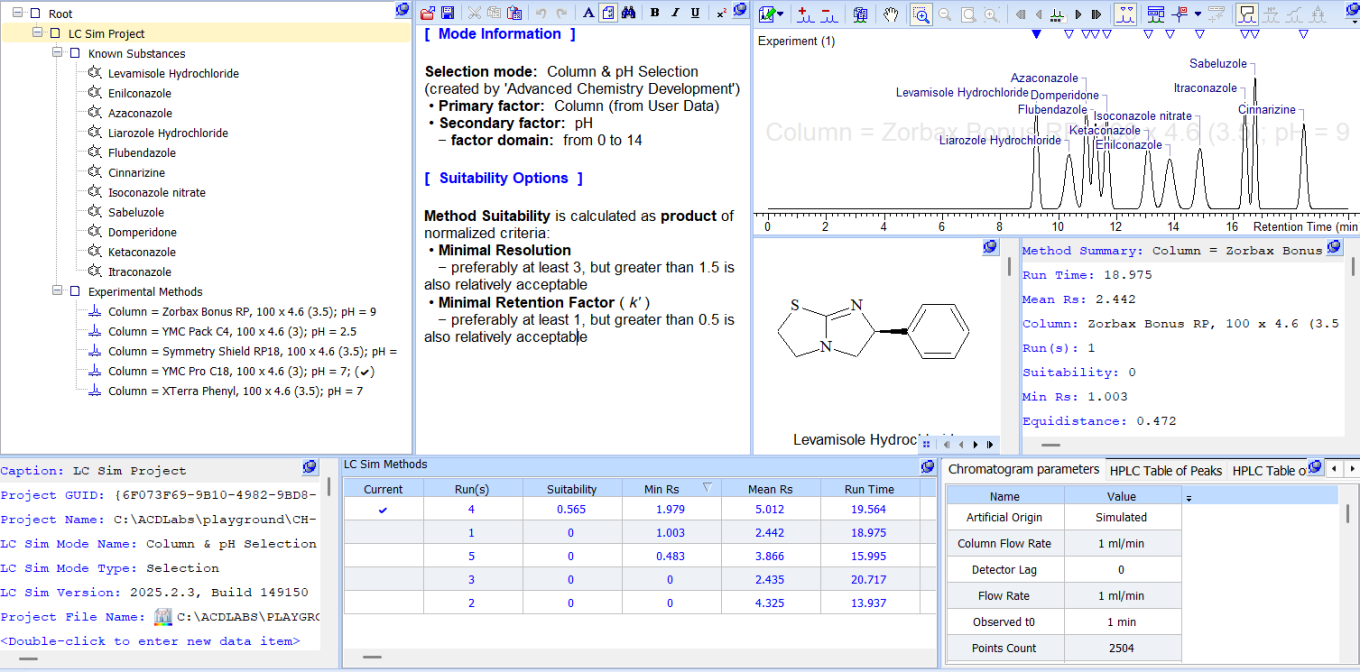
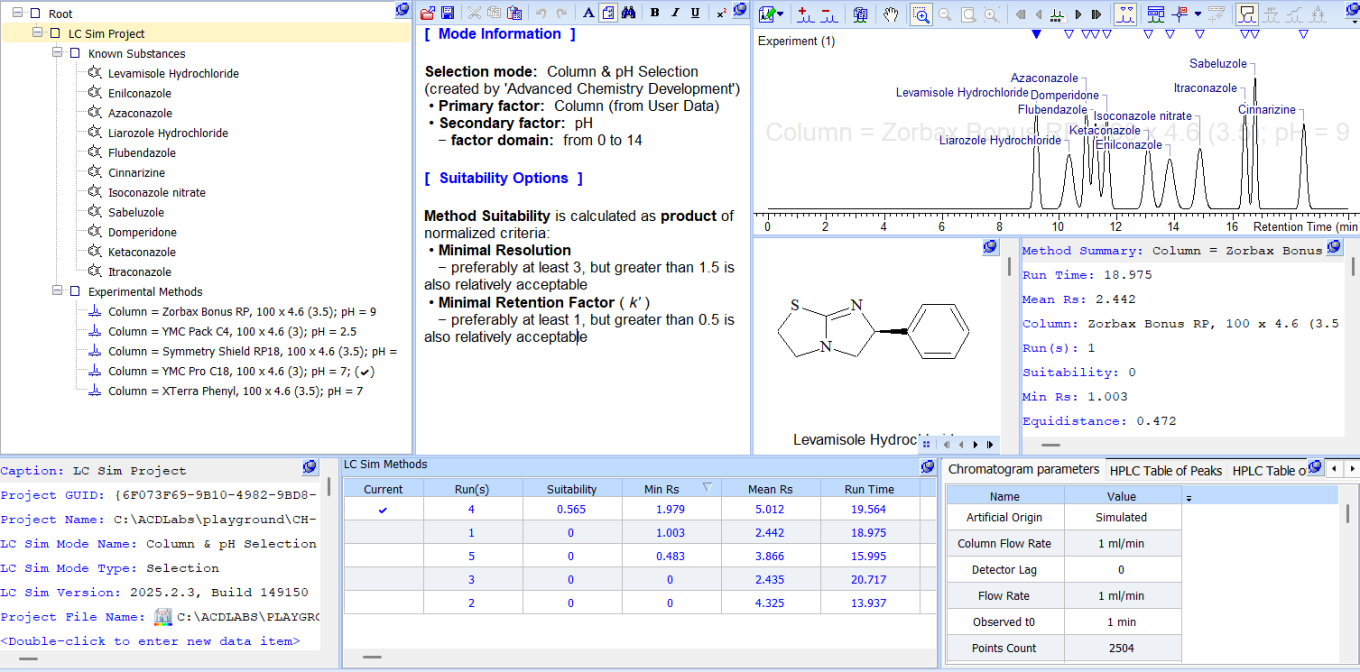
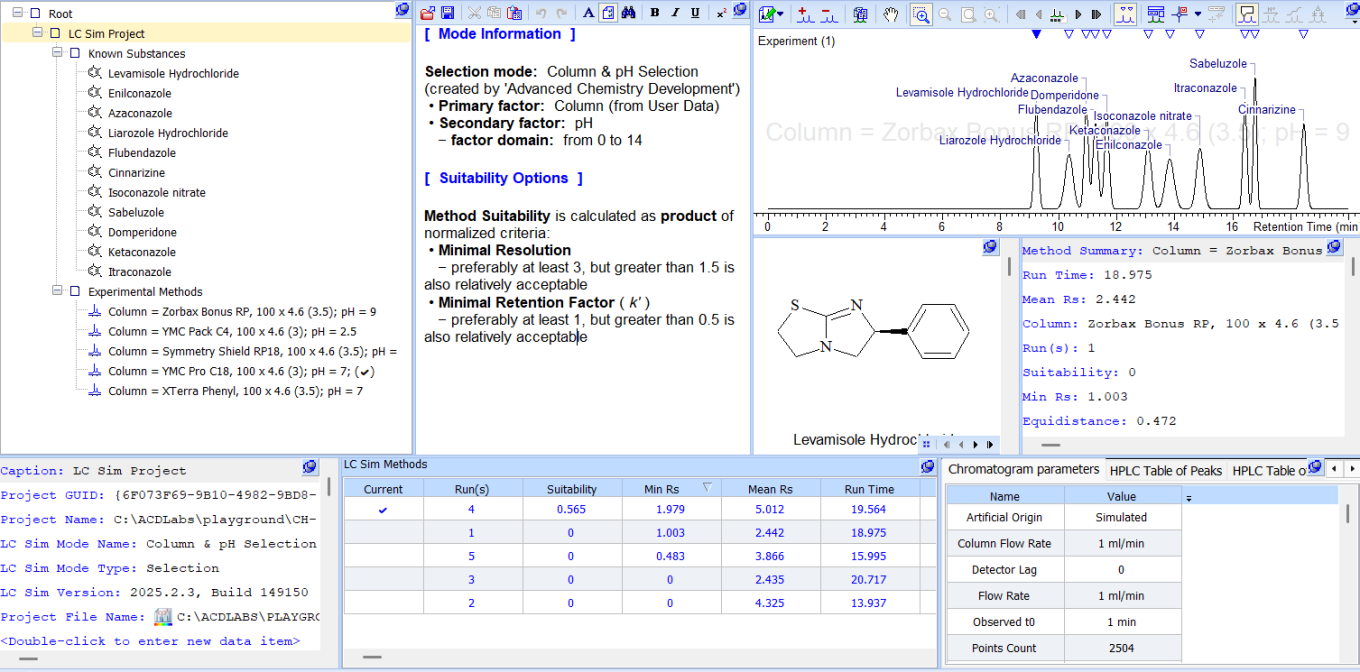
Handle LC Simulator files in database view.

Reporting

Select Components for Reporting

  • You can now choose which components from the Table of Components are included in reports when using the Component/Peak Layout Organizer.

Simplified Peptide Reporting

  • You can now report peptides in a simplified form for clearer presentation in reports.
What’s New

We are delighted to release our new version of Structure Elucidator Suite™, Version 2026.

Highlighted Feature

  • Identify known structure fragments for faster elucidation.

Administrators are recommended to subscribe to the channels within our support news site found at https://support.revvitysignals.com/hc/en-us/categories/360004446171-Support-News which contains more information about releases and other pertinent product information.

Further Details

Version 2026 adds new features including the ability to identify fragments of known structures from the PubChem database prior to structure generation. There are also improvements to automatic processing and analysis tools to enable accurate analysis of data for structures containing CHF2 groups and spectra with suppressed water peaks.

Data Analysis & Processing

Identify Known Structure Fragments for Faster Elucidation

  • You can now search and identify fragments of known structures in the PubChem database that match the 13C NMR data and molecular formula entered for neutral species containing 14 or more carbon atoms. The software incorporates these fragments into User Molecular Connectivity Diagrams (UMCDs) for subsequent structure generation. This reduces the scale of this computational task and can significantly reduce overall elucidation time.

Automatically Detect Non-Singlet Water Signal

  • You can now automatically detect water signals in spectra where water suppression techniques result in distortion of the water peak shape from the typical broad singlet. The new Allow Any Multiplicity of Water Signal option identifies a signal within the water range in the 1H spectrum that does not have a match in the HSQC 1H projection as the water signal.

Improved Recognition of CHF2 Signals in HSQC Spectra

  • You can now automatically detect and assign CHF2 peaks in HSQC spectra more accurately with improved analysis and assignment algorithms.

Account for Signal Attenuation Due to Water Suppression

  • You can now account for attenuation of signals adjacent to the water peak due to water suppression techniques to enable accurate automatic assignment. The new Adjacent Signals are Attenuated option loosens the integral restrictions for all multiplets within 0.1 ppm of the position of the water peak in the auto-assignment protocol.

Internal Standard qNMR Concentration Calculation Now Included Out of the Box

  • Internal standard qNMR calculations are now available in the interface, similar to the external standard workflow (previously available as a script provided upon request).

Conveniently Calculate Similarity Score Between Two 1D Spectra

  • You can now calculate the Hit Quality Index (HQI) between two 1D spectra of the same nucleus without the need for the reference spectrum to be in a database. This can provide a quick quantification of the match between the current sample spectrum and that of a standard.

Better Peak Handling for 19F Spectra with Strong Couplings

  • You can now automatically pick and assign peaks in 19F spectra of structures containing CHF2 groups more accurately. When the proposed structure contains these groups, the software checks the spectrum for peaks associated with a typical AB spin system for F atoms (two strongly coupled doublets with an evident ‘roof’ effect).

Expanded 1H-31P Coupling Ranges in Auto Assignment

  • You can now more accurately assign and verify structures whose spectra contain large 1H-31P coupling constants with increased upper limits for JHP. The new expanded ranges are: 

    • 3–20 Hz for 2JHP

    • 0–20 Hz for 3JHP

    • 0–6 Hz for 4JHP

Define Parameters Once for All Replicates in External Standard qNMR

  • You can now define parameters including pulse angle, scans, and receiver gain once and have them applied to all selected spectra in external standard qNMR workflows with replicates when they cannot be automatically extracted from the raw data files.

Prediction

Updated Prediction Databases

Image 1 from WN Structure Elucidator Suite v2026.docx
  • You can now predict spectra based on databases with thousands more structures, chemical shifts, and coupling constants.

Accurately Predict 19F Spectra of Structures with Diastereotopic Fluorine Atoms

  • You can now predict 19F spectra with an improved algorithm that recognizes diastereotopic fluorine atoms.

Databasing

Ease of Use

  • Choose to hide the “Custom Screen Form” toolbar for greater screen real-estate.
  • You now have a new option to visualize the stereochemical configuration of select stereocenters in database records. Previously you could either display or hide all stereocenters.

Reporting

Set the Relative Height of “Median” Peak in Report

  • You can now better control the “Fit” option for dynamic Y-scaling of the 1D spectra in the reporting templates with the new Ratio parameter that allows you to specify the relative height of the “median” peak in the report.
Image 2 from WN Structure Elucidator Suite v2026.docx

Use the new ratio parameter for dynamic y-scaling of 1D spectra. 
Left spectrum has a fit = 90%, right = 10%

Data Import & Export

Export All NMR Spectra in a Project to a Single JSON File

  • You can now export all NMR spectra in a project to a single JSON file.

Import Bio-Sequence Assignments from Any NMR Spectrum

  • You can now import assignments for biomolecules from any NMR spectrum in STR format.

Include Structure Information in Data Exported in JSON Format

  • You can now include structure information in records/databases exported in JSON format via .mol files.

Improved MS & Chrom Data Import

  • Improved import filters for Thermo UVPD MSn data.

Processing MS & Chrom Data

Data Analysis & Processing

Faster, Smarter Fragmentation for Complex Peptide Analysis

Improved fragmentation algorithms enable faster processing of complex peptide samples, reducing hands-on time, and providing more comprehensive structural characterization, especially for complex cyclic peptides.

  • You can now process samples at least twice as fast as previous versions, dramatically reducing analysis time and increasing throughput for high-volume workflows.
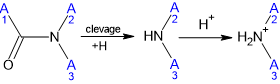
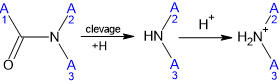
  • You now have an additional sub-rule to allow for amide bond-reprotonatation, generating more biologically relevant "y-type" ions (Roepstorff-Fohlman-Biemann nomenclature) and improving structural confidence for cyclic peptides.
Image 3 from WN Structure Elucidator Suite v2026.docx

Amide bond reprotontation sub-rule applied to cyclic peptide fragmentation. This enhancement generates additional y-type ions by allowing proton transfer post-cleavage, improving fragment annotation and structural confidence.

  • You can now apply fragmentation across all selected components and their corresponding MS1 and MSn components and raw scans with minimal user interaction, freeing analysts to focus on other tasks while processing occurs in the background.
  • You can filter the resultant Table of Fragments by ion type (a-, b-, c-, x-, y-, z-, user-labeled, and non-labeled ions), enabling rapid identification of the most relevant fragments and simplifying analysis.

Dynamic Labeling for Cyclic Peptides

Dynamic labeling for cyclic peptides eliminates the need for manual library setup and provides flexible visualization options, accelerating structure characterization and simplifying complex peptide analysis.

  • You can now label cyclic peptides dynamically using one-letter and three-letter notations, without adding cyclic structures to the biosequence library to use cyclic peptide ion type labels—saving setup time and reducing library maintenance.
  • You can now run AutoAssignment for structures in your preferred view in either expanded (classic) or collapsed (1- or 3-letter notation)—giving you the flexibility to work in the format that best suits your workflow and interpretation needs.

Save Time with Fragment Transfer

  • You can now optionally transfer any fragment assignments directly to the query spectrum for the best hit found during an IXCR spectral search into a user-created database—accelerating structure elucidation and reducing manual interpretation time.

Improvements in Quantitation

Enhancements have been made to simplify quantitation and calibration workflows and enhance ease of use, delivering greater flexibility, precision, and efficiency. Using these features, you can now:

  • Optionally apply a weighting factor ‘1/x’ to first-degree polynomial calibration curves, enabling more accurate quantitation at lower concentration levels.
  • Add any chromatographic parameter to the calibration table, permitting configuration of a single table with all needed information.
  • View retention times and compound names as chromatographic descriptors for traces in the LC/UV/MS legend to simplify data interpretation.
  • Update the nominal amount directly from the calibration curve, without needing to restart the calibration project.
  • Re-access and edit the retention time window for the components after calculation of the calibration curve, saving time when refining calibration parameters.
  • Use Summed XICs (molecular and additional ions, that can be satellite, fragment, or adduct ions) for calibration and quantitation, providing more robust quantitation by incorporating multiple related ions.

Store MS3 Component Spectra in Spectrus DB

  • You can now store MS3 component spectra in Spectrus DB.

Improved Mass Accuracy

  • You can now set up fixed mass accuracy to calculate summed XICs. The following parameters have been introduced: 

    • XIC accuracy units = 0 (0-Da, 1-ppm)

    • XIC accuracy = 0.5 (0.5 Da is default value)

    • XIC accuracy (ppm) = 500 (500 ppm is default value)

    • Auto calculate summed XIC accuracy = True (by default we use dynamic accuracy) 

  • You can now set up mass accuracy for Isotope Pattern Calculator in ppm.

Seamless Analysis from a Wider Range of Instrument Types

  • You can now change the chromatogram type from xC/UV/MS to HPLC, GC, or CE, enabling seamless analysis of chromatography data from a wider range of instrument types.

Simplified Peak Naming

Save time and reduce errors with enhancements to peak naming when using UV peak matching tools. With these enhancements you can:

  • Automatically apply peak names across your entire dataset when using UV peak matching tools, eliminating repetitive manual labeling and ensuring consistent nomenclature.
  • Selectively retain previously assigned peak names (except “unknown”) during re-processing, preserving your work and enabling an iterative approach to data analysis without starting from scratch.

Improved Calculation and Display of Isotope Patterns

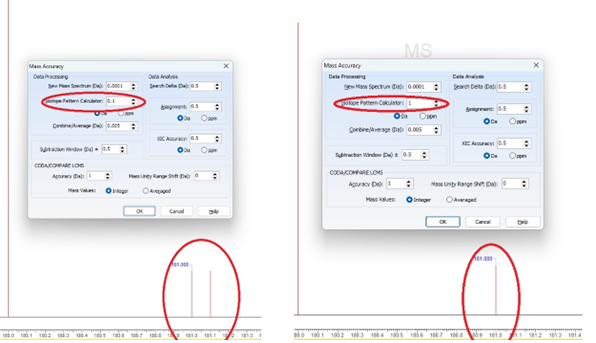
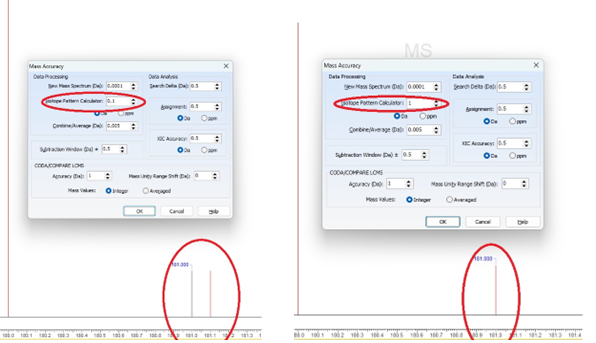
  • You can now set the mass accuracy and calculate the Isotope Pattern based on formulae for manual or Auto Assigned fragments, improving confidence in fragment assignments by providing more accurate isotope pattern matching.
Image 4 from WN Structure Elucidator Suite v2026.docx

Calculated Isotope Patterns for fragments, left shows Isotope Pattern Calculator set at 0.1 and right shows Isotope Pattern Calculator set at 1.

Improved Visualization of MS/MS Spectra

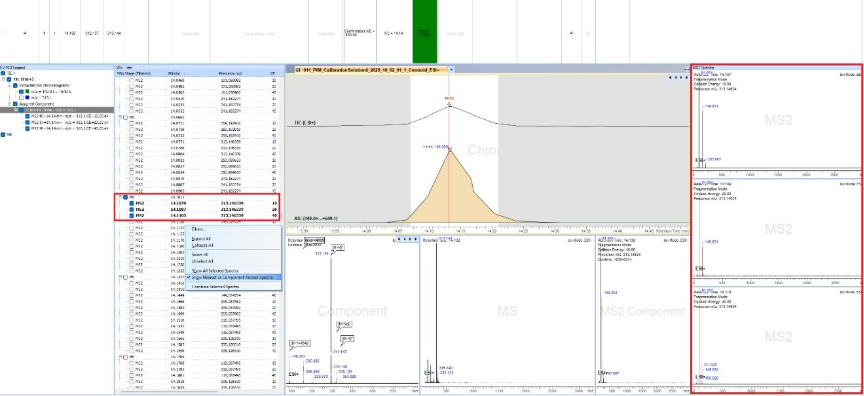
  • You now have the option to “Show Nearest or Component Related Spectra” to display all MS/MS spectra related to the selected component/precursor.
Image 5 from WN Structure Elucidator Suite v2026.docx

Visualization of three MS/MS Spectra related to the selected component.

Component Spectrum Flexibility

  • You can now create component spectra based on the most abundant adduct ion ([M+H]+, [M+NH4]+, [M+K]+, etc.) This is particularly useful when the [M+H]+ ion is weak or exhibits a very low intensity.

Better Handling of Peptide Structures

  • Peptides can now be displayed in a simplified form in the Table of Components, making it easier to distinguish and interpret individual structures.

Import Components without Retention Time Assignments

  • You can now use existing datafiles to generate target lists (.sdf) for more streamlined batch processing. Components can be imported with or without existing retention times, reducing erroneous assignments and enabling reuse of component files across targeted analysis and other workflows.

Display Combined Retention Time

  • You can now display the combined retention time (tR) instead of scan numbers for clearer interpretation of chromatographic data.

Databasing

Create, View, and Edit LC Simulator Files in the Database

  • You can now edit and update LC Simulator .lc7 files in Spectrus databases.
  • You can now create a Spectrus DB screen form for convenient review of LC Sim Project records.
Image 6 from WN Structure Elucidator Suite v2026.docx

Handle LC Simulator files in database view.

Reporting

Improvements to the Reporting Template

  • Deconvoluted mass spectra can now be added to the Report by Template along with Raw and Component spectra.

Select Components for Reporting

  • You can now choose which components from the Table of Components are included in reports when using the Component/Peak Layout Organizer.

Simplified Peptide Reporting

  • You can now report peptides in a simplified form for clearer presentation in reports.
Ease of Use

  • You can now populate the “synonym” field in the Table of Components from the same field of the database record (when available). 

  • You can now navigate directly from the Table of Components to the hit record in the database after running IXCR. 

  • Settings for IX, IXCR, and ITA are stored along with the individual processed data set/traces. 

  • “AutoAssignment Options” dialog now displays when the command “Auto Assign All Selected Components” is activated from the Table of Components. 

  • You can now re-execute a Formulae Generator for selected components (previously you could only run Formulae Generator once for All or Selected components. 

  • You can now export unassigned components from the Table of Components to an .sdf file.

What’s New

We are delighted to release our new version of AutoChrom®, Version 2026.

Highlighted Features

  • Accelerate method development with end-to-end automation.
  • Create composite chromatograms.
  • Improved searchability of method parameters in database.

Administrators are recommended to subscribe to the channels within our support news site found at https://support.revvitysignals.com/hc/en-us/categories/360004446171-Support-News which contains more information about releases and other pertinent product information.

Further Details

Version 2026 adds new features including end-to-end automation of method development. There are also improvements to reporting, and more.

Data Analysis & Processing

Accelerate Method Development with End-to-End Automation

New end-to-end automation capabilities streamline method development workflows. You can now automate the entire method development lifecycle from screening through optimization, reducing hands-on time, minimizing human error, and enabling unattended execution of routine workflows, so methods can run overnight or in the background.

  • The new Auto-Proceed feature automates almost every step of a standard method development workflow (excluding data processing), saving time and improving workflow consistency.

Create Composite Chromatograms

You can now create a single composite chromatogram by combining multiple experimental chromatograms acquired using the same chromatographic method, to provide a clearer representation of the expected separation when method suitability criteria are met.

  • Composite chromatograms are automatically labeled with an asterisk (*) after the original chromatogram name, helping you to quickly identify combined data in your project.
  • Two experimental chromatograms can be merged when: 

    • All optimization factor values are defined and identical between chromatograms

    • Chromatograms use the same detector parameters

Easier Interpretation of Method Optimization Results

  • You can now view the calculated Method Operable Design Region (MODR) as both a graphical rectangle and numeric text in the status bar of the Resolution Map window, making it easier to interpret optimization results and identify suitable operating conditions.

Simplified Configuration of Autonomous Processing

  • You can now edit the configuration settings for Autonomous Processing in a dedicated dialog box, making it easier to configure, save, and reuse processing parameters.

Component Spectrum Flexibility

  • You can now create component spectra based on the most abundant adduct ion ([M+H]+, [M+NH4]+, [M+K]+, etc.) This is particularly useful when the [M+H]+ ion is weak or exhibits a very low intensity.

Better Handling of Peptide Structures

  • Peptides can now be displayed in a simplified form in the Table of Components, making it easier to distinguish and interpret individual structures.

Import Components without Retention Time Assignments

  • You can now use existing datafiles to generate target lists (.sdf) for more streamlined batch processing. Components can be imported with or without existing retention times, reducing erroneous assignments and enabling reuse of component files across targeted analysis and other workflows.

Display Combined Retention Time

  • You can now display the combined retention time (tR) instead of scan numbers for clearer interpretation of chromatographic data.

Databasing

Improved Searchability of Method Parameters in Database

Enhancements to method parameter management in the database minimizes time-consuming manual searches and removes the need to recreate project files. You can now expect greater ease in searching and maintaining LC Simulator projects with the ability to:

  • Add LC Simulator files (.lc7) to the database, enabling rapid retrieval and comparison of method parameters across projects
  • Maintain and update stored method information without recreating project files by editing/updating stored .lc7 files, including chemical structures, selection mode, and prediction mode, preserving your existing work and streamlining ongoing method management.

More Convenient Review of LC Simulator Project Records

Managing and reviewing LC Simulator projects is now faster and more intuitive. You now have a ready-to-use database template and improved navigation that reduces the time spent searching for and switching between related projects. You can now edit and update LC Simulator (.lc7) files in Spectrus databases.

  • A new example Spectrus DB database record containing the LC Simulator Project screen form provides a ready-to-use template for creating local or remote LC Simulator project databases, eliminating the need to build project structures from scratch.
  • Improved navigation allows you to move between multiple LC Simulator projects stored on the same parent record more quickly and easily, reducing review time and keeping your workflow moving.
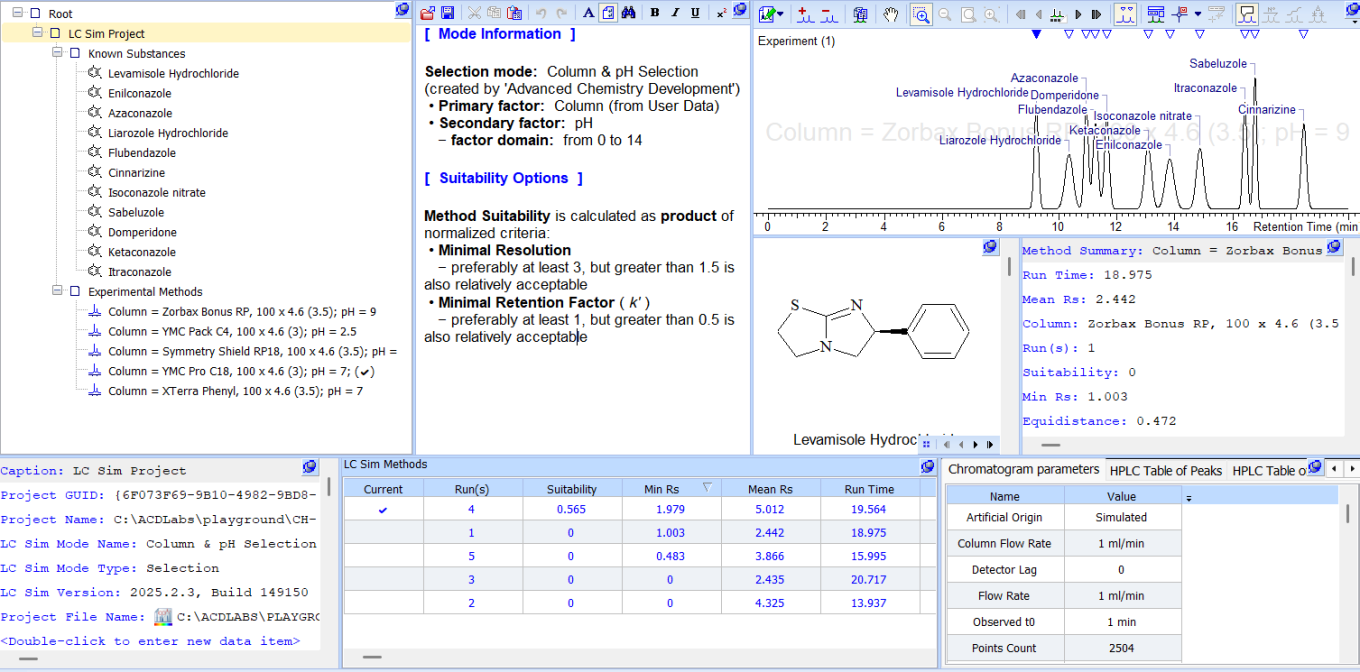
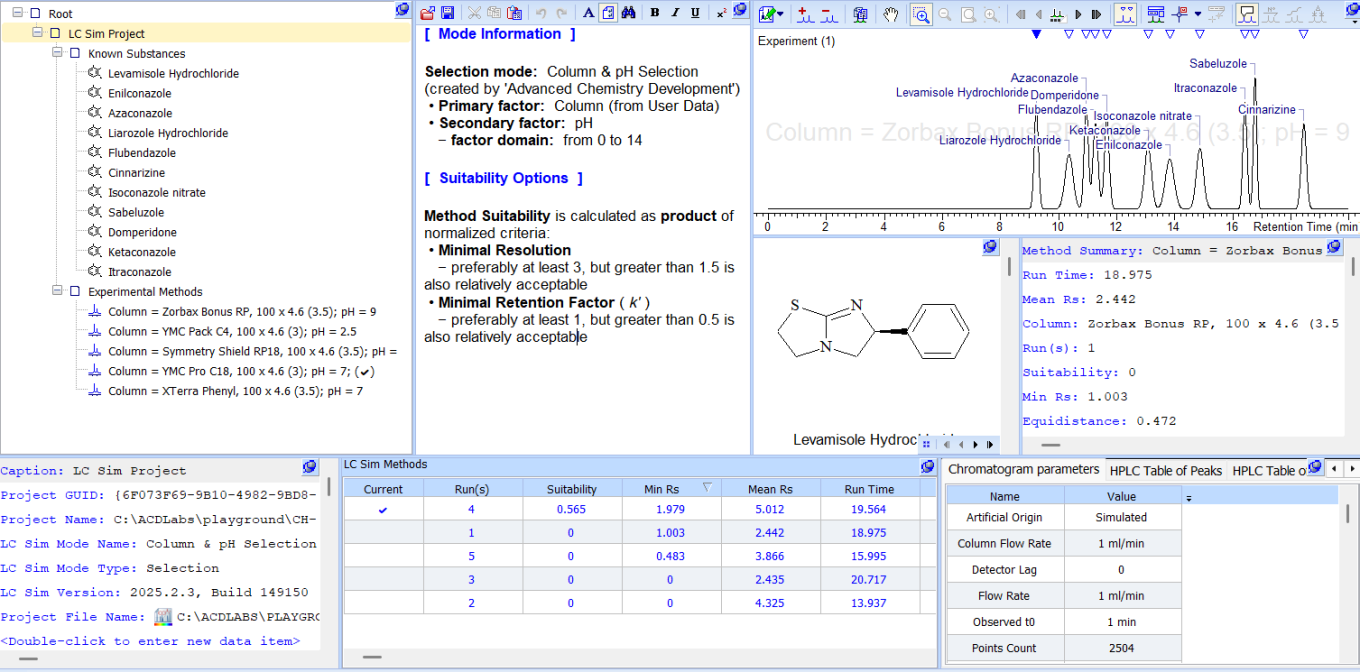
  • You can now create a Spectrus DB screen form for convenient review of LC Simulator Project records.
Image 1 from WN AutoChrom v2026.docx

Handle LC Simulator files in database view.

Ease of Use

  • Choose to hide the “Custom Screen Form” toolbar for greater screen real-estate.
  • You now have a new option to visualize the stereochemical configuration of select stereocenters in database records. Previously you could either display or hide all stereocenters.

Reporting

Greater Flexibility and Consistency Across Reporting

Reporting templates have been enhanced to provide greater flexibility and consistency across products.

  • The reporting template now supports gradient substitution, MODR substitution for the current variable gradient parameter, and custom defined gradient parameters.

These enhancements simplify report creation and enable more comprehensive presentation of method development results.

Select Components for Reporting

  • You can now choose which components from the Table of Components are included in reports when using the Component/Peak Layout Organizer.

Simplified Peptide Reporting

  • You can now report peptides in a simplified form for clearer presentation in reports.
Ease of Use

  • You can now more easily locate and configure frequently used settings with the simplified Component Interpretation Options dialog box.

Data Import & Export

Improved MS & Chrom Data Import

  • Improved import filters for Thermo UVPD MSn data.

Include Structure Information in Data Exported in JSON Format

  • You can now include structure information in records/databases exported in JSON format via .mol files.

Processing NMR Data

Data Analysis & Processing

Internal Standard qNMR Concentration Calculation Now Included Out of the Box

  • Internal standard qNMR calculations are now available in the interface, similar to the external standard workflow (previously available as a script provided upon request).

Conveniently Calculate Similarity Score Between Two 1D Spectra

  • You can now calculate the Hit Quality Index (HQI) between two 1D spectra of the same nucleus without the need for the reference spectrum to be in a database. This can provide a quick quantification of the match between the current sample spectrum and that of a standard.

Better Peak Handling for 19F Spectra with Strong Couplings

  • You can now automatically pick and assign peaks in 19F spectra of structures containing CHF2 groups more accurately. When the proposed structure contains these groups, the software checks the spectrum for peaks associated with a typical AB spin system for F atoms (two strongly coupled doublets with an evident ‘roof’ effect).

Expanded 1H-31P Coupling Ranges in Auto Assignment

  • You can now more accurately assign and verify structures whose spectra contain large 1H-31P coupling constants with increased upper limits for JHP. The new expanded ranges are: 

    • 3–20 Hz for 2JHP

    • 0–20 Hz for 3JHP

    • 0–6 Hz for 4JHP

Define Parameters Once for All Replicates in External Standard qNMR

  • You can now define parameters including pulse angle, scans, and receiver gain once and have them applied to all selected spectra in external standard qNMR workflows with replicates when they cannot be automatically extracted from the raw data files.

Reporting

Set the Relative Height of “Median” Peak in Report

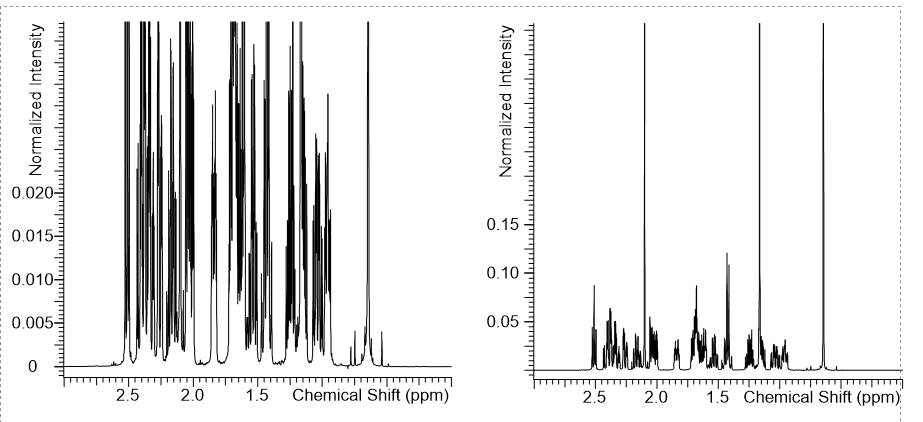
  • You can now better control the “Fit” option for dynamic Y-scaling of the 1D spectra in the reporting templates with the new Ratio parameter that allows you to specify the relative height of the “median” peak in the report.
Image 2 from WN AutoChrom v2026.docx

Use the new ratio parameter for dynamic y-scaling of 1D spectra. 
Left spectrum has a fit = 90%, right = 10%

What’s New

We are delighted to release our new version of Method Selection Suite ™, Version 2026.

Highlighted Features

  • Create composite chromatograms.
  • Improved searchability of method parameters in database.

Administrators are recommended to subscribe to the channels within our support news site found at https://support.revvitysignals.com/hc/en-us/categories/360004446171-Support-News which contains more information about releases and other pertinent product information.

Further Details

Version 2026 adds new features including the creation of composite chromatogram. There are also improvements to searchability parameters, and more.

Data Analysis & Processing

Create Composite Chromatograms

You can now create a single composite chromatogram by combining multiple experimental chromatograms acquired using the same chromatographic method, to provide a clearer representation of the expected separation when method suitability criteria are met.

  • Composite chromatograms are automatically labeled with an asterisk (*) after the original chromatogram name, helping you to quickly identify combined data in your project.
  • Two experimental chromatograms can be merged when: 

    • All optimization factor values are defined and identical between chromatograms

    • Chromatograms use the same detector parameters

Component Spectrum Flexibility

  • You can now create component spectra based on the most abundant adduct ion ([M+H]+, [M+NH4]+, [M+K]+, etc.) This is particularly useful when the [M+H]+ ion is weak or exhibits a very low intensity.

Better Handling of Peptide Structures

  • Peptides can now be displayed in a simplified form in the Table of Components, making it easier to distinguish and interpret individual structures.

Import Components without Retention Time Assignments

  • You can now use existing datafiles to generate target lists (.sdf) for more streamlined batch processing. Components can be imported with or without existing retention times, reducing erroneous assignments and enabling reuse of component files across targeted analysis and other workflows.

Display Combined Retention Time

  • You can now display the combined retention time (tR) instead of scan numbers for clearer interpretation of chromatographic data.

Databasing

Improved Searchability of Method Parameters in Database

Enhancements to method parameter management in the database minimizes time-consuming manual searches and removes the need to recreate project files. You can now expect greater ease in searching and maintaining LC Simulator projects with the ability to:

  • Add LC Simulator files (.lc7) to the database, enabling rapid retrieval and comparison of method parameters across projects
  • Maintain and update stored method information without recreating project files by editing/updating stored .lc7 files, including chemical structures, selection mode, and prediction mode, preserving your existing work and streamlining ongoing method management.

More Convenient Review of LC Simulator Project Records

Managing and reviewing LC Simulator projects is now faster and more intuitive. You now have a ready-to-use database template and improved navigation that reduces the time spent searching for and switching between related projects. You can now edit and update LC Simulator (.lc7) files in Spectrus databases.

  • A new example Spectrus DB database record containing the LC Simulator Project screen form provides a ready-to-use template for creating local or remote LC Simulator project databases, eliminating the need to build project structures from scratch.
  • Improved navigation allows you to move between multiple LC Simulator projects stored on the same parent record more quickly and easily, reducing review time and keeping your workflow moving.
  • You can now create a Spectrus DB screen form for convenient review of LC Simulator Project records.
Image 1 from WN Method Selection Suite v2026.docx

Handle LC Simulator files in database view.

Ease of Use

  • Choose to hide the “Custom Screen Form” toolbar for greater screen real-estate.
  • You now have a new option to visualize the stereochemical configuration of select stereocenters in database records. Previously you could either display or hide all stereocenters.

Reporting

Select Components for Reporting

  • You can now choose which components from the Table of Components are included in reports when using the Component/Peak Layout Organizer.

Simplified Peptide Reporting

  • You can now report peptides in a simplified form for clearer presentation in reports.
Data Import & Export

Improved MS & Chrom Data Import

  • Improved import filters for Thermo UVPD MSn data.

Include Structure Information in Data Exported in JSON Format

  • You can now include structure information in records/databases exported in JSON format via .mol files.

Processing NMR Data

Data Analysis & Processing

Internal Standard qNMR Concentration Calculation Now Included Out of the Box

  • Internal standard qNMR calculations are now available in the interface, similar to the external standard workflow (previously available as a script provided upon request).

Conveniently Calculate Similarity Score Between Two 1D Spectra

  • You can now calculate the Hit Quality Index (HQI) between two 1D spectra of the same nucleus without the need for the reference spectrum to be in a database. This can provide a quick quantification of the match between the current sample spectrum and that of a standard.

Better Peak Handling for 19F Spectra with Strong Couplings

  • You can now automatically pick and assign peaks in 19F spectra of structures containing CHF2 groups more accurately. When the proposed structure contains these groups, the software checks the spectrum for peaks associated with a typical AB spin system for F atoms (two strongly coupled doublets with an evident ‘roof’ effect).

Expanded 1H-31P Coupling Ranges in Auto Assignment

  • You can now more accurately assign and verify structures whose spectra contain large 1H-31P coupling constants with increased upper limits for JHP. The new expanded ranges are: 

    • 3–20 Hz for 2JHP

    • 0–20 Hz for 3JHP

    • 0–6 Hz for 4JHP

Define Parameters Once for All Replicates in External Standard qNMR

  • You can now define parameters including pulse angle, scans, and receiver gain once and have them applied to all selected spectra in external standard qNMR workflows with replicates when they cannot be automatically extracted from the raw data files.

Reporting

Set the Relative Height of “Median” Peak in Report

  • You can now better control the “Fit” option for dynamic Y-scaling of the 1D spectra in the reporting templates with the new Ratio parameter that allows you to specify the relative height of the “median” peak in the report.
Image 2 from WN Method Selection Suite v2026.docx

Use the new ratio parameter for dynamic y-scaling of 1D spectra. 
Left spectrum has a fit = 90%, right = 10%

What’s New

We are delighted to release our new version of Luminata®, Version 2026.

Highlighted Features

  • Direct export to JSON format in reaction & batch genealogy record set.
  • Enhancements to the forced degradation and stability study use case.

Administrators are recommended to subscribe to the channels within our support news site found at https://support.revvitysignals.com/hc/en-us/categories/360004446171-Support-News which contains more information about releases and other pertinent product information.

Further Details

Version 2026 adds new features including the ability to export to JSON format from the reaction and batch genealogy record set. There are also improvements to the visualization capabilities for forced degradation pathways.

Databasing

Create, View, and Edit LC Simulator Files in the Database

  • You can now edit and update LC Simulator .lc7 files in Spectrus databases.
  • You can now create a Spectrus DB screen form for convenient review of LC Sim Project records.
Image 1 from WN Luminata v2026.docx

Handle LC Simulator files in database view.

Data Management & Visualization

Enhancements to the Forced Degradation and Stability Study Use Case

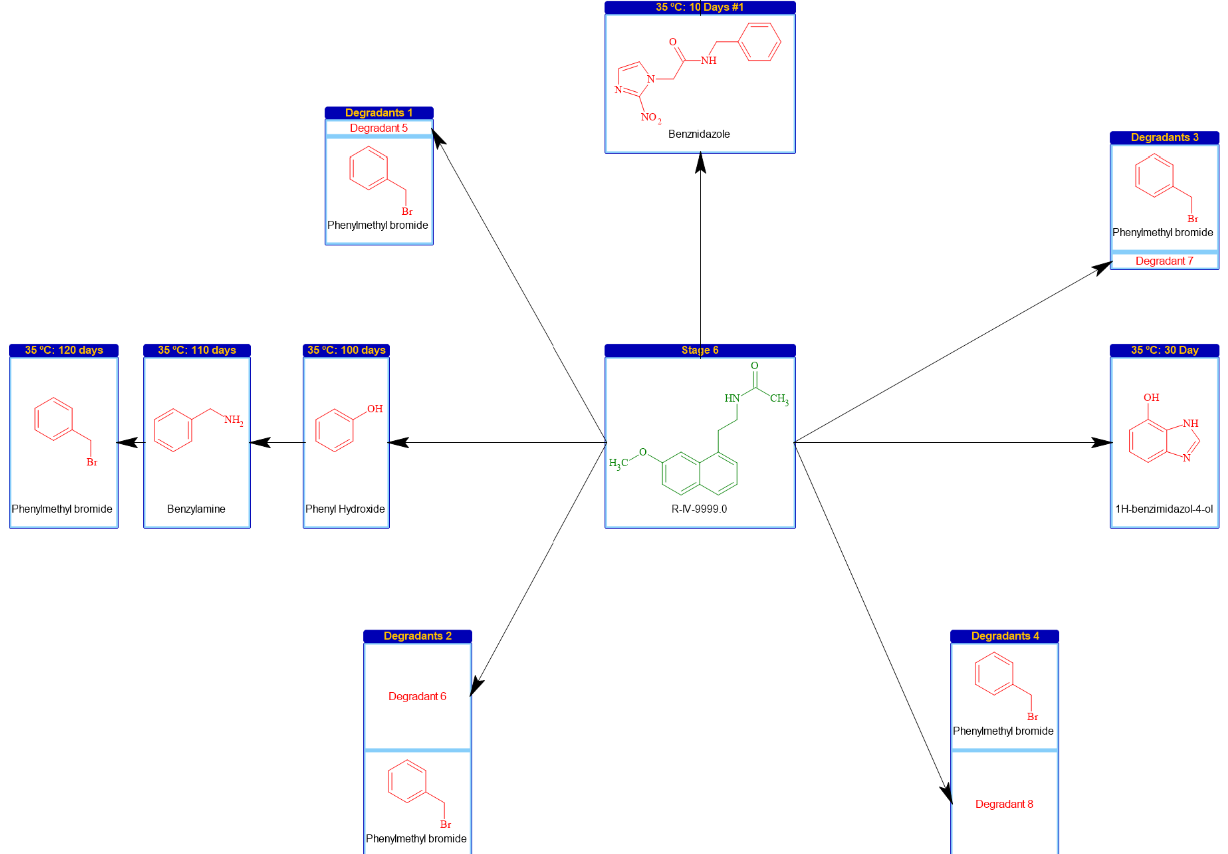
  • You can now select significant degradants from each material study and use them to create a significant degradant map (degradants observed in multiple materials studies).
  • You can now view degradants from multiple studies in a single view by choosing to position the API in the center with degradants from different studies surrounding it. (Linear default view is still available for single degradant studies.)

Visualize the degradant and stability map with the API at the center.

Ease of Use

  • View data in numerous tables with the expanded heat map capability.
  • Edit sample name in the control chart and genealogy analysis table.
  • Add a batch without associating it to a project and/or process name.
  • Reorder entities within the process map.
  • Choose to hide the “Custom Screen Form” toolbar for greater screen real-estate.
  • You now have a new option to visualize the stereochemical configuration of select stereocenters in database records. Previously you could either display or hide all stereocenters.

Data Import & Export

Direct Export to JSON Format in Reaction & Batch Genealogy Record Set

  • You can now export all the data related to a record set containing synthetic reaction pathways and batch genealogies in JSON format (applies for one or more records).

Include Structure Information in Data Exported in JSON Format

  • You can now include structure information in records/databases exported in JSON format via .mol files.

Improved MS & Chrom Data Import

  • Improved import filters for Thermo UVPD MSn data

Processing MS & Chrom Data with Luminata

Data Analysis & Processing

Component Spectrum Flexibility

  • You can now create component spectra based on the most abundant adduct ion ([M+H]+, [M+NH4]+, [M+K]+, etc.) This is particularly useful when the [M+H]+ ion is weak or exhibits a very low intensity.

Better Handling of Peptide Structures

  • Peptides can now be displayed in a simplified form in the Table of Components, making it easier to distinguish and interpret individual structures.

Import Components without Retention Time Assignments

  • You can now use existing datafiles to generate target lists (.sdf) for more streamlined batch processing. Components can be imported with or without existing retention times, reducing erroneous assignments and enabling reuse of component files across targeted analysis and other workflows.

Display Combined Retention Time

  • You can now display the combined retention time (tR) instead of scan numbers for clearer interpretation of chromatographic data.

Reporting

Select Components for Reporting

  • You can now choose which components from the Table of Components are included in reports when using the Component/Peak Layout Organizer.

Simplified Peptide Reporting

  • You can now report peptides in a simplified form for clearer presentation in reports.
Processing NMR Data with Luminata

Data Analysis & Processing

Internal Standard qNMR Concentration Calculation Now Included Out of the Box

  • Internal standard qNMR calculations are now available in the interface, similar to the external standard workflow (previously available as a script provided upon request).

Conveniently Calculate Similarity Score Between Two 1D Spectra

  • You can now calculate the Hit Quality Index (HQI) between two 1D spectra of the same nucleus without the need for the reference spectrum to be in a database. This can provide a quick quantification of the match between the current sample spectrum and that of a standard.

Better Peak Handling for 19F Spectra with Strong Couplings

  • You can now automatically pick and assign peaks in 19F spectra of structures containing CHF2 groups more accurately. When the proposed structure contains these groups, the software checks the spectrum for peaks associated with a typical AB spin system for F atoms (two strongly coupled doublets with an evident ‘roof’ effect).

Expanded 1H-31P Coupling Ranges in Auto Assignment

  • You can now more accurately assign and verify structures whose spectra contain large 1H-31P coupling constants with increased upper limits for JHP. The new expanded ranges are: 
    • 3–20 Hz for 2JHP
    • 0–20 Hz for 3JHP
    • 0–6 Hz for 4JHP

Define Parameters Once for All Replicates in External Standard qNMR

  • You can now define parameters including pulse angle, scans, and receiver gain once and have them applied to all selected spectra in external standard qNMR workflows with replicates when they cannot be automatically extracted from the raw data files.

Reporting

Set the Relative Height of “Median” Peak in Report

  • You can now better control the “Fit” option for dynamic Y-scaling of the 1D spectra in the reporting templates with the new Ratio parameter that allows you to specify the relative height of the “median” peak in the report.
Image 3 from WN Luminata v2026.docx

Use the new ratio parameter for dynamic y-scaling of 1D spectra. 
Left spectrum has a fit = 90%, right = 10%

What’s New

We are delighted to release our new version of ChemAnalytical Workbook™, Version 2026.

Highlighted Feature

  • Create, view, and edit LC Simulator files in the database.

Administrators are recommended to subscribe to the channels within our support news site found at https://support.revvitysignals.com/hc/en-us/categories/360004446171-Support-News which contains more information about releases and other pertinent product information.

Further Details

Version 2026 adds new features for management of LC Simulator files. There are also improvements to data visualization and data export.

Databasing

Create, View, and Edit LC Simulator Files in the Database

  • You can now edit and update LC Simulator .lc7 files in Spectrus databases.
  • You can now create a Spectrus DB screen form for convenient review of LC Sim Project records.
Image 1 from WN ChemAnalytical Workbook v2026.docx

Handle LC Simulator files in database view.

Ease of Use

  • Choose to hide the “Custom Screen Form” toolbar for greater screen real-estate.
  • You now have a new option to visualize the stereochemical configuration of select stereocenters in database records. Previously you could either display or hide all stereocenters.

Data Import & Export

Import Bio-Sequence Assignments from Any NMR Spectrum

  • You can now import assignments for biomolecules from any NMR spectrum in STR format.

Include Structure Information in Data Exported in JSON Format

  • You can now include structure information in records/databases exported in JSON format via .mol files.

Improved MS & Chrom Data Import

  • Improved import filters for Thermo UVPD MSn data.

Processing MS & Chrom Data

Data Analysis & Processing

Component Spectrum Flexibility

  • You can now create component spectra based on the most abundant adduct ion ([M+H]+, [M+NH4]+, [M+K]+, etc.) This is particularly useful when the [M+H]+ ion is weak or exhibits a very low intensity.

Better Handling of Peptide Structures

  • Peptides can now be displayed in a simplified form in the Table of Components, making it easier to distinguish and interpret individual structures.

Import Components without Retention Time Assignments

  • You can now use existing datafiles to generate target lists (.sdf) for more streamlined batch processing. Components can be imported with or without existing retention times, reducing erroneous assignments and enabling reuse of component files across targeted analysis and other workflows.

Display Combined Retention Time

  • You can now display the combined retention time (tR) instead of scan numbers for clearer interpretation of chromatographic data.

Reporting

Select Components for Reporting

  • You can now choose which components from the Table of Components are included in reports when using the Component/Peak Layout Organizer.

Simplified Peptide Reporting

  • You can now report peptides in a simplified form for clearer presentation in reports.
Processing NMR Data

Data Analysis & Processing

Internal Standard qNMR Concentration Calculation Now Included Out of the Box

  • Internal standard qNMR calculations are now available in the interface, similar to the external standard workflow (previously available as a script provided upon request).

Conveniently Calculate Similarity Score Between Two 1D Spectra

  • You can now calculate the Hit Quality Index (HQI) between two 1D spectra of the same nucleus without the need for the reference spectrum to be in a database. This can provide a quick quantification of the match between the current sample spectrum and that of a standard.

Better Peak Handling for 19F Spectra with Strong Couplings

  • You can now automatically pick and assign peaks in 19F spectra of structures containing CHF2 groups more accurately. When the proposed structure contains these groups, the software checks the spectrum for peaks associated with a typical AB spin system for F atoms (two strongly coupled doublets with an evident ‘roof’ effect).

Expanded 1H-31P Coupling Ranges in Auto Assignment

  • You can now more accurately assign and verify structures whose spectra contain large 1H-31P coupling constants with increased upper limits for JHP. The new expanded ranges are: 
    • 3–20 Hz for 2JHP
    • 0–20 Hz for 3JHP
    • 0–6 Hz for 4JHP

Define Parameters Once for All Replicates in External Standard qNMR

  • You can now define parameters including pulse angle, scans, and receiver gain once and have them applied to all selected spectra in external standard qNMR workflows with replicates when they cannot be automatically extracted from the raw data files.

Reporting

Set the Relative Height of “Median” Peak in Report

  • You can now better control the “Fit” option for dynamic Y-scaling of the 1D spectra in the reporting templates with the new Ratio parameter that allows you to specify the relative height of the “median” peak in the report.
Image 2 from WN ChemAnalytical Workbook v2026.docx

Use the new ratio parameter for dynamic y-scaling of 1D spectra. 
Left spectrum has a fit = 90%, right = 10%

What’s New

We are delighted to release our new version of MS Workbook Suite™, Version 2026.

Highlighted Features

  • Faster, smarter fragmentation for complex peptide analysis.
  • Dynamic labeling for cyclic peptides.
  • Save time with fragment transfer.

Administrators are recommended to subscribe to the channels within our support news site found at https://support.revvitysignals.com/hc/en-us/categories/360004446171-Support-News which contains more information about releases and other pertinent product information.

Further Details

Version 2026 adds new features including faster fragmentation, dynamic labeling for cyclic peptides, and faster fragment transfer. There are also improvements in calibration and quantitation, and more.

Data Analysis & Processing

Faster, Smarter Fragmentation for Complex Peptide Analysis

Improved fragmentation algorithms enable faster processing of complex peptide samples, reducing hands-on time, and providing more comprehensive structural characterization, especially for complex cyclic peptides.

  • You can now process samples at least twice as fast as previous versions, dramatically reducing analysis time and increasing throughput for high-volume workflows.
  • You now have an additional sub-rule to allow for amide bond-reprotonatation, generating more biologically relevant "y-type" ions (Roepstorff-Fohlman-Biemann nomenclature) and improving structural confidence for cyclic peptides.
Image 1 from WN MS Workbook Suite v2026.docx

Amide bond reprotontation sub-rule applied to cyclic peptide fragmentation. This enhancement generates additional y-type ions by allowing proton transfer post-cleavage, improving fragment annotation and structural confidence.

  • You can now apply fragmentation across all selected components and their corresponding MS1 and MSn components and raw scans with minimal user interaction, freeing analysts to focus on other tasks while processing occurs in the background.
  • You can filter the resultant Table of Fragments by ion type (a-, b-, c-, x-, y-, z-, user-labeled, and non-labeled ions), enabling rapid identification of the most relevant fragments and simplifying analysis.

Dynamic Labeling for Cyclic Peptides

Dynamic labeling for cyclic peptides eliminates the need for manual library setup and provides flexible visualization options, accelerating structure characterization and simplifying complex peptide analysis.

  • You can now label cyclic peptides dynamically using one-letter and three-letter notations, without adding cyclic structures to the biosequence library to use cyclic peptide ion type labels—saving setup time and reducing library maintenance.
  • You can now run AutoAssignment for structures in your preferred view in either expanded (classic) or collapsed (1- or 3-letter notation)—giving you the flexibility to work in the format that best suits your workflow and interpretation needs.

Save Time with Fragment Transfer

  • You can now optionally transfer any fragment assignments directly to the query spectrum for the best hit found during an IXCR spectral search into a user-created database—accelerating structure elucidation and reducing manual interpretation time.

Improvements in Quantitation

Enhancements have been made to simplify quantitation and calibration workflows and enhance ease of use, delivering greater flexibility, precision, and efficiency. Using these features, you can now:

  • Optionally apply a weighting factor ‘1/x’ to first-degree polynomial calibration curves, enabling more accurate quantitation at lower concentration levels.
  • Add any chromatographic parameter to the calibration table, permitting configuration of a single table with all needed information.
  • View retention times and compound names as chromatographic descriptors for traces in the LC/UV/MS legend to simplify data interpretation.
  • Update the nominal amount directly from the calibration curve, without needing to restart the calibration project.
  • Re-access and edit the retention time window for the components after calculation of the calibration curve, saving time when refining calibration parameters.
  • Use Summed XICs (molecular and additional ions, that can be satellite, fragment, or adduct ions) for calibration and quantitation, providing more robust quantitation by incorporating multiple related ions.

Store MS3 Component Spectra in Spectrus DB

  • You can now store MS3 component spectra in Spectrus DB.

Improved Mass Accuracy

  • You can now set up fixed mass accuracy to calculate summed XICs. The following parameters have been introduced: 
    • XIC accuracy units = 0 (0-Da, 1-ppm)
    • XIC accuracy = 0.5 (0.5 Da is default value)
    • XIC accuracy (ppm) = 500 (500 ppm is default value)
    • Auto calculate summed XIC accuracy = True (by default we use dynamic accuracy)
  • You can now set up mass accuracy for Isotope Pattern Calculator in ppm.

Seamless Analysis from a Wider Range of Instrument Types

  • You can now change the chromatogram type from xC/UV/MS to HPLC, GC, or CE, enabling seamless analysis of chromatography data from a wider range of instrument types.

Simplified Peak Naming

Save time and reduce errors with enhancements to peak naming when using UV peak matching tools. With these enhancements you can:

  • Automatically apply peak names across your entire dataset when using UV peak matching tools, eliminating repetitive manual labeling and ensuring consistent nomenclature.
  • Selectively retain previously assigned peak names (except “unknown”) during re-processing, preserving your work and enabling an iterative approach to data analysis without starting from scratch.

Improved Calculation and Display of Isotope Patterns

  • You can now set the mass accuracy and calculate the Isotope Pattern based on formulae for manual or Auto Assigned fragments, improving confidence in fragment assignments by providing more accurate isotope pattern matching.
Image 2 from WN MS Workbook Suite v2026.docx

Calculated Isotope Patterns for fragments, left shows Isotope Pattern Calculator set at 0.1 and right shows Isotope Pattern Calculator set at 1.

Improved Visualization of MS/MS Spectra

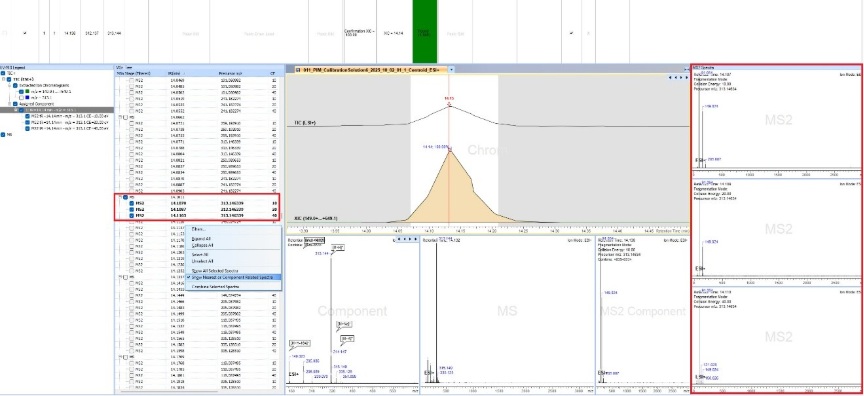
  • You now have the option to “Show Nearest or Component Related Spectra” to display all MS/MS spectra related to the selected component/precursor.
Image 3 from WN MS Workbook Suite v2026.docx

Visualization of three MS/MS Spectra related to the selected component.

Component Spectrum Flexibility

  • You can now create component spectra based on the most abundant adduct ion ([M+H]+, [M+NH4]+, [M+K]+, etc.) This is particularly useful when the [M+H]+ ion is weak or exhibits a very low intensity.

Better Handling of Peptide Structures

  • Peptides can now be displayed in a simplified form in the Table of Components, making it easier to distinguish and interpret individual structures.

Import Components without Retention Time Assignments

  • You can now use existing datafiles to generate target lists (.sdf) for more streamlined batch processing. Components can be imported with or without existing retention times, reducing erroneous assignments and enabling reuse of component files across targeted analysis and other workflows.

Display Combined Retention Time

  • You can now display the combined retention time (tR) instead of scan numbers for clearer interpretation of chromatographic data.

Databasing

Create, View, and Edit LC Simulator Files in the Database

  • You can now edit and update LC Simulator .lc7 files in Spectrus databases.
  • You can now create a Spectrus DB screen form for convenient review of LC Sim Project records.
Image 4 from WN MS Workbook Suite v2026.docx

Handle LC Simulator files in database view.

Ease of Use

  • Choose to hide the “Custom Screen Form” toolbar for greater screen real-estate.
  • You now have a new option to visualize the stereochemical configuration of select stereocenters in database records. Previously you could either display or hide all stereocenters.

Reporting

Improvements to the Reporting Template

  • Deconvoluted mass spectra can now be added to the Report by Template along with Raw and Component spectra.

Select Components for Reporting

  • You can now choose which components from the Table of Components are included in reports when using the Component/Peak Layout Organizer.

Simplified Peptide Reporting

  • You can now report peptides in a simplified form for clearer presentation in reports.
Ease of Use

  • You can now populate the “synonym” field in the Table of Components from the same field of the database record (when available).
  • You can now navigate directly from the Table of Components to the hit record in the database after running IXCR.
  • Settings for IX, IXCR, and ITA are stored along with the individual processed data set/traces.
  • “AutoAssignment Options” dialog now displays when the command “Auto Assign All Selected Components” is activated from the Table of Components.
  • You can now re-execute a Formulae Generator for selected components (previously you could only run Formulae Generator once for All or Selected components.
  • You can now export unassigned components from the Table of Components to an .sdf file.

Data Import & Export

Improved MS & Chrom Data Import

  • Improved import filters for Thermo UVPD MSn data.

Include Structure Information in Data Exported in JSON Format

  • You can now include structure information in records/databases exported in JSON format via .mol files.

Processing NMR Data

Data Analysis & Processing

Internal Standard qNMR Concentration Calculation Now Included Out of the Box

  • Internal standard qNMR calculations are now available in the interface, similar to the external standard workflow (previously available as a script provided upon request).

Conveniently Calculate Similarity Score Between Two 1D Spectra

  • You can now calculate the Hit Quality Index (HQI) between two 1D spectra of the same nucleus without the need for the reference spectrum to be in a database. This can provide a quick quantification of the match between the current sample spectrum and that of a standard.

Better Peak Handling for 19F Spectra with Strong Couplings

  • You can now automatically pick and assign peaks in 19F spectra of structures containing CHF2 groups more accurately. When the proposed structure contains these groups, the software checks the spectrum for peaks associated with a typical AB spin system for F atoms (two strongly coupled doublets with an evident ‘roof’ effect).

Expanded 1H-31P Coupling Ranges in Auto Assignment

  • You can now more accurately assign and verify structures whose spectra contain large 1H-31P coupling constants with increased upper limits for JHP. The new expanded ranges are: 
    • 3–20 Hz for 2JHP
    • 0–20 Hz for 3JHP
    • 0–6 Hz for 4JHP

Define Parameters Once for All Replicates in External Standard qNMR

  • You can now define parameters including pulse angle, scans, and receiver gain once and have them applied to all selected spectra in external standard qNMR workflows with replicates when they cannot be automatically extracted from the raw data files.

Reporting

Set the Relative Height of “Median” Peak in Report

  • You can now better control the “Fit” option for dynamic Y-scaling of the 1D spectra in the reporting templates with the new Ratio parameter that allows you to specify the relative height of the “median” peak in the report.
Image 5 from WN MS Workbook Suite v2026.docx

Use the new ratio parameter for dynamic y-scaling of 1D spectra. 
Left spectrum has a fit = 90%, right = 10%