LogP and LogD

Partition and Distribution Coefficient Calculators

Predict logP and logD values directly from chemical structure.
LogP and LogD

Explore

Understand Molecular Lipophilicity

LogP predicts partition coefficients, while logD predicts distribution coefficient, helping you evaluate molecular lipophilicity across different ionization states and pH conditions.

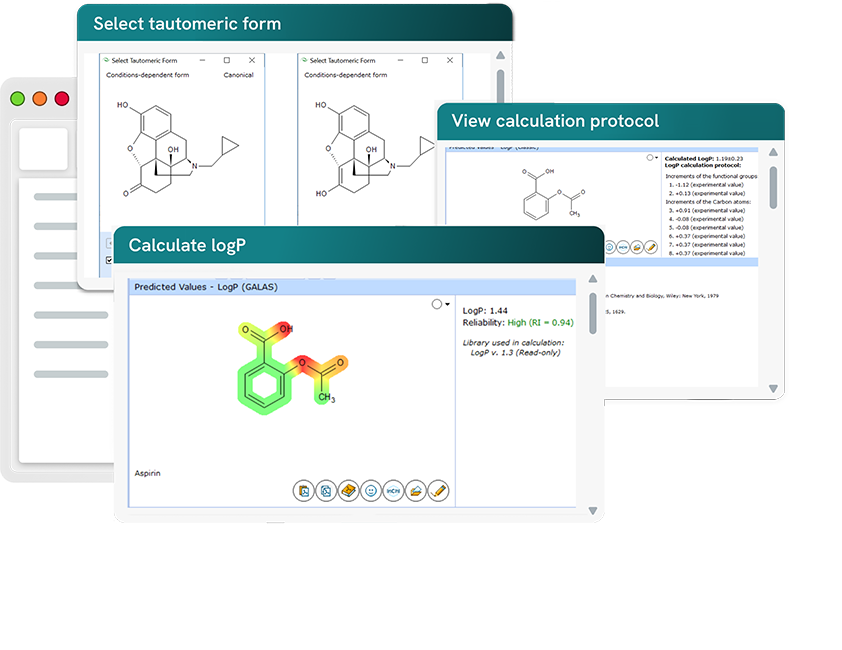
Calculate the partition coefficient (logP) for neutral molecules
 

Identify hydrophilic and hydrophobic fragments of a structure
 

Train prediction models using experimental measurements

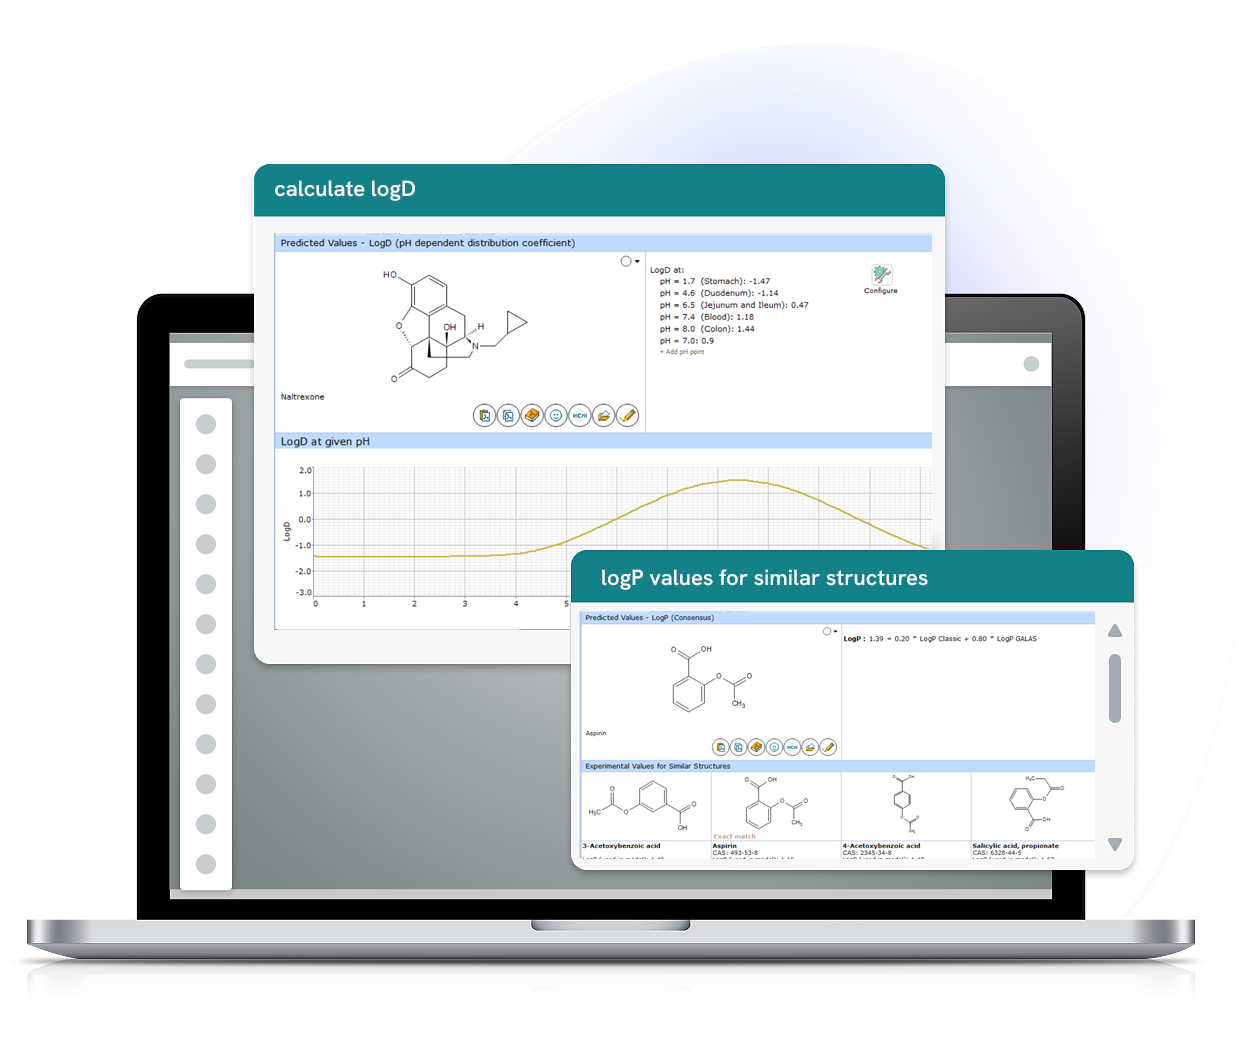
Calculate and visualize logD across a range of pH values, including physiologically relevant pH
Benefits

Everything You Need in a LogP Property Calculator

 

Accurate, Reliable Results

  • Leverage an extensive training database of more than 22,000 compounds
  • Evaluate prediction confidence using a reliability index, similar structures, and literature references
  • Compare results from three complementary logP prediction algorithms: Classic, GALAS, and Consensus

Gain Deeper Insight into Lipophilicity

  • Understand the behavior of your molecule with the automatically generated plot of logD versus pH
  • Create scatter plots, browse, filter, sort, rank, and prioritize compounds with ease
  • Identify hydrophilic and hydrophobic regions with colour mapping

Improve Predictions with Machine Learning

  • Train prediction models using your own experimental logP data to expand the applicability domain to proprietary chemical space
  • Build curated project-specific training sets for fine-tuned prediction accuracy

How it Works

LogP and LogD 
Predictions in Seconds


  1. Draw/import your structure
  2. Review results and make decisions
  3. Report to PDF or copy/paste

Features of LogP and LogD

    • Predict logP from structure (draw in-app, or copy/paste from third-party drawing packages); SMILES string; InChI code; imported MOL, SK2, SKC, or CDX files; or search by name in the built-in dictionary
    • Three prediction algorithms: Classic (default calculator), GALAS (Global,Adjusted Locally According to Similarity), and a Consensus logP based on the other two models.
    • Estimates of prediction accuracy in the different models.
      • Classic
        • Results delivered with 95% confidence intervals for final logP value and incremental contributions
        • All available experimental data and literature references provided for compounds in the internal training library
      • GALAS
        • Reliability Index
        • Display of 5 most similar structures in the training library with experimental values and literature references
      • Consensus
        • Display of 5 most similar structures in the training library with experimental values and literature references
    • The detailed calculation protocol lists all contributing functional groups, carbon atoms, and interactions through aliphatic, aromatic, and vinylic systems (Classic)
      • Click protocol entry to highlight the corresponding entity on the structure
    • Color highlighting of the molecule to highlight hydrophilic/hydrophobic substructures (GALAS)
    • Calculate logP properties for groups or libraries of compounds and use built-in tools to sort, filter, plot, and rank results.
      • Set user-defined label colors
      • Filter results numerically
      • Sort results by ascending/descending values
      • See results for previously calculated values in the history
    • Report results to PDF
    • Download QPRF and QMRF documents for LogP (GALAS)
    • Train the model with experimental values to improve predictions for proprietary chemical space
      • Create and select different training libraries for calculations, or switch to the built-in algorithm
    • Predict logD from structure (draw in-app, or copy/paste from third-party drawing packages); SMILES string; InChI code; imported MOL, SK2, SKC, or CDX files; or search by name in the built-in dictionary
    • Select from a variety of logP and pKa algorithms (default: logP Consensus, pKa Classic)
    • View logD values at different pH
      • Physiologically relevant values (1.7, 4.6, 6.5, 7.4, 8.0)
      • Click and drag across the plot (logD vs pH) for logD at a pH value of interest
      • Add/remove predictions at a specific pH value
    • Calculate logD properties for groups or libraries of compounds and use built-in tools to sort, filter, plot, and rank results.
      • Set user-defined label colors
      • Filter results numerically
      • Sort results by ascending/descending values
    • See results for previously calculated values in the history
    • Report results to PDF
    • Train the model with experimental values of logP and pKa to improve predictions for proprietary chemical space
      • Create and select different training libraries for calculations, or switch to the built-in algorithm

    LogP and LogD FAQs

    Ready to take the next step?

    Beyond logP and logD Predictions

    Explore the wider Percepta Platform for additional molecular property predictions.

    Read More

    Talk to our team

    Schedule a consultation with our experts to discuss your workflow, requirements, and implementation needs

    Contact Us

    Stay up to date

    Stay up-to-date on all the latest insights, research and product news from Revvity Signals.

    Stay up to date