Percepta® Suite

Physicochemical, ADME and Toxicity Predictions

Accelerate drug discovery and lead optimization with structure-based predictions that provide insights into molecular behavior, pharmacokinetics, and safety.
Percepta Suite

Explore

Property Predictions to Support Drug Design and Discovery

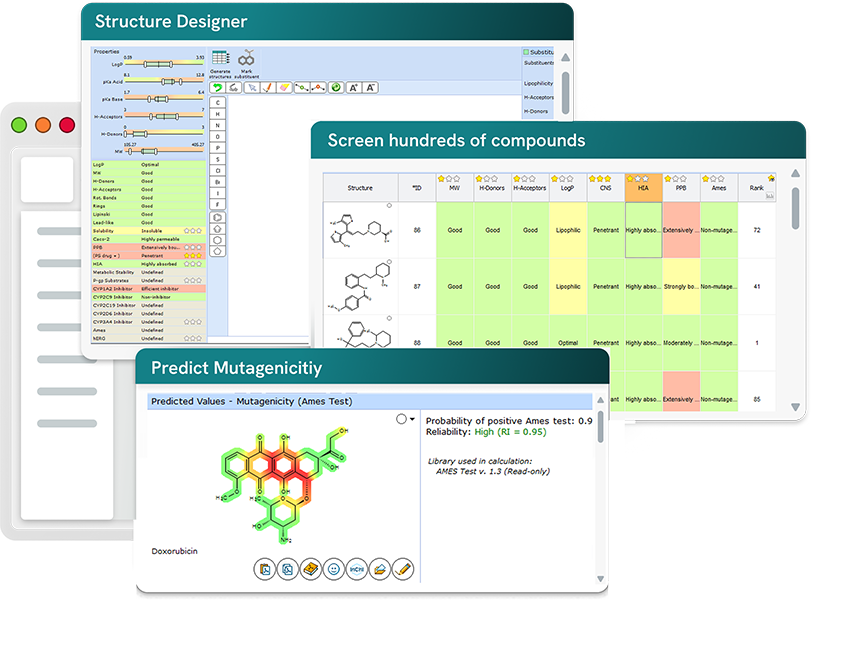
Percepta Suite enables data-driven decision-making across physicochemical, pharmacokinetic, and toxicity domains to accelerate drug discovery. Its collection of modules provides high-quality, structure-based predictive insights for molecular property analysis. 


Use Percepta Suite to:

Predict physicochemical, ADME, and toxicity properties from chemical structure.

Evaluate and visualize predicted results using sorting and plotting tools.

Assess the reliability of predicted property values to support confident decision-making.

Train prediction models with proprietary experimental data to improve predictions for novel chemical space.
Predict with Confidence Across Key Property Domains

Explore Structure-Property Relationships

  • Predict physicochemical properties from chemical structure to support compound design and optimization.
  • Evaluate and interpret structure–property relationships influencing solubility, lipophilicity, ionization, and developability.
  • Investigate molecular property profiles to guide lead optimization and compound selection.

Evaluate Pharmacokinetic Behavior

  • Predict pharmacokinetic properties from chemical structure to evaluate absorption, distribution, metabolism, and excretion behavior.
  • Assess exposure, bioavailability, metabolic stability, and more to support candidate selection and optimization.
  • Leverage PK predictions to identify compounds with favorable in vivo performance earlier in discovery.

Assess Toxicity Risks Earlier
 

  • Predict toxicity endpoints and safety liabilities from chemical structure to support early risk assessment.
  • Evaluate potential adverse effects to prioritize safer compounds and reduce late-stage attrition.
  • Leverage predictive safety data to guide compound selection and optimization decisions.

Predictive Modules in Percepta Suite

PhysChem

Physicochemical properties:

  • Aqueous Solubility*
  • Boiling Point/Vapor Pressure
  • LogD
  • LogP*
  • pKa
  • Sigma


Molecular Descriptors:

  • Density
  • Freely Rotatable Bonds
  • H-Bond Donors and Acceptors
  • Index of Refraction
  • Molar Refractivity
  • Molar Volume
  • Molecular Weight
  • Parachor
  • Polar Surface Area
  • Polarizability
  • Rule-of-5
  • Surface Tension

ADME

  • Blood Brain Barrier Permeation
  • Cytochrome P450 Inhibitors*
  • Cytochrome P450 Substrates*
  • Distribution*
  • Maximum Recommended Daily Dose
  • Oral Bioavailability
  • Passive Absorption
  • P-gp Specificity*
  • PK Explorer
  • Regioselectivity of Metabolism


Toxicity

  • Acute Toxicity*
  • Aquatic Toxicity*
  • Endocrine System Disruption
  • Mutagenicity*
  • Health Effects
  • hERG Inhibition*
  • Irritation


*Trainable with your own experimental data

Benefits

Accelerate Decision-Making with Predictive Insight

Fast, Accurate, Reliable Results

Calculate properties for single compounds or large compound libraries using curated experimental data.

Evaluate prediction confidence using a reliability index, similar structures, and literature references.

Convenient Visualization

Visualize substructure and atomic contributions to predicted property values with color mapping (select models).

Quickly identify favorable and unfavorable compounds in libraries using user-defined color coding.

Improve Predictions with Machine Learning

Train prediction models using your own experimental data to extend prediction accuracy to proprietary chemical space and build project-specific training sets for fine-tuned prediction accuracy.

Easy to Use

Draw or import a chemical structure to generate molecular property predictions and train models with your own experimental data through an intuitive interface designed for chemists, not programmers.

Gain Deeper Insights

Identify trends, prioritize compounds, and evaluate complete molecular property profiles using interactive scatter plots, filtering, sorting, and ranking tools to support confident decision-making.

Augment Structured Data for AI/ML

Annotate large structured datasets with physicochemical, ADME and toxicity property predictions to provide additional context before feeding them into machine learning (ML) and artificial intelligence (AI) models.

Insights for Modern Drug Discovery
Blog

Navigating Drug Design in ‘Beyond the Rule of 5’ Landscape

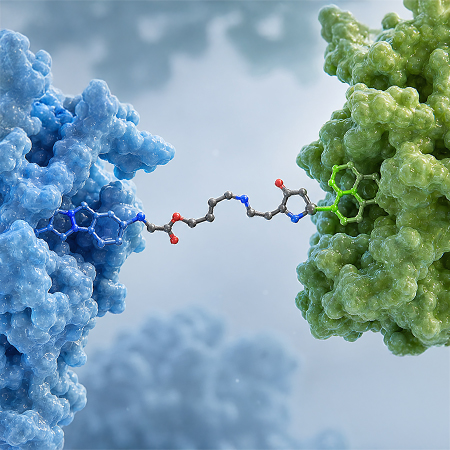
As drug discovery expands beyond traditional boundaries, complex small molecules like PROTACs challenge old rules. Discover how our predictive platforms help scientists design bioavailable, scalable drugs in the evolving ‘bRo5’ space with precision and confidence.

Blog

The Importance of Ionization in Pharmaceutical R&D

Discover why ionization is critical throughout pharmaceutical R&D, from lead optimization and formulation to ADME prediction and chromatography.

How it Works

Predict in Seconds with
Percepta Suite

  1. Draw/import your structure
  2. Select the property of interest
  3. Review results and make decisions
  4. Report to PDF or copy/paste

Features of Percepta Suite

      • Calculate physicochemical properties for organic molecules ranging from traditional drug-like structures to higher molecular weight compounds up to a recommended MW limit of ≤2000 Daltons (e.g. peptides, proteins, polymeric units, and other bRo5 compounds).
      • Start with a structure (draw in-app, or copy/paste from third-party drawing packages); SMILES string; InChI code; imported MOL, SK2, SKC, or CDX files; or search by name in the built-in dictionary.
      • Several algorithms available for many predictions—see individual module for more details.
      • Automatic detection of tautomeric forms (for applicable prediction modules).
        • Select the canonical or major form
      • Evaluate results.
        • Structure highlighting for sub-structure/atomic contributions
        • Calculation protocols
      • Calculate physicochemical properties for groups or libraries of compounds and use built-in tools to sort, filter, plot, and rank results.
        • Set user-defined label colors
        • Filter results numerically
        • Sort results by ascending/descending values
      • See results for previously calculated values via your activity history.
      • Estimates of prediction accuracy to assess reliability of predicted values (information provided differs by module and calculation algorithm).
        • 95% confidence intervals
        • Interactive calculation protocols
        • Reliability Index and display of 5 most similar structures in the training library with experimental values and literature references
      • Report results to PDF or copy to your application of choice
      • Download QPRF and QMRF documents for LogP module (GALAS model) and LogS0 module
      • Train algorithms with experimental data in select modules—logP, pKa, logD
      • Add custom models/algorithms and in-house prediction algorithms by connecting to an existing web service using an XML protocol, or in the form of a DLL (not available in batch deployment)
      • Gain insights into structure-property relationships.
      • Understand and modify the pharmacokinetic profile of lead compounds.
        • Good/bad indicators for Lipinksi’s rule-of-5 and lead-likeness.
      • Identify structural fragments responsible for toxicity.
      • Modify sets of structures with the interactive optimization tool.
        • Generate libraries of analogs with substituent modifications based on an optimal property profile.
        • Sort, filter, and prioritize hundreds of structural analogs according to your desired property profile.
        • Create and use custom fragment libraries.
        • Target synthetically accessible fragments with the built-in retrosynthesis tool.
      • Calculate quantitative solubility in pure (unbuffered) water at 25°C.
      • Predict qualitative solubility at pH 7.4—compounds categorized from highly soluble to insoluble.
        • GALAS (Global, Adjusted Locally According to Similarity) algorithm.
        • Display of 5 most similar structures from the training set with experimental values.
      • Estimate intrinsic solubility—logS0.
        • Predictions based on a training set of >6800 compounds and a GALAS algorithm.
        • Reliability value and up to 5 most similar structures from the training set provided with experimental data.
      • Predict pH-dependent aqueous solubility—logS.
        • Solubility at physiological pH values of interest (pH 1.7, 4.6, 6.5, 7.4, 8.0).
        • Plot of predicted pH versus solubility.
      • Train the model with experimental values.
      • Estimate the boiling point of organic compounds as a function of pressure.
      • Predict the vapor pressure as a function of temperature.
      • Estimate the enthalpy of vaporization at the boiling point.
      • Estimate flash point at the temperature unit of your choice.
      • View results in a table or graphical plot.
      • Predict logP—choose from three prediction algorithms:
        • Classic
        • GALAS (Global, Adjusted Locally According to Similarity).
        • Consensus logP based on the other two models.
      • Detailed calculation protocol lists all contributing functional groups, carbon atoms, and interactions through aliphatic, aromatic, and vinylic systems (Classic).
        • Click protocol entry to highlight the corresponding entity on the structure.
      • Color highlighting of the molecule to highlight hydrophilic/lipophilic substructures (GALAS).
      • Train the model with experimental values to improve predictions for proprietary chemical space.
        • Create and select different training libraries for calculations, or switch to the built-in algorithm.

      Learn more about our LogP calculator

      LogD predictions are based on the logP and pKa models of PhysChem Suite

      • Select from a variety of logP and pKa algorithms (default: logP Consensus, pKa Classic).
      • View logD calculation results by pH.
        • Physiologically relevant values (1.7, 4.6, 6.5, 7.4, 8.0).
        • Click and drag across the plot (logD vs pH) for logD at a pH value of interest.
        • Add/remove predictions at a specific pH value.
      • Train the model with experimental values of logP and pKa to improve predictions for proprietary chemical space.
        • Create and select different training libraries for calculations, or switch to the built-in algorithm.

      Learn more about our LogD module

      • Calculate the acid dissociation constant (pKa) under standard conditions (25°C, zero ionic strength) in aqueous solution for every ionizable group.
      • Choose from two different algorithms: pKa Classic (default calculator) and GALAS
        Information about each ionization process (dissociation reaction) for all stages of ionization.
      • Color-coding of ionizable groups: red = acidic, blue = basic, purple = amphoteric ionization centers; color intensity indicates acid/base strength.
      • Calculation of the strongest acid and base dissociation constants.
      • Reliability range (in ±log units) for calculated pKa values.
      • Detailed calculation protocol for each predicted ionization (referred to as dissociation stage).
        • Hover on a dissociation stage to see the related ionizable center highlighted on the structure.
        • Click structure fragment to see it highlighted on the structure.
      • Train the algorithm with experimental data.

      Learn more about our pKa calculator

      • Display of the percentage contribution of individual ionization microstages to the final pKa.
      • View calculated pKa values as a function of pH in interactive plots (pH 0-14) and tables (select pH values including the physiologically relevant values 1.7, 4.6, 6.5, 7.4).
        • Net charge vs. pH.
        • Click and drag slider on the plot to see the ionic forms present at the pH of interest.
        • See the fraction of all ionic forms present at a pH of interest.
        • Protonation state vs. pH.
        • Click on the protonation state label to display/hide its curve on the plot.
        • Ionogenic group state vs. pH.
      • Calculate substituent-specific parameters for selected fragments of the molecule in aqueous solution, at zero ionic strength and 25°C.
        • Electronic substituent constant (Hammett)
        • Steric constants (molar volume, molar refractivity)
        • Hydrophobic constant (Hansch Pi)
      • High accuracy—typical calculation accuracy of ±0.05.
      • Internal database contains >850 substituents and >3000 carefully derived experimental electronic constants.
      • Density
      • Freely Rotatable Bonds
      • H-Bond Donors and Acceptors
      • Index of Refraction
      • Molar Refractivity
      • Molar Volume
      • Molecular Weight
      • Parachor
      • Polar Surface Area
      • Polarizability
      • Rule-of-5
      • Surface Tension
        • Calculate ADME properties for organic molecules from structure (draw in-app, or copy/paste from third-party drawing packages); SMILES string; InChI code; imported MOL, SK2, SKC, or CDX files; or search by name in the built-in dictionary
        • Automatic detection of tautomeric forms (for applicable prediction modules)
          • Select the canonical or major form
        • Structure highlighting to indicate sub-structure/atomic contributions (select modules)
        • Calculate properties for groups or libraries of compounds and use built-in tools to sort, filter, plot, and rank results
          • Set user-defined label colors
          • Filter results numerically
          • Sort results by ascending/descending values
        • Retrieve results of previously calculated values in your activity history
        • Report results to PDF or copy/paste to your application of choice
        • Train algorithms with experimental data in select modules—CYP450 Inhibition, Distribution, LogP, LogD, pKa, and P-gp Specificity
        • Add custom models/algorithms and in-house prediction algorithms by connecting to an existing web service using an XML protocol, or in the form of a DLL (available in thin client deployments only)
        • Gain insights into structure-property relationships
        • Understand and modify the pharmacokinetic profile of lead compounds
          • Good/bad indicators for Lipinski’s rule-of-5, lead-likeness, cell permeability, plasma protein binding, CNS penetration, metabolic stability, and CYP inhibition
        • Modify sets of structures with the interactive optimization tool
          • Generate libraries of analogs with substituent modifications based on an optimal property profile
          • Sort, filter, and prioritize hundreds of structural analogs according to your desired property profile
          • Create and use custom fragment libraries
          • Target synthetically accessible fragments with the built-in retrosynthesis tool
        • Quantitatively predict blood-brain barrier (BBB) permeability.
          • Rate of brain penetration (logPS)
          • Extent of brain penetration (logBB)
          • Brain/plasma equilibration rate (log(PS * fu, brain))
        • Alter values for underlying physicochemical properties—logP, pKa, unbound fraction in plasma—to investigate the effect on BBB permeability
        • Visualize results
          • “Traffic light” indicators of permeability
          • Plot of the BBB penetration of compound under investigation with well-known CNS-active and peripherally-active drugs
        • Alerts for compounds that undergo facilitated diffusion or active efflux across the BBB
          Submodules for LogPS and LogBB provide detailed prediction results
          • Up to 3 most similar structures in the internal library provided, with experimental values and literature references
        • Calculate the probability of a compound exhibiting “general” (IC50 < 50 μM) or “effective” (IC50 < 10 μM) inhibition of 5 major human cytochrome P450 isoforms: 3A4, 2D6, 2C9, 2C19, 1A2
          • Results displayed as a bar plot with confidence intervals
        • Estimates of prediction accuracy for each result
          • Reliability index and display of 5 most similar structures in the internal library with experimental values and literature references
        • Train the algorithm with experimental data
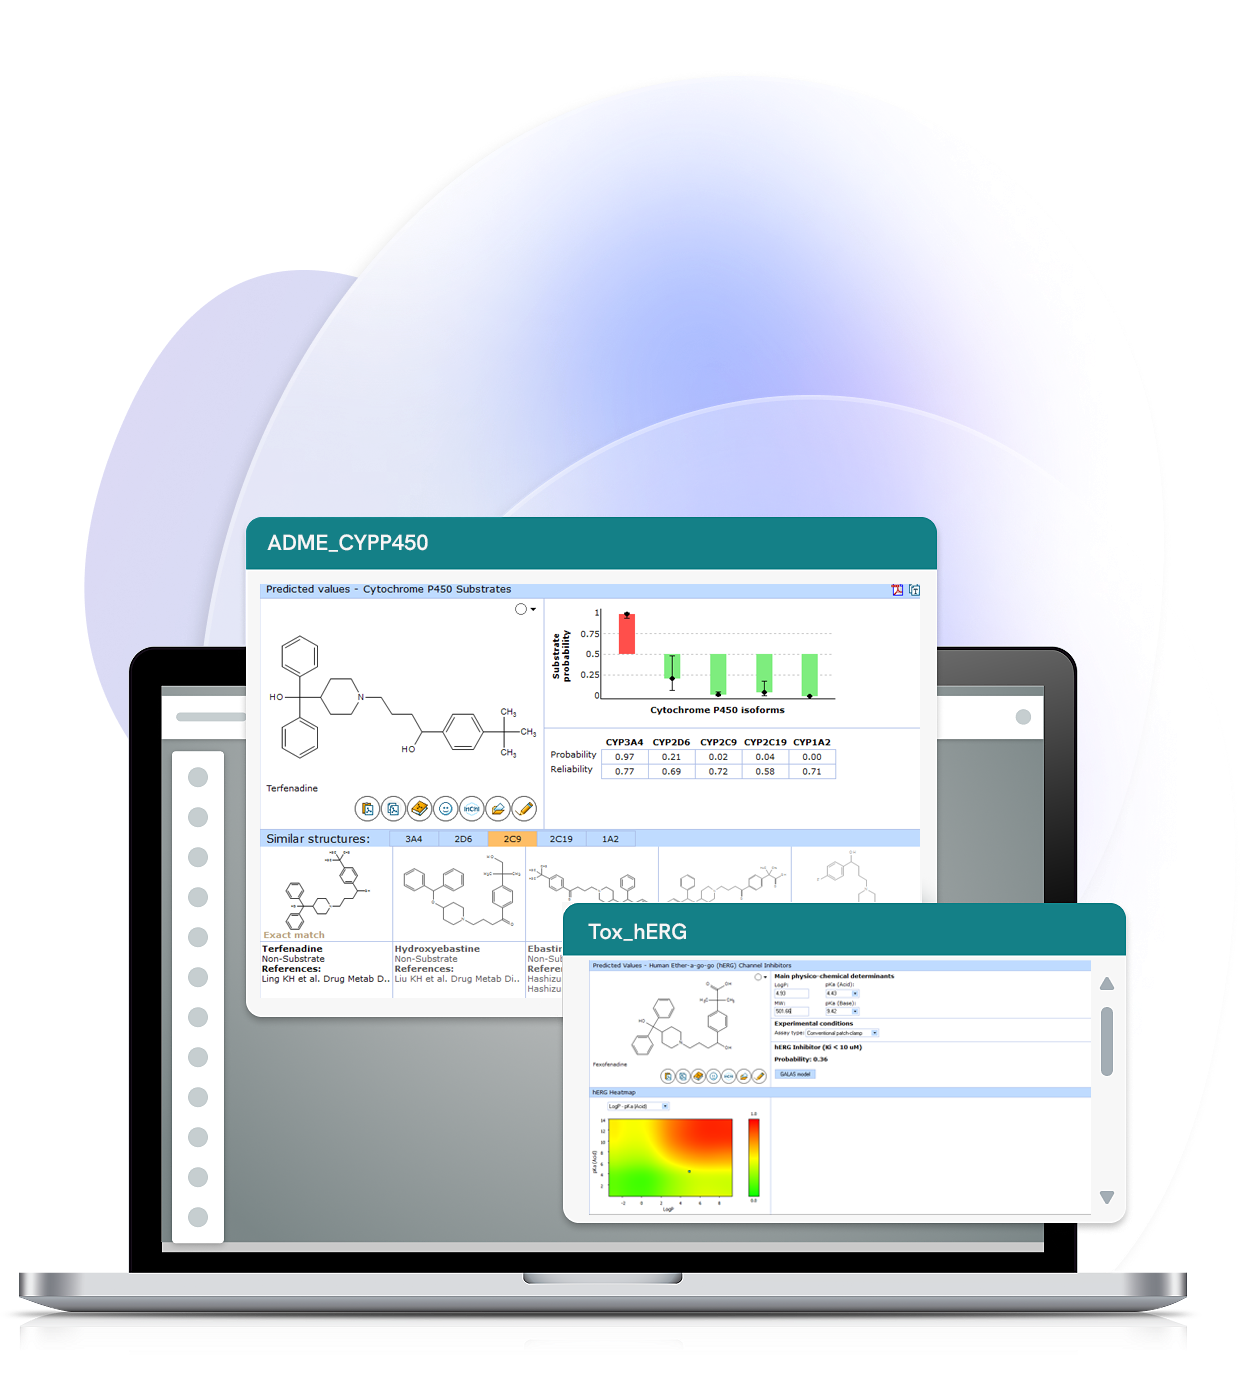
        • Calculate the probability that a compound will be metabolized by the cytochrome P450 (isoforms 3A4, 2D6, 2C9, 2C19, 1A2)
          • Results displayed as a bar plot with confidence intervals
        • Estimates of prediction accuracy for each result
          • Reliability index and display of 5 most similar structures in the internal library with experimental values and literature references
        • Train the algorithm with experimental data

        Plasma Protein Binding

        • Predict plasma-protein binding (PPB)
          • Percentage bound to human plasma proteins (% PPB)
          • Affinity constant to serum albumin (logKaHSA)
        • List of plasma proteins contributing to binding
        • Estimate of prediction accuracy
          • Reliability index and display of 5 most similar structures in the internal library with experimental values and literature references
        • Train with experimental data

        Volume of Distribution

        • Calculate the extent of tissue binding and Volume of Distribution (Vd) based on a physiological Øie-Tozer model
        • Alter values for key underlying properties—logP, and unbound fraction in plasma—to investigate the effect on distribution into the tissues
        • Estimate of prediction accuracy
          • Display of 5 most similar structures in the internal library with experimental values and literature references
        • Calculate the maximum recommended daily dose in humans (mg/kg/day)—for oral administration
        • Estimate of prediction accuracy
          • Reliability index and display of 5 most similar drugs in the internal library with experimental values and literature references
        • Indication of adverse effects on organs
        • Indication of toxicity in mouse (for oral and intravenous administration)
        • Alert for unreliable predictions

        Active Transport

        • Predict whether or not a compound is a likely substrate for oligopeptide transporter (PepT1), or bile acid transporter (ASBT)
        • Predict carrier-mediated transport by other systems: monocarboxylic acid transporter MCT1, amino acid carriers, etc.
        • Reference data for similar structures

        Bioavailability

        • Predict the percentage of drug that will reach systemic circulation after oral administration (%F)
        • Explore dose-dependence
        • See the contribution of endpoints that affect oral bioavailability: solubility, stability (pH <2), passive absorption, first-pass metabolism, P-gp efflux, active transport
          • Results displayed with color-coding to indicate good or poor bioavailability
        • Estimate of prediction accuracy
          • Display of up to 5 similar structures in the internal library with experimental values and literature references

        Absorption

        • Predict passive permeability across jejunal epithelium based on logP and pKa
          • Enter experimentally measured values to improve prediction
          • Alter logP and pKa values to model the limiting effect of lipophilicity and ionization on intestinal permeation rate
        • Calculate the extent of oral absorption (%HIA)
        • Estimate relative contributions of transcellular and paracellular routes to overall %HIA
        • Provides access to Absorption DB—a fully browsable and searchable database containing experimental data that was used for the development of the HIA model together with corresponding literature references
        • Experimental values of the relevant properties for up to 3 similar structures from the internal set

        Caco-2

        • Calculate passive permeability across Caco-2 cell monolayers at specified pH and stirring conditions based on logP and pKa values, or logD at specific pH
          • Adjust pH and stir rate
          • Alter logD, or logP and pKa values to model the limiting effect of lipophilicity and ionization on Caco-2 permeation rate
        • Information about the relative contributions of transcellular and paracellular routes to overall Caco-2 permeability
        • Estimate of prediction accuracy
          • Display of up to 3 similar structures in the internal library with experimental information and literature references

        P-gp Inhibitors

        • Estimate the probability that a compound inhibits P-glycoprotein and that it is a potent inhibitor
        • Classify a compound as an inhibitor or non-inhibitor of P-glycoprotein based on structural features and physicochemical properties
        • Estimate of prediction accuracy
          • Reliability of prediction and display of 5 most similar structures in the internal library with experimental values and literature references
        • Train with experimental data

        P-gp Substrates

        • Estimate the probability that a compound is a P-glycoprotein substrate and that it is a high-affinity substrate
        • Classify a compound as a substrate or non-substrate of P-glycoprotein based on ionization, molecular size and compound class (peptide, alkaloid, anthracycline, etc.)
        • Estimate of prediction accuracy
          • Reliability of prediction and display of 5 most similar structures in the internal library with experimental values and literature references
        • Train with experimental data

        Explore the dependency of various pharmacokinetic parameters on physicochemical properties

        • Visualize the dependence of the following parameters on dose, logP, and pKa (results provided as graphical plots. Use predicted values or enter experimentally derived values for logP and pKa):
          • %F–LogP (the dependence of oral bioavailability on logP at a defined dose)
            Cp(Max)–LogP (the dependence of maximum achievable drug concentration on logP at a defined dose)
          • %F–Dose (bioavailability–dose relationship)
          • Cp(Max)–Dose (maximum achievable drug plasma levels at different doses)
          • Cp–Time (simulation of plasma concentration-time curves for oral and intravenous administration)
        • Estimate absorption (ka), total body clearance (ke), solubility in the gastrointestinal tract (SolGI), volume of distribution (Vd), and presystemic metabolism in the gut and liver (first-pass clearance) based on entered physicochemical property values
          • Alter any of these values to recalculate
          • Choose to ignore first-pass clearance
        • Calculate maximum achievable plasma level (Cp(Max)) and the corresponding time (Tmax), area under the concentration-time curve (AUC) after oral and intravenous administration, and oral bioavailability (%F)
        • Predict metabolic soft spots for metabolism by human liver microsomes (HLM) and the five major cytochrome P450 enzymes (1A2, 2C19, 2C9, 2D6, 3A4) to help:
          • Identify metabolic sites on new chemical entities
          • Guide synthesis of compounds with improved metabolic properties
          • Identify and elucidate likely metabolite structures
        • Color mapping on structure indicates the probability of metabolism at each atom
        • Probability score (0–1) for each atom as a likely site of metabolism
        • View the expected metabolic reaction type at every atom: aliphatic or aromatic hydroxylation, N-dealkylation, O-dealkylation, or S-oxidation
        • Estimate of prediction accuracy
          • Reliability of prediction and display of 5 most similar structures in the internal library. Indication of similarity of the metabolic site and experimental result (Metabolized, or Not Metabolized)
          • Calculate toxicity endpoints for organic molecules from structure (draw in-app, or copy/paste from third-party drawing packages); SMILES string; InChI code; imported MOL, SK2, SKC, or CDX files; or search by name in the built-in dictionary
          • Structure highlighting to indicate sub-structure/atomic contributions (present in some modules)
            Calculate toxicity endpoints for groups or libraries of compounds and use built-in tools to sort, filter, plot, and rank results
            • Set user-defined label colors
            • Filter results numerically
            • Sort results by ascending/descending values
          • Retrieve results of previously calculated values in your activity history
          • Report results to PDF or copy/paste to your application of choice
          • Download QMRF and QMRF documents for the Mutagenicity (Ames Test) module
          • Train algorithms with experimental data in select modules—acute toxicity, aquatic toxicity, mutagenicity, hERG inhibition, logP, logD, and pKa
          • Add custom models/algorithms and in-house prediction algorithms by connecting to an existing web service using an XML protocol, or with a DLL (available in thin client deployments only)
          • Gain insights into structure-property relationships
          • Understand and modify the pharmacokinetic profile of lead compounds
            • Good/bad indicators for Lipinksi’s rule-of-5, lead-likeness, and toxicity endpoints
          • Identify structural fragments responsible for hazardous activity—hERG inhibition and mutagenicity
          • Modify sets of structures with the interactive optimization tool
            • Generate libraries of analogs with substituent modifications based on an optimal property profile
            • Sort, filter, and prioritize hundreds of structural analogs according to your desired property profile
            • Create and use custom fragment libraries
            • Target synthetically accessible fragments with the built-in retrosynthesis tool

          LD50

          • Calculate LD50 (mg/kg) for mice under oral, intraperitoneal, intravenous, and subcutaneous administration; and for rats under oral and intraperitoneal administration
          • Estimate of prediction accuracy
            • Reliability of prediction and display of 5 most similar structures in the internal library with experimental LD50 values
          • Train the model with experimental data

          Acute Toxicity Categories

          • Predict the probabilities that LD50 will demonstrate various levels of acute toxicity following oral administration (based on rodent data)
          • Categorize compounds for “Oral Acute Toxicity Hazard” as defined by the OECD (Organization for Economic Cooperation and Development)
            • Hover over the label for details
          • Estimate of prediction accuracy
            • Display of 5 most similar structures in the internal library with experimental values

          Hazards

          • Identify fragments that may be responsible for high acute toxicity
            • Color-map on the structure
            • Tabbed results provide detailed information for each fragment
          • Learn how different routes of administration impact toxicity—intravenous, oral, and intraperitoneal
          • Distribution density plot illustrating :
            • The frequency of compounds with different LD50 ranges in the training set
            • Compounds that contain the highlighted fragment
            • T-Test results demonstrating whether the presence of a highlighted fragment leads to a statistically significant increase in toxicity
          • Box and whisker plot of compounds that contain the hazardous fragment compared with the full training set
            • Display of the 5 most similar structures in the internal library with the selected hazardous fragment with experimental values
          • Predict LC50 values (mg/L) for Fathead minnow (Pimephales promelas) and Water flea (Daphnia magna)
          • Predict IGC50 values (mg/L) for Ciliate protozoa (Tetrahymena pyriformis)
          • Estimate of prediction accuracy
            • Reliability of prediction and display of 5 most similar structures in the internal library with experimental values
          • Train the model with experimental data
          • Predict the probabilities of estrogen receptor binding affinity exceeding two different thresholds
            • Classify the compounds by their relative binding affinity for the estrogen receptor compared to estradiol-based on LogRBA
          • Estimate of prediction accuracy
            • Reliability of prediction and display of 5 most similar structures in the internal library with experimental LogRBA values and literature references
          • Predict the probability of a positive Ames test
            • Color-map of atoms/functional groups in the structure that contribute to mutagenicity potential
          • Estimate of prediction accuracy
            • Reliability of prediction and display of 5 most similar structures in the internal library with overall experimental Ames test result
          • Browse the mutagenicity database for:
            • Information about studies conducted with each compound
            • Tested bacterial strains
            • The presence or absence of metabolic activation, and other experimental conditions
          • Train the model with experimental data
          • Estimate the probability of adverse effects (at the therapeutic dose) for blood, cardiovascular system, gastrointestinal system, kidney, liver, and lungs
          • Color-map of structural fragments that contribute to adverse effects
          • Estimate of prediction accuracy
            • Display of 5 most similar structures in the internal library with route, species, and a listing of clinically observed toxic effects.
          • Predict the probability of human ether-a-go-go related gene (hERG) channel inhibition at clinically relevant concentrations (Ki < 10 μM)) using two different models—one based on structural descriptors, and one based on physicochemical properties
            • Simulate how different experimental assays (e.g., conventional or automated patch-clamp, ligand replacement, etc.) impact the measured value of hERG inhibition potential
            • Explore the influence of physicochemical and molecular properties on hERG inhibition potential
          • Explore how physicochemical properties (acid/base pKa, logP) and molecular weight impact hERG inhibition
            • Color “heat map” displays interdependence of hERG inhibition, pKa, and logP
          • Estimate of prediction accuracy
            • Reliability of prediction and display of 5 most similar structures in the internal library with experimental results (inhibitor, non-inhibitor) and literature references
          • Train the model with experimental data

          Eye Irritation

          • Calculate the probability of eye irritation in a standard Draize (rabbit) at 100mg and 500mg
            • Statement of applicable rules and description of functional groups that contribute to eye irritation
            • Highlighted contributing structural fragments
          • Estimate of prediction accuracy
            • Display of up to 5 most similar structures in the internal library with experimental values and literature references

          Skin Irritation

          • Calculate the probability of skin irritation in a standard Draize (rabbit) at 100mg and 500mg
            • Statement of applicable rules and description of functional groups that contribute to skin irritation
            • Highlighted contributing structural fragments
          • Estimate of prediction accuracy
            • Display of up to 5 most similar structures in the internal library with experimental values and literature references

          Product Comparison

          Percepta Suite
          Other vendors
          Percepta Suite Trusted PhysChem predictions built on decades of scientific research.
          Other vendors Prediction quality and scientific depth vary by platform.
          Percepta Suite Comprehensive ADME and toxicity assessments in one platform.
          Other vendors ADMET coverage varies, with some solutions emphasizing specific discovery stages or scientific domains.
          Percepta Suite Easily and quickly retrain supported models using your own experimental data.
          Other vendors Model customization may require specialist expertise or external support.
          Percepta Suite Interactive tools reveal structure-property relationships and molecular drivers behind predicted properties.
          Other vendors Insight tools vary by platform and may focus on specific workflows or endpoints.
          Percepta Suite Confidence metrics, applicability domains, rich prediction metadata, and model documentation built in.
          Other vendors Limited visibility into prediction reliability or model methodology.
          Percepta Suite Built-in QMRF and QPRF reporting for regulatory support for select models.
          Other vendors Regulatory documentation may require additional effort or external tools.

          What Our Customers Say About Percepta Suite

          "Merck Germany has deployed Percepta Enterprise software at their Research facilities in Germany and North America. It provides in silico tools for the prediction of Physicochemical, ADME and Tox properties, helping support the medicinal chemists in their planning of syntheses and optimization of new chemical entities. Their main reasons for choosing ACD/Labs Percepta Enterprise were its ease of use and, in particular, its configurability and ability to use existing in-house built algorithms."

          Merck Germany

          Quote from Bill Simmons

          "[ACD/Labs'] physicochemical and ADMET prediction software provides...a surprising wealth of information on compound drug-likeness in a simple to use, intuitive format with excellent output graphics."

          Bill Simmons Loyola University

          Quote from Tim Tam

          "The best in silico toxicity software I have used. It was very easy to use, and a lot of information could be obtained."

          Tim Tam Apotex Pharma

          Quote from Regis Leung-Toung

          "PhysChem, ADME, Tox in one sleek interface that's very user-friendly."

          Regis Leung-Toung Apotex

          Percepta Suite FAQs

          Ready to take the next step?

          Take a Tour

          See how Percepta Suite can help you with predicting key physicochemical properties and achieving your lead optimization goals.

          Request a Demo

          Talk to Our Team

          Schedule a consultation with our scientific solutions experts to discuss your specific research workflows, requirements, and implementation needs.

          Contact Us

          Stay up to date

          Stay up-to-date on all the latest insights, research and product news from Revvity Signals.

          Stay up to date