
LogP and LogD
Partition and Distribution Coefficient Calculators
Predict logP and logD values directly from chemical structure.

Trusted By Companies Worldwide
















Explore
Understand Molecular Lipophilicity
LogP predicts partition coefficients, while logD predicts distribution coefficients, helping you evaluate molecular lipophilicity across different ionization states and pH conditions.

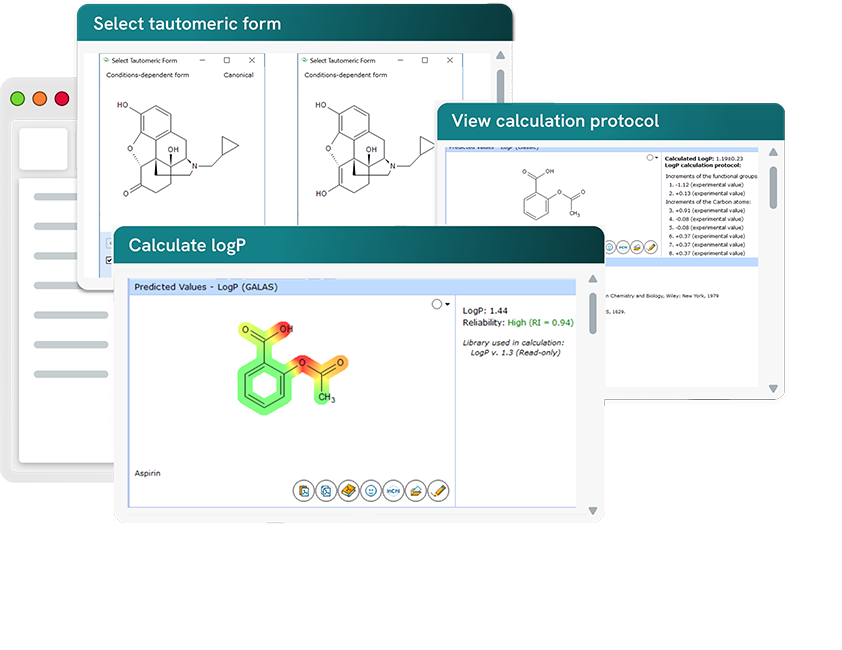
Calculate the partition coefficient (logP) for neutral molecules.

Identify hydrophilic and hydrophobic fragments of a structure.

Train prediction models using experimental measurements.

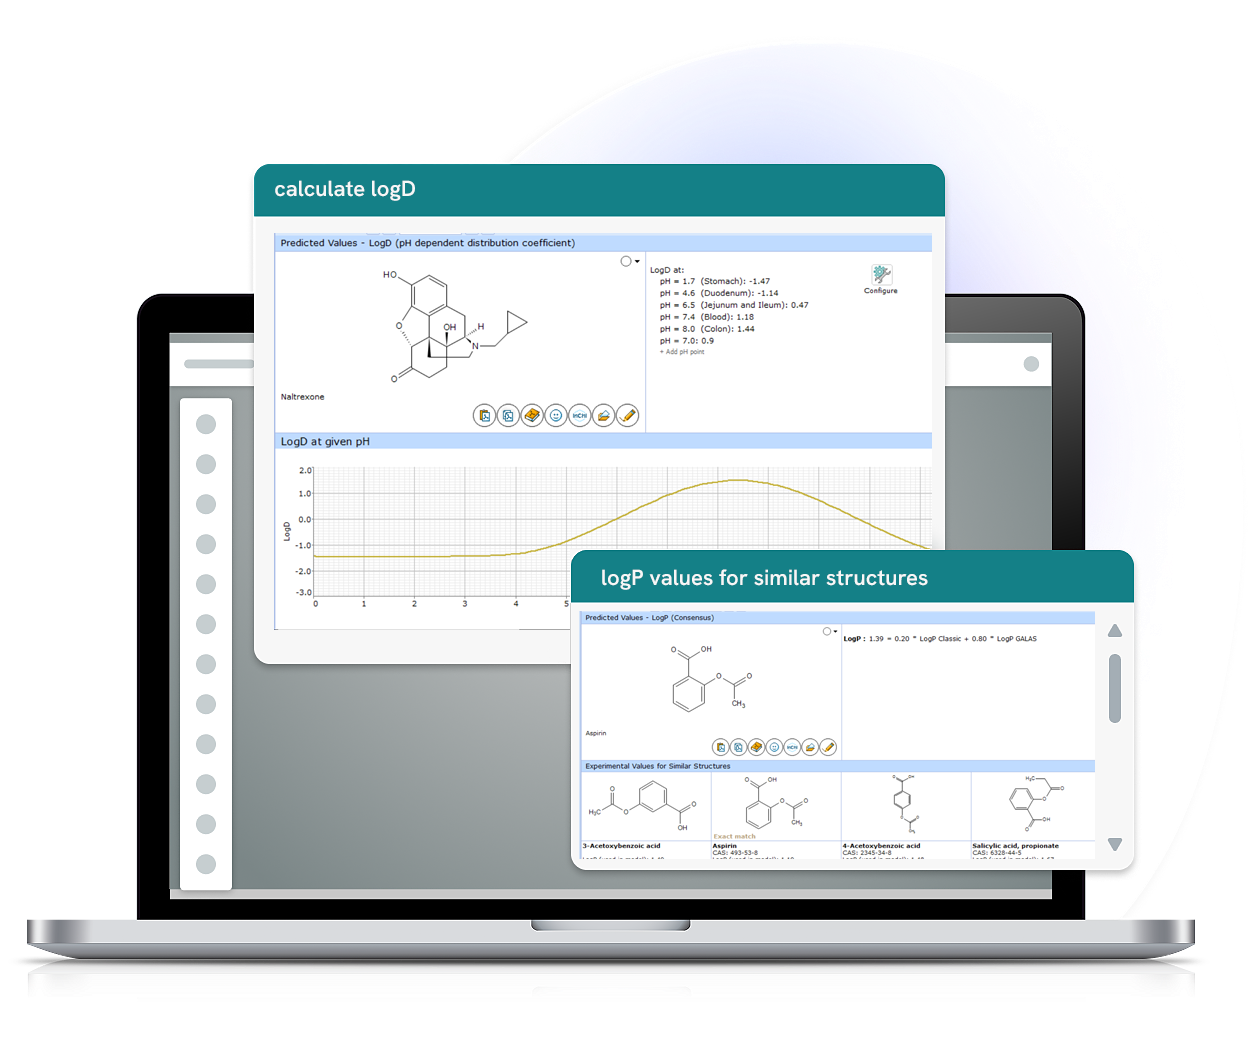
Calculate and visualize logD across a range of pH values, including physiologically relevant pH.
Benefits
Everything You Need in a LogP Property Calculator


Accurate, Reliable Results
- Leverage an extensive training database of more than 22,000 compounds.
- Evaluate prediction confidence using a reliability index, similar structures, and literature references.
- Compare results from three complementary logP prediction algorithms: Classic, GALAS, and Consensus.


Gain Deeper Insight into Lipophilicity
- Understand the behavior of your molecule with the automatically generated plot of logD versus pH.
- Create scatter plots, browse, filter, sort, rank, and prioritize compounds with ease.
- Identify hydrophilic and hydrophobic regions with color mapping.

Improve Predictions with Machine Learning
- Train prediction models using your own experimental logP data to expand the applicability domain to proprietary chemical space.
- Build curated project-specific training sets for fine-tuned prediction accuracy.

LogP and LogD FAQs
LogP is the logarithm of the partition coefficient (P), a measure of the lipophilicity of a neutral compound based on its distribution between octanol and water. Higher logP values generally indicate greater lipophilicity and membrane permeability, while lower values indicate greater hydrophilicity.
LogD is the logarithm of the distribution coefficient (D), a pH-dependent measure of lipophilicity describing how a compound partitions between an organic phase (typically octanol) and water. Unlike logP, it accounts for all species present at a given pH, including ionized, partially ionized, and unionized forms.
In PhysChem Suite, logD is calculated from predicted logP and pKa values to model the distribution of all species across the two phases at a defined pH, providing a more physiologically relevant measure of lipophilicity.
LogP describes lipophilicity of neutral compounds only, based on partitioning between octanol and water. LogD is a pH-dependent distribution coefficient that includes both ionized and neutral species.
LogP reflects intrinsic lipophilicity, while logD reflects behaviour under physiological pH conditions. For more detail, see our blog on when to use logP vs logD.
The logP prediction models are based on datasets containing more than 12,000 experimental logP values and over 22,000 compounds for the GALAS model. Multiple complementary algorithms and advanced similarity-based approaches are used to improve reliability across diverse chemical space.
LogP prediction modules are continuously refined to improve accuracy and expand chemical space coverage. Prediction accuracy depends on chemical class and applicability domain and can be further improved by training supported models with high-quality proprietary experimental data.
Classic Algorithm
- Based on more than 12,000 experimental logP values
- Uses the principle of isolating carbons
- Provides a mechanistic, fragment-based approach to logP prediction
GALAS Algorithm
- Based on a training set of more than 22,000 compounds
- Uses similarity-based adjustment from the most similar compounds in the dataset
- Provides locally refined predictions based on chemical neighborhood
Consensus Model
- Combines Classic and GALAS predictions
- Applies weighting based on regions of chemical space where each model performs most reliably
- Provides a balanced prediction leveraging complementary strengths of both approaches
Predicted logP values may differ from experimentally measured values when:
- The logP value is outside the reliably measurable range (approximately -3 to +8) obtained by traditional experiments.
- Tautomeric forms exist. In many cases, logP values cannot be experimentally measured for every tautomer.
- A compound contains acidic and basic groups (e.g., amino acids, peptides, nucleosides). Since these molecules may exist in multiple ionic forms at a given pH, the concentration of the unionized form may be negligible.
In these situations, structure-based predictions may help overcome experimental limitations and provide estimates where experimental measurements become more challenging.


Ready to take the next step?

Beyond logP and logD Predictions
Explore the wider Percepta Platform for additional molecular property predictions.

Talk to our team
Schedule a consultation with our experts to discuss your workflow, requirements, and implementation needs.

Stay up to date
Stay up-to-date on all the latest insights, research and product news from Revvity Signals.