PhysChem Suite™

Calculate Physicochemical Properties

Predict logP, logD, pKa, aqueous solubility, and other key physicochemical properties from chemical structure
PhysChem Suite

Explore

Understand the Properties That Drive Molecular Behavior

The physicochemical properties of a molecule can help you better understand its likely behavior, support QSPR high-throughput screening (HTS) of libraries, and enable data-driven lead optimization.

Predict physicochemical properties from structure including aqueous solubility, boiling point, logD, logP, pKa, Sigma, and other molecular descriptors for organic compounds

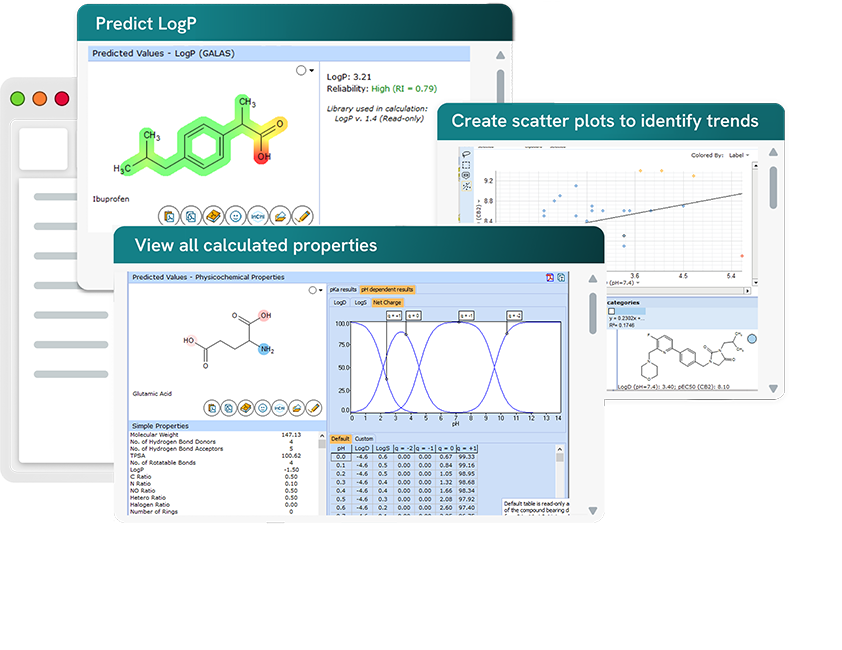
Evaluate results and assess prediction reliability using sorting and plotting tools, reliability metrics, and supporting data

Investigate structure-property relationships to support lead optimization, structure modifications, and target profile development

Train models with experimental data and incorporate in-house algorithms to better reflect novel chemical space
Benefits

Everything You Need in a Physicochemical Property Calculator

Easy to Use

  • Simply draw your structure for predictions. PhysChem Suite makes makes property prediction easy for medicinal, synthetic, and research chemists
  • Train models code-free. No programming or computational chemistry experience is required to improve prediction accuracy for novel chemical space.

Fast, Accurate, Reliable Results

  • Quickly calculate properties for single compounds or tens of thousands
  • Predictions are based on carefully curated databases of experimental data
  • Easily evaluate the reliability of results using a reliability index, similar structures, and literature references.

Improve Predictions with Machine Learning

  • Get the accuracy of an in-house model from a commercial platform by training with your own experimental pKa data
  • Expand the applicability domain into proprietary chemical space using project-specific data
  • Build curated training sets for each project to achieve fine-tuned prediction accuracy

Deeper Insights

  • Identify trends and prioritize compounds easily with tools to create scatter plots, browse, filter, sort, and rank libraries
  • Make decisions confidently with a complete property profile of each molecule in one place

Convenient Visualization

  • Visualize the substructure/atomic contributions to a property value with color-mapping on the structure
  • Quickly identify favorable and unfavorable compounds in a library with user-defined color-coding of results in the spreadsheet

Augment Structured Data for AI/ML

  • Annotate large structured datasets with physicochemical, ADME and toxicity property predictions to provide additional context before feeding them into machine learning (ML) and artificial intelligence (AI) models

Physicochemical Property Predictions You Can Trust

Blog

The Importance of Ionization in Pharmaceutical R&D

Discover why ionization is critical throughout pharmaceutical R&D, from lead optimization and formulation to ADME prediction and chromatography.

Blog

LogP vs LogD - What is the Difference?

LogP and logD are important values to consider during the drug design process as both give insight to the lipophilicity and hydrophilicity of compounds.

How it Works

Predict in Seconds with 
PhysChem Suite


  1. Draw/import your structure
  2. Select the property of interest
  3. Review results and make decisions
  4. Report to PDF or copy/paste

Features of PhysChem Suite

    • Calculate physicochemical properties for organic molecules ranging from traditional drug-like structures to higher molecular weight compounds up to a recommended MW limit of ≤2000 Daltons (e.g. peptides, proteins, polymeric units, and other bRo5 compounds).
    • Start with a structure (draw in-app, or copy/paste from third-party drawing packages); SMILES string; InChI code; imported MOL, SK2, SKC, or CDX files; or search by name in the built-in dictionary
    • Several algorithms available for many predictions—see individual module for more details
    • Automatic detection of tautomeric forms (for applicable prediction modules)
      • Select the canonical or major form
    • Evaluate results
      • Structure highlighting for sub-structure/atomic contributions
      • Calculation protocols
    • Calculate physicochemical properties for groups or libraries of compounds and use built-in tools to sort, filter, plot, and rank results
      • Set user-defined label colors
      • Filter results numerically
      • Sort results by ascending/descending values
    • See results for previously calculated values via your activity history
    • Estimates of prediction accuracy to assess reliability of predicted values (information provided differs by module and calculation algorithm)
    • 95% confidence intervals
      • Interactive calculation protocols
      • Reliability Index and display of 5 most similar structures in the training library with experimental values and literature references
    • Report results to PDF or copy to your application of choice
    • Download QPRF and QMRF documents for LogP (GALAS model) and LogS0
    • Train algorithms with experimental data in select modules—logP, pKa, logD
    • Add custom models/algorithms and in-house prediction algorithms by connecting to an existing web service using an XML protocol, or in the form of a DLL (not available in batch deployment)
    • Gain insights into structure-property relationships
    • Understand and modify the pharmacokinetic profile of lead compounds
      • Good/bad indicators for Lipinksi’s rule-of-5 and lead-likeness
    • Identify structural fragments responsible for toxicity
    • Modify sets of structures with the interactive optimization tool
      • Generate libraries of analogs with substituent modifications based on an optimal property profile
      • Sort, filter, and prioritize hundreds of structural analogs according to your desired property profile
      • Create and use custom fragment libraries
      • Target synthetically accessible fragments with the built-in retrosynthesis tool
    • Calculate quantitative solubility in pure (unbuffered) water at 25°C
    • Predict qualitative solubility at pH 7.4—compounds categorized from highly soluble to insoluble
      • GALAS (Global, Adjusted Locally According to Similarity) algorithm
      • Display of 5 most similar structures from the training set with experimental values
    • Estimate intrinsic solubility—logS0
      • Predictions based on a training set of >6800 compounds and a GALAS algorithm
      • Reliability value and up to 5 most similar structures from the training set provided with experimental data
    • Predict pH-dependent aqueous solubility—logS
      • Solubility at physiological pH values of interest (pH 1.7, 4.6, 6.5, 7.4, 8.0)
      • Plot of predicted pH versus solubility
    • Train the model with experimental values
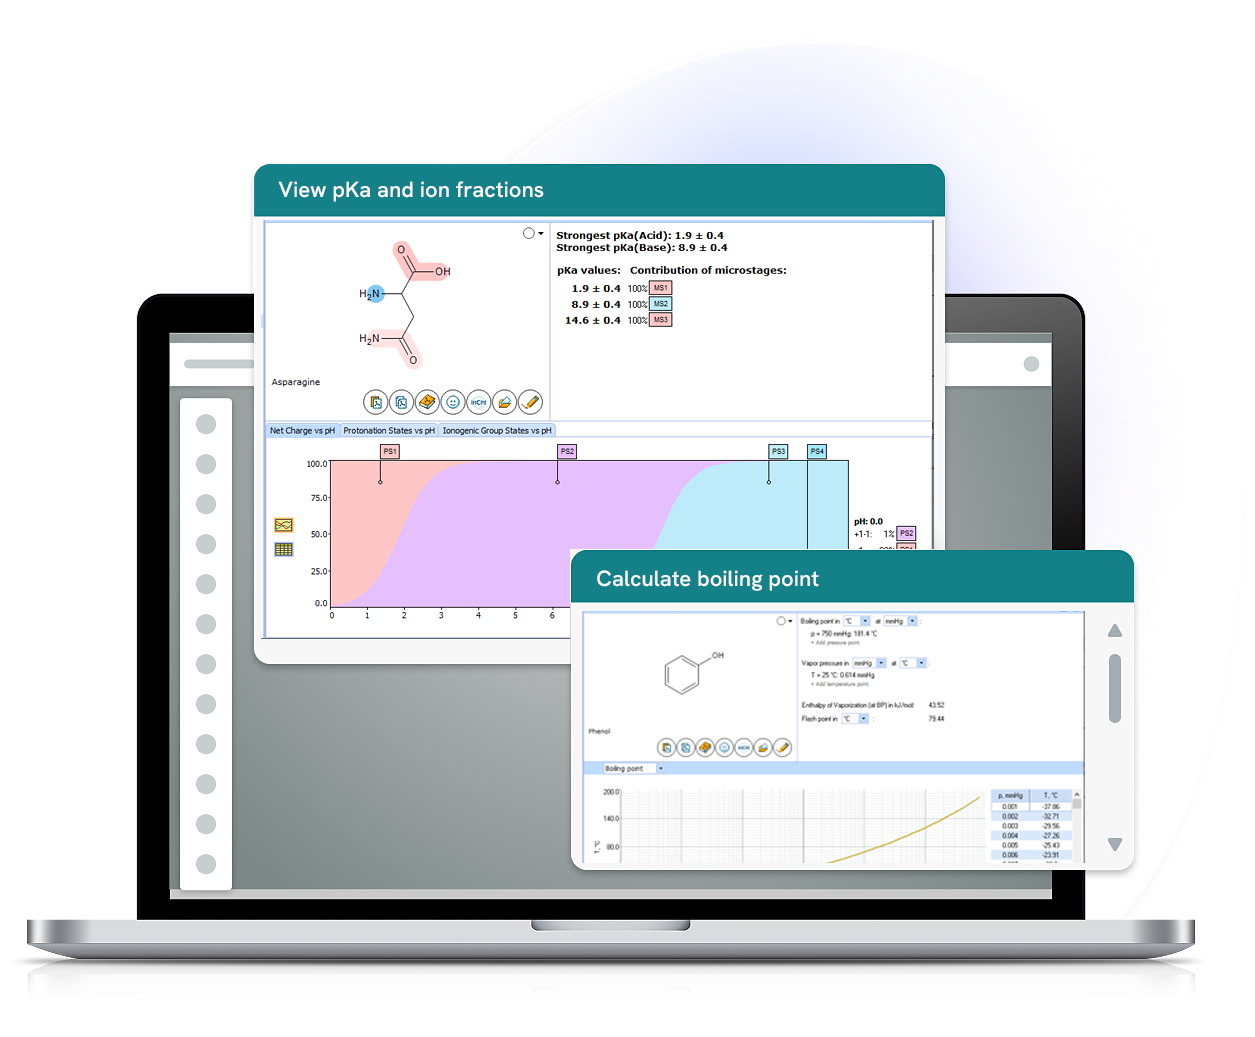
    • Estimate the boiling point of organic compounds as a function of pressure
    • Predict the vapor pressure as a function of temperature
    • Estimate the enthalpy of vaporization at the boiling point
    • Estimate flash point at the temperature unit of your choice
    • View results in a table or graphical plot
    • Predict logP—choose from three prediction algorithms:
      • Classic
      • GALAS (Global, Adjusted Locally According to Similarity
      • Consensus logP based on the other two models.
    • Detailed calculation protocol lists all contributing functional groups, carbon atoms, and interactions through aliphatic, aromatic, and vinylic systems (Classic)
      • Click protocol entry to highlight the corresponding entity on the structure
    • Color highlighting of the molecule to highlight hydrophilic/lipophilic substructures (GALAS)
    • Train the model with experimental values to improve predictions for proprietary chemical space
      • Create and select different training libraries for calculations, or switch to the built-in algorithm

    Learn more about LogP

    • LogD predictions are based on the logP and pKa models of PhysChem Suite
    • Select from a variety of logP and pKa algorithms (default: logP Consensus, pKa Classic)
    • View logD calculation results by pH
      • Physiologically relevant values (1.7, 4.6, 6.5, 7.4, 8.0)
      • Click and drag across the plot (logD vs pH) for logD at a pH value of interest
      • Add/remove predictions at a specific pH value
    • Train the model with experimental values of logP and pKa to improve predictions for proprietary chemical space
      • Create and select different training libraries for calculations, or switch to the built-in algorithm

    Learn more about LogD

    • Calculate the acid dissociation constant (pKa) under standard conditions (25°C, zero ionic strength) in aqueous solution for every ionizable group
    • Choose from two different algorithms: pKa Classic (default calculator) and GALAS
    • Information about each ionization process (dissociation reaction) for all stages of ionization
    • Color-coding of ionizable groups: red = acidic, blue = basic, purple = amphoteric ionization centers; color intensity indicates acid/base strength
    • Calculation of the strongest acid and base dissociation constants
    • Reliability range (in ±log units) for calculated pKa values
    • Detailed calculation protocol for each predicted ionization (referred to as dissociation stage)
      • Hover on a dissociation stage to see the related ionizable center highlighted on the structure
      • Click structure fragment to see it highlighted on the structure
    • Train the algorithm with experimental data

    Learn more about our pKa module

    • Display of the percentage contribution of individual ionization microstages to the final pKa
    • View calculated pKa values as a function of pH in interactive plots (pH 0-14) and tables (select pH values including the physiologically relevant values 1.7, 4.6, 6.5, 7.4)
      • Net charge vs. pH
      • Click and drag slider on the plot to see the ionic forms present at the pH of interest
      • See the fraction of all ionic forms present at a pH of interest
      • Protonation state vs. pH
      • Click on the protonation state label to display/hide its curve on the plot
        Ionogenic group state vs. pH
      • Ionogenic group state vs. pH
    • Calculate substituent-specific parameters for selected fragments of the molecule in aqueous solution, at zero ionic strength and 25°C
      • Electronic substituent constant (Hammett)
      • Steric constants (molar volume, molar refractivity)
      • Hydrophobic constant (Hansch Pi)
    • High accuracy—typical calculation accuracy of ±0.05
    • Internal database contains >850 substituents and >3000 carefully derived experimental electronic constants
    • Density
    • Freely Rotatable Bonds
    • H-Bond Donors and Acceptors
    • Index of Refraction
    • Molar Refractivity
    • Molar Volume
    • Molecular Weight
    • Parachor
    • Polar Surface Area
    • Polarizability
    • Rule-of-5
    • Surface Tension

    Product Comparison

    PhysChem Suite
    Other vendors
    PhysChem Suite Predict logD, logP, pKa, aqueous solubility, and more
    Other vendors Some platforms focus on predicting a narrower range of PhysChem properties
    PhysChem Suite Easily and quickly trainable models with your own experimental data
    Other vendors Model training is often unavailable or not easy enough to implement for the regular user
    PhysChem Suite Intuitive easy-to-use user interface for all property predictions from structure
    Other vendors Some platforms require more complex setup and navigation
    PhysChem Suite Knowingly optimize your lead molecules with guidance from Structure Design Engine
    Other vendors Some platforms focus primarily on property prediction rather than compound optimization
    PhysChem Suite Industry standard for pKa and logP predictions
    Other vendors The scientific basis and supporting information behind predictions can be limited
    PhysChem Suite Analyze rich meta-data provided with predictions and access detailed model documentation
    Other vendors Models often constitute a black-box from the user perspective

    What Our Customers Are Saying

    Quote from Brian Dean

    "The big advantage of [the] software is the big 'Easy Button' for all predictions, where you just drop in a structure and hit go, then everything you want is right there."

    Brian Dean Genentech

    Quote from Computational Chemist

    "Clearly the industry standard PhysChem prediction models and [they] deserve the position. They are the most consistent predictions that are applicable and usable in more complex models of drug-likeness."

    Computational Chemist

    "Merck Germany has deployed Percepta Enterprise software at their Research facilities in Germany and North America. It provides in silico tools for the prediction of Physicochemical, ADME and Tox properties, helping support the medicinal chemists in their planning of syntheses and optimization of new chemical entities. Their main reasons for choosing ACD/Labs Percepta Enterprise were its ease of use and, in particular, its configurability and ability to use existing in-house built algorithms."

    Merck Germany

    PhysChem Suite FAQs

    Ready to generate reliable property predictions for faster, more confident decision-making?

    Request a Quote

    Connect with a solutions expert to discuss what you need and explore best pricing options for you.

    Request a Quote

    Talk to Our Team

    Schedule a consultation with our scientific solutions experts to discuss your specific research workflows, requirements, and implementation needs.

    Contact Us

    Stay up to date

    Stay up-to-date on all the latest insights, research and product news from Revvity Signals.

    Stay up to date