Search

Your Notifications (0)

There are currently no notifications. You're all set!

What's New

Explore recent and historical product updates for Revvity Signals' Cloud Native SaaS Software 

Collapse All

55 releases — this page expanded. Collapse

What’s New

We are delighted to release our new version of Luminata®, Version 2026.

Highlighted Features

  • Direct export to JSON format in reaction & batch genealogy record set.
  • Enhancements to the forced degradation and stability study use case.

Administrators are recommended to subscribe to the channels within our support news site found at https://support.revvitysignals.com/hc/en-us/categories/360004446171-Support-News which contains more information about releases and other pertinent product information.

Further Details

Version 2026 adds new features including the ability to export to JSON format from the reaction and batch genealogy record set. There are also improvements to the visualization capabilities for forced degradation pathways.

Databasing

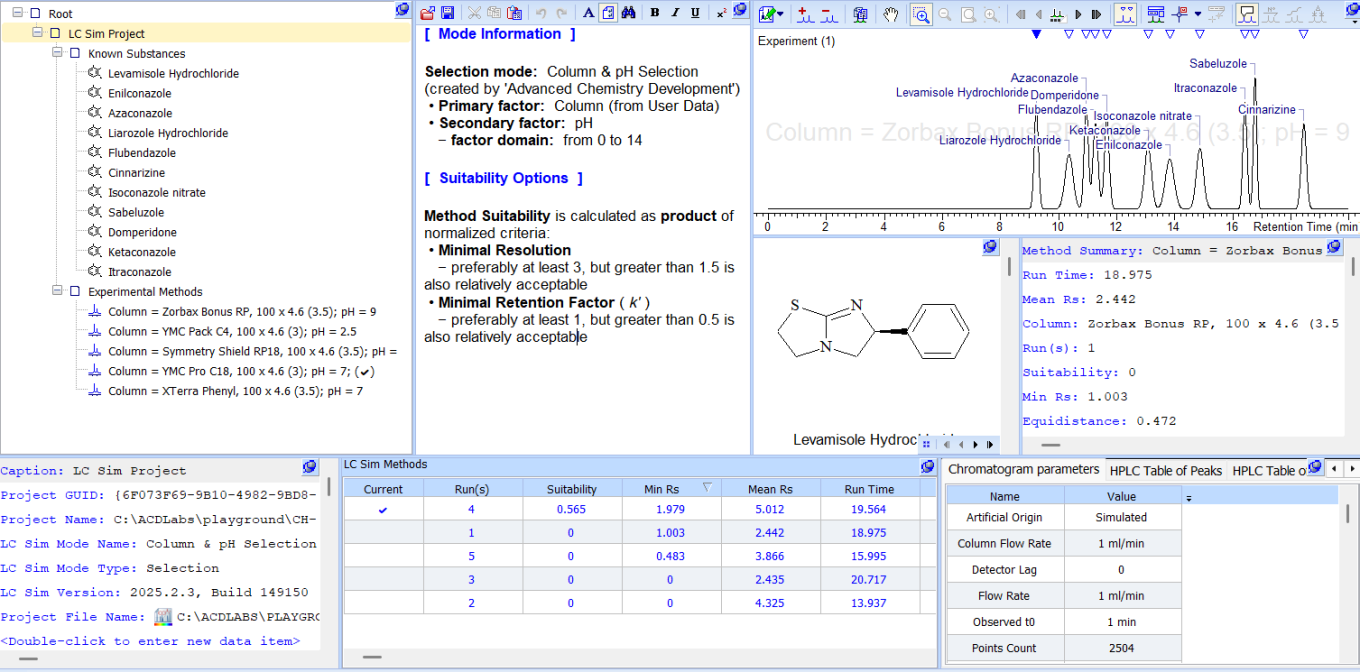
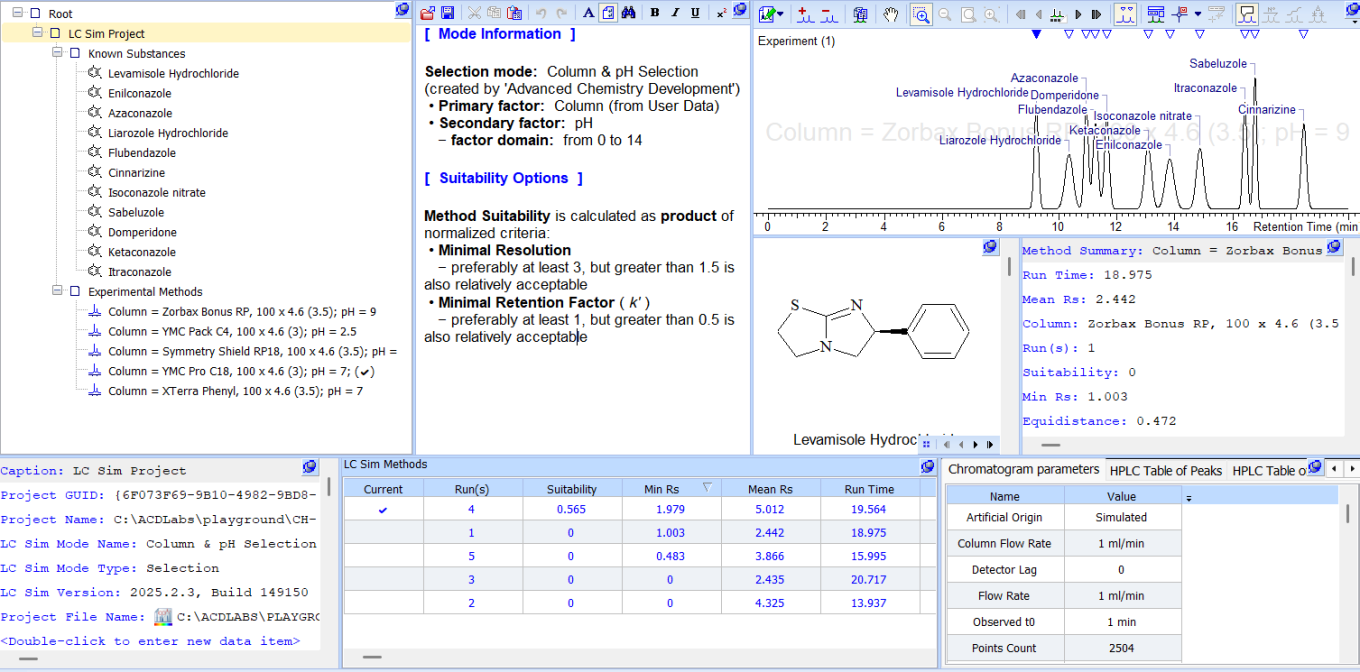
Create, View, and Edit LC Simulator Files in the Database

  • You can now edit and update LC Simulator .lc7 files in Spectrus databases.
  • You can now create a Spectrus DB screen form for convenient review of LC Sim Project records.
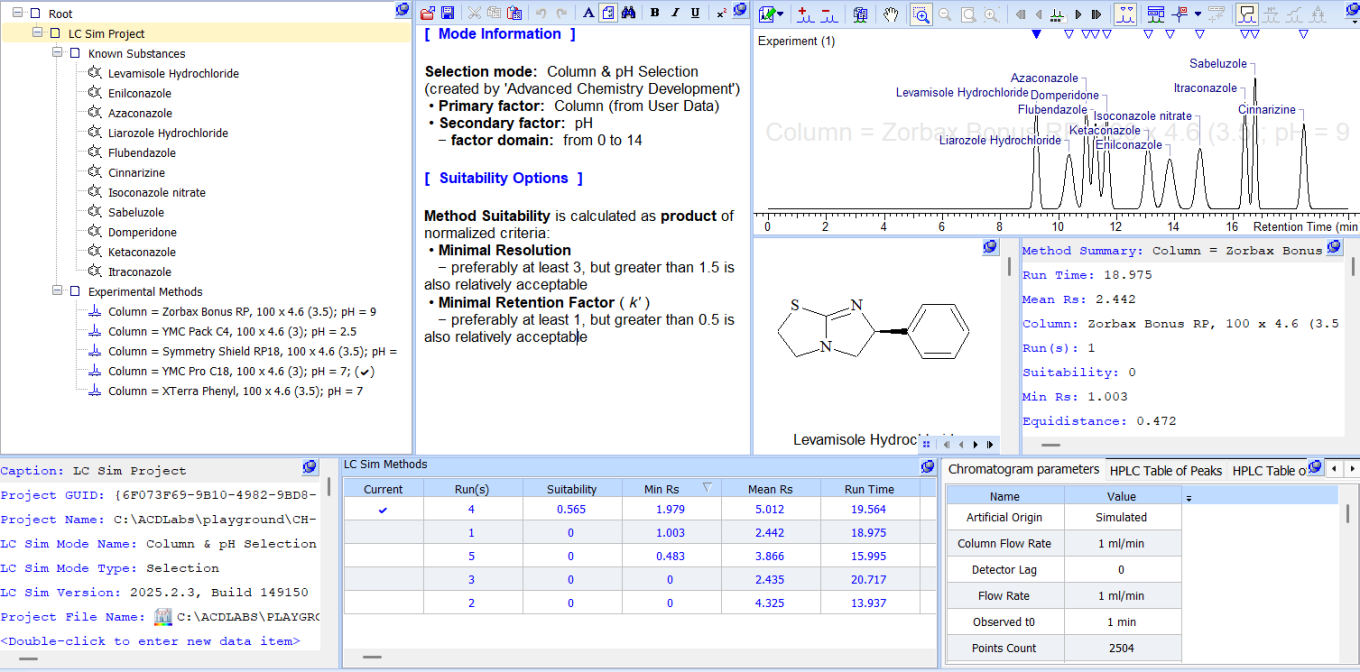
Image 1 from WN Luminata v2026.docx

Handle LC Simulator files in database view.

Data Management & Visualization

Enhancements to the Forced Degradation and Stability Study Use Case

  • You can now select significant degradants from each material study and use them to create a significant degradant map (degradants observed in multiple materials studies).
  • You can now view degradants from multiple studies in a single view by choosing to position the API in the center with degradants from different studies surrounding it. (Linear default view is still available for single degradant studies.)
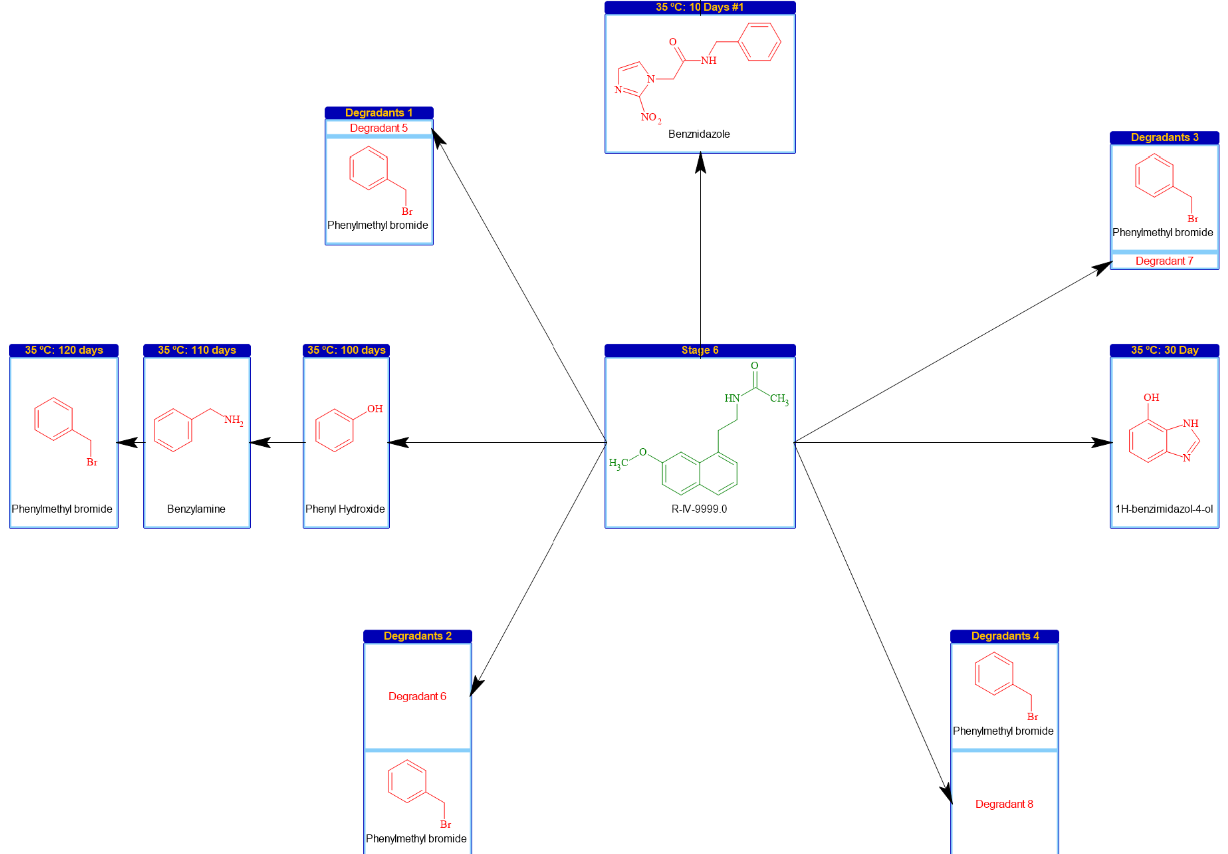
Visualize the degradant and stability map with the API at the center.

Ease of Use

  • View data in numerous tables with the expanded heat map capability.
  • Edit sample name in the control chart and genealogy analysis table.
  • Add a batch without associating it to a project and/or process name.
  • Reorder entities within the process map.
  • Choose to hide the “Custom Screen Form” toolbar for greater screen real-estate.
  • You now have a new option to visualize the stereochemical configuration of select stereocenters in database records. Previously you could either display or hide all stereocenters.

Data Import & Export

Direct Export to JSON Format in Reaction & Batch Genealogy Record Set

  • You can now export all the data related to a record set containing synthetic reaction pathways and batch genealogies in JSON format (applies for one or more records).

Include Structure Information in Data Exported in JSON Format

  • You can now include structure information in records/databases exported in JSON format via .mol files.

Improved MS & Chrom Data Import

  • Improved import filters for Thermo UVPD MSn data

Processing MS & Chrom Data with Luminata

Data Analysis & Processing

Component Spectrum Flexibility

  • You can now create component spectra based on the most abundant adduct ion ([M+H]+, [M+NH4]+, [M+K]+, etc.) This is particularly useful when the [M+H]+ ion is weak or exhibits a very low intensity.

Better Handling of Peptide Structures

  • Peptides can now be displayed in a simplified form in the Table of Components, making it easier to distinguish and interpret individual structures.

Import Components without Retention Time Assignments

  • You can now use existing datafiles to generate target lists (.sdf) for more streamlined batch processing. Components can be imported with or without existing retention times, reducing erroneous assignments and enabling reuse of component files across targeted analysis and other workflows.

Display Combined Retention Time

  • You can now display the combined retention time (tR) instead of scan numbers for clearer interpretation of chromatographic data.

Reporting

Select Components for Reporting

  • You can now choose which components from the Table of Components are included in reports when using the Component/Peak Layout Organizer.

Simplified Peptide Reporting

  • You can now report peptides in a simplified form for clearer presentation in reports.

Processing NMR Data with Luminata

Data Analysis & Processing

Internal Standard qNMR Concentration Calculation Now Included Out of the Box

  • Internal standard qNMR calculations are now available in the interface, similar to the external standard workflow (previously available as a script provided upon request).

Conveniently Calculate Similarity Score Between Two 1D Spectra

  • You can now calculate the Hit Quality Index (HQI) between two 1D spectra of the same nucleus without the need for the reference spectrum to be in a database. This can provide a quick quantification of the match between the current sample spectrum and that of a standard.

Better Peak Handling for 19F Spectra with Strong Couplings

  • You can now automatically pick and assign peaks in 19F spectra of structures containing CHF2 groups more accurately. When the proposed structure contains these groups, the software checks the spectrum for peaks associated with a typical AB spin system for F atoms (two strongly coupled doublets with an evident ‘roof’ effect).

Expanded 1H-31P Coupling Ranges in Auto Assignment

  • You can now more accurately assign and verify structures whose spectra contain large 1H-31P coupling constants with increased upper limits for JHP. The new expanded ranges are: 
    • 3–20 Hz for 2JHP
    • 0–20 Hz for 3JHP
    • 0–6 Hz for 4JHP

Define Parameters Once for All Replicates in External Standard qNMR

  • You can now define parameters including pulse angle, scans, and receiver gain once and have them applied to all selected spectra in external standard qNMR workflows with replicates when they cannot be automatically extracted from the raw data files.

Reporting

Set the Relative Height of “Median” Peak in Report

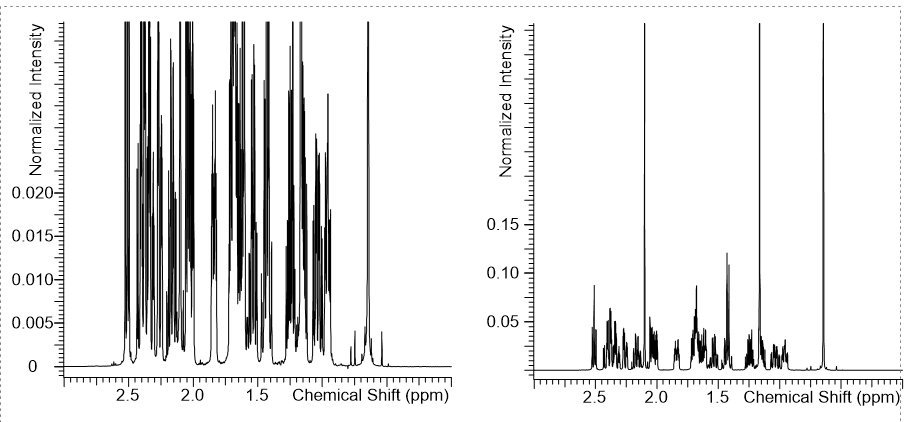
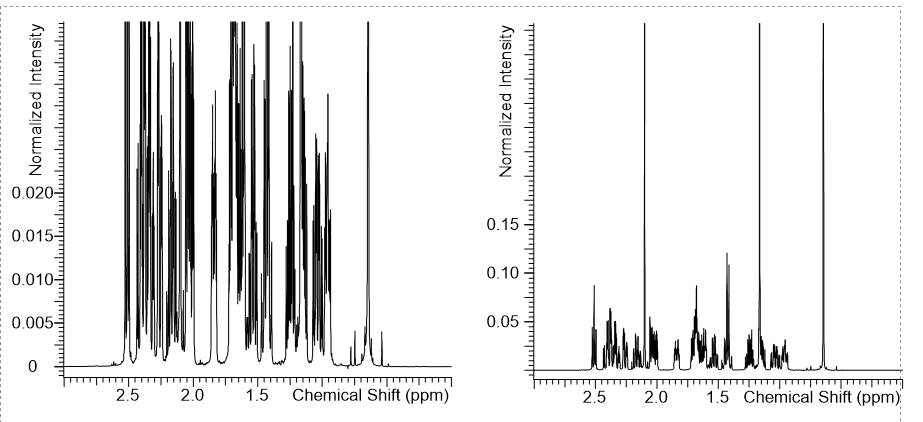
  • You can now better control the “Fit” option for dynamic Y-scaling of the 1D spectra in the reporting templates with the new Ratio parameter that allows you to specify the relative height of the “median” peak in the report.
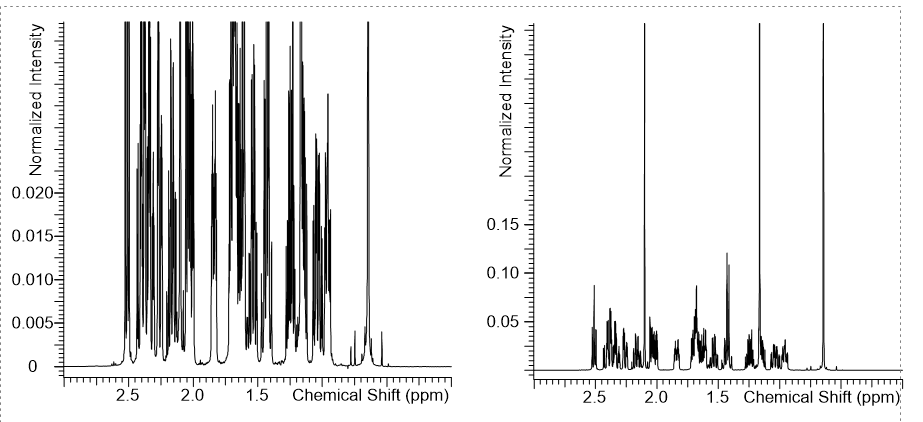
Image 3 from WN Luminata v2026.docx

Use the new ratio parameter for dynamic y-scaling of 1D spectra. 
Left spectrum has a fit = 90%, right = 10%
What’s New

We are delighted to release our new version of ChemAnalytical Workbook™, Version 2026.

Highlighted Feature

  • Create, view, and edit LC Simulator files in the database.

Administrators are recommended to subscribe to the channels within our support news site found at https://support.revvitysignals.com/hc/en-us/categories/360004446171-Support-News which contains more information about releases and other pertinent product information.

Further Details

Version 2026 adds new features for management of LC Simulator files. There are also improvements to data visualization and data export.

Databasing

Create, View, and Edit LC Simulator Files in the Database

  • You can now edit and update LC Simulator .lc7 files in Spectrus databases.
  • You can now create a Spectrus DB screen form for convenient review of LC Sim Project records.
Image 1 from WN ChemAnalytical Workbook v2026.docx

Handle LC Simulator files in database view.

Ease of Use

  • Choose to hide the “Custom Screen Form” toolbar for greater screen real-estate.
  • You now have a new option to visualize the stereochemical configuration of select stereocenters in database records. Previously you could either display or hide all stereocenters.

Data Import & Export

Import Bio-Sequence Assignments from Any NMR Spectrum

  • You can now import assignments for biomolecules from any NMR spectrum in STR format.

Include Structure Information in Data Exported in JSON Format

  • You can now include structure information in records/databases exported in JSON format via .mol files.

Improved MS & Chrom Data Import

  • Improved import filters for Thermo UVPD MSn data.

Processing MS & Chrom Data

Data Analysis & Processing

Component Spectrum Flexibility

  • You can now create component spectra based on the most abundant adduct ion ([M+H]+, [M+NH4]+, [M+K]+, etc.) This is particularly useful when the [M+H]+ ion is weak or exhibits a very low intensity.

Better Handling of Peptide Structures

  • Peptides can now be displayed in a simplified form in the Table of Components, making it easier to distinguish and interpret individual structures.

Import Components without Retention Time Assignments

  • You can now use existing datafiles to generate target lists (.sdf) for more streamlined batch processing. Components can be imported with or without existing retention times, reducing erroneous assignments and enabling reuse of component files across targeted analysis and other workflows.

Display Combined Retention Time

  • You can now display the combined retention time (tR) instead of scan numbers for clearer interpretation of chromatographic data.

Reporting

Select Components for Reporting

  • You can now choose which components from the Table of Components are included in reports when using the Component/Peak Layout Organizer.

Simplified Peptide Reporting

  • You can now report peptides in a simplified form for clearer presentation in reports.

Processing NMR Data

Data Analysis & Processing

Internal Standard qNMR Concentration Calculation Now Included Out of the Box

  • Internal standard qNMR calculations are now available in the interface, similar to the external standard workflow (previously available as a script provided upon request).

Conveniently Calculate Similarity Score Between Two 1D Spectra

  • You can now calculate the Hit Quality Index (HQI) between two 1D spectra of the same nucleus without the need for the reference spectrum to be in a database. This can provide a quick quantification of the match between the current sample spectrum and that of a standard.

Better Peak Handling for 19F Spectra with Strong Couplings

  • You can now automatically pick and assign peaks in 19F spectra of structures containing CHF2 groups more accurately. When the proposed structure contains these groups, the software checks the spectrum for peaks associated with a typical AB spin system for F atoms (two strongly coupled doublets with an evident ‘roof’ effect).

Expanded 1H-31P Coupling Ranges in Auto Assignment

  • You can now more accurately assign and verify structures whose spectra contain large 1H-31P coupling constants with increased upper limits for JHP. The new expanded ranges are: 
    • 3–20 Hz for 2JHP
    • 0–20 Hz for 3JHP
    • 0–6 Hz for 4JHP

Define Parameters Once for All Replicates in External Standard qNMR

  • You can now define parameters including pulse angle, scans, and receiver gain once and have them applied to all selected spectra in external standard qNMR workflows with replicates when they cannot be automatically extracted from the raw data files.

Reporting

Set the Relative Height of “Median” Peak in Report

  • You can now better control the “Fit” option for dynamic Y-scaling of the 1D spectra in the reporting templates with the new Ratio parameter that allows you to specify the relative height of the “median” peak in the report.
Image 2 from WN ChemAnalytical Workbook v2026.docx

Use the new ratio parameter for dynamic y-scaling of 1D spectra. 
Left spectrum has a fit = 90%, right = 10%
What’s New

We are delighted to release our new version of MS Workbook Suite™, Version 2026.

Highlighted Features

  • Faster, smarter fragmentation for complex peptide analysis.
  • Dynamic labeling for cyclic peptides.
  • Save time with fragment transfer.

Administrators are recommended to subscribe to the channels within our support news site found at https://support.revvitysignals.com/hc/en-us/categories/360004446171-Support-News which contains more information about releases and other pertinent product information.

Further Details

Version 2026 adds new features including faster fragmentation, dynamic labeling for cyclic peptides, and faster fragment transfer. There are also improvements in calibration and quantitation, and more.

Data Analysis & Processing

Faster, Smarter Fragmentation for Complex Peptide Analysis

Improved fragmentation algorithms enable faster processing of complex peptide samples, reducing hands-on time, and providing more comprehensive structural characterization, especially for complex cyclic peptides.

  • You can now process samples at least twice as fast as previous versions, dramatically reducing analysis time and increasing throughput for high-volume workflows.
  • You now have an additional sub-rule to allow for amide bond-reprotonatation, generating more biologically relevant "y-type" ions (Roepstorff-Fohlman-Biemann nomenclature) and improving structural confidence for cyclic peptides.
Image 1 from WN MS Workbook Suite v2026.docx

Amide bond reprotontation sub-rule applied to cyclic peptide fragmentation. This enhancement generates additional y-type ions by allowing proton transfer post-cleavage, improving fragment annotation and structural confidence.

  • You can now apply fragmentation across all selected components and their corresponding MS1 and MSn components and raw scans with minimal user interaction, freeing analysts to focus on other tasks while processing occurs in the background.
  • You can filter the resultant Table of Fragments by ion type (a-, b-, c-, x-, y-, z-, user-labeled, and non-labeled ions), enabling rapid identification of the most relevant fragments and simplifying analysis.

Dynamic Labeling for Cyclic Peptides

Dynamic labeling for cyclic peptides eliminates the need for manual library setup and provides flexible visualization options, accelerating structure characterization and simplifying complex peptide analysis.

  • You can now label cyclic peptides dynamically using one-letter and three-letter notations, without adding cyclic structures to the biosequence library to use cyclic peptide ion type labels—saving setup time and reducing library maintenance.
  • You can now run AutoAssignment for structures in your preferred view in either expanded (classic) or collapsed (1- or 3-letter notation)—giving you the flexibility to work in the format that best suits your workflow and interpretation needs.

Save Time with Fragment Transfer

  • You can now optionally transfer any fragment assignments directly to the query spectrum for the best hit found during an IXCR spectral search into a user-created database—accelerating structure elucidation and reducing manual interpretation time.

Improvements in Quantitation

Enhancements have been made to simplify quantitation and calibration workflows and enhance ease of use, delivering greater flexibility, precision, and efficiency. Using these features, you can now:

  • Optionally apply a weighting factor ‘1/x’ to first-degree polynomial calibration curves, enabling more accurate quantitation at lower concentration levels.
  • Add any chromatographic parameter to the calibration table, permitting configuration of a single table with all needed information.
  • View retention times and compound names as chromatographic descriptors for traces in the LC/UV/MS legend to simplify data interpretation.
  • Update the nominal amount directly from the calibration curve, without needing to restart the calibration project.
  • Re-access and edit the retention time window for the components after calculation of the calibration curve, saving time when refining calibration parameters.
  • Use Summed XICs (molecular and additional ions, that can be satellite, fragment, or adduct ions) for calibration and quantitation, providing more robust quantitation by incorporating multiple related ions.

Store MS3 Component Spectra in Spectrus DB

  • You can now store MS3 component spectra in Spectrus DB.

Improved Mass Accuracy

  • You can now set up fixed mass accuracy to calculate summed XICs. The following parameters have been introduced: 
    • XIC accuracy units = 0 (0-Da, 1-ppm)
    • XIC accuracy = 0.5 (0.5 Da is default value)
    • XIC accuracy (ppm) = 500 (500 ppm is default value)
    • Auto calculate summed XIC accuracy = True (by default we use dynamic accuracy)
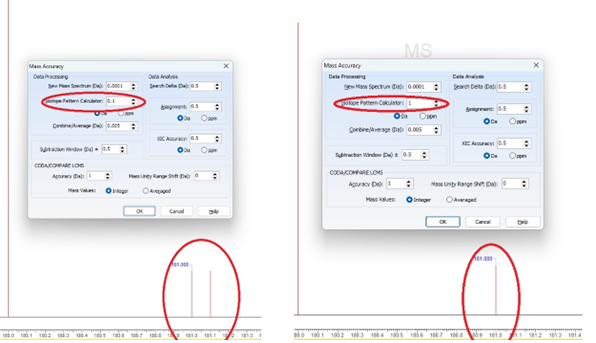
  • You can now set up mass accuracy for Isotope Pattern Calculator in ppm.

Seamless Analysis from a Wider Range of Instrument Types

  • You can now change the chromatogram type from xC/UV/MS to HPLC, GC, or CE, enabling seamless analysis of chromatography data from a wider range of instrument types.

Simplified Peak Naming

Save time and reduce errors with enhancements to peak naming when using UV peak matching tools. With these enhancements you can:

  • Automatically apply peak names across your entire dataset when using UV peak matching tools, eliminating repetitive manual labeling and ensuring consistent nomenclature.
  • Selectively retain previously assigned peak names (except “unknown”) during re-processing, preserving your work and enabling an iterative approach to data analysis without starting from scratch.

Improved Calculation and Display of Isotope Patterns

  • You can now set the mass accuracy and calculate the Isotope Pattern based on formulae for manual or Auto Assigned fragments, improving confidence in fragment assignments by providing more accurate isotope pattern matching.
Image 2 from WN MS Workbook Suite v2026.docx

Calculated Isotope Patterns for fragments, left shows Isotope Pattern Calculator set at 0.1 and right shows Isotope Pattern Calculator set at 1.

Improved Visualization of MS/MS Spectra

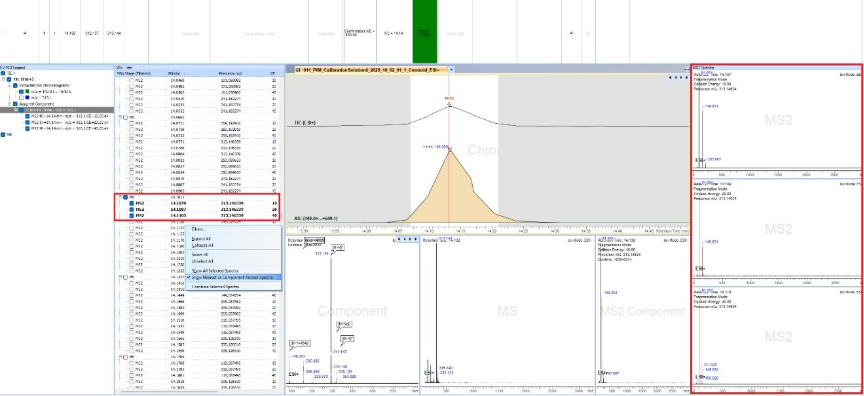
  • You now have the option to “Show Nearest or Component Related Spectra” to display all MS/MS spectra related to the selected component/precursor.
Image 3 from WN MS Workbook Suite v2026.docx

Visualization of three MS/MS Spectra related to the selected component.

Component Spectrum Flexibility

  • You can now create component spectra based on the most abundant adduct ion ([M+H]+, [M+NH4]+, [M+K]+, etc.) This is particularly useful when the [M+H]+ ion is weak or exhibits a very low intensity.

Better Handling of Peptide Structures

  • Peptides can now be displayed in a simplified form in the Table of Components, making it easier to distinguish and interpret individual structures.

Import Components without Retention Time Assignments

  • You can now use existing datafiles to generate target lists (.sdf) for more streamlined batch processing. Components can be imported with or without existing retention times, reducing erroneous assignments and enabling reuse of component files across targeted analysis and other workflows.

Display Combined Retention Time

  • You can now display the combined retention time (tR) instead of scan numbers for clearer interpretation of chromatographic data.

Databasing

Create, View, and Edit LC Simulator Files in the Database

  • You can now edit and update LC Simulator .lc7 files in Spectrus databases.
  • You can now create a Spectrus DB screen form for convenient review of LC Sim Project records.
Image 4 from WN MS Workbook Suite v2026.docx

Handle LC Simulator files in database view.

Ease of Use

  • Choose to hide the “Custom Screen Form” toolbar for greater screen real-estate.
  • You now have a new option to visualize the stereochemical configuration of select stereocenters in database records. Previously you could either display or hide all stereocenters.

Reporting

Improvements to the Reporting Template

  • Deconvoluted mass spectra can now be added to the Report by Template along with Raw and Component spectra.

Select Components for Reporting

  • You can now choose which components from the Table of Components are included in reports when using the Component/Peak Layout Organizer.

Simplified Peptide Reporting

  • You can now report peptides in a simplified form for clearer presentation in reports.

Ease of Use

  • You can now populate the “synonym” field in the Table of Components from the same field of the database record (when available).
  • You can now navigate directly from the Table of Components to the hit record in the database after running IXCR.
  • Settings for IX, IXCR, and ITA are stored along with the individual processed data set/traces.
  • “AutoAssignment Options” dialog now displays when the command “Auto Assign All Selected Components” is activated from the Table of Components.
  • You can now re-execute a Formulae Generator for selected components (previously you could only run Formulae Generator once for All or Selected components.
  • You can now export unassigned components from the Table of Components to an .sdf file.

Data Import & Export

Improved MS & Chrom Data Import

  • Improved import filters for Thermo UVPD MSn data.

Include Structure Information in Data Exported in JSON Format

  • You can now include structure information in records/databases exported in JSON format via .mol files.

Processing NMR Data

Data Analysis & Processing

Internal Standard qNMR Concentration Calculation Now Included Out of the Box

  • Internal standard qNMR calculations are now available in the interface, similar to the external standard workflow (previously available as a script provided upon request).

Conveniently Calculate Similarity Score Between Two 1D Spectra

  • You can now calculate the Hit Quality Index (HQI) between two 1D spectra of the same nucleus without the need for the reference spectrum to be in a database. This can provide a quick quantification of the match between the current sample spectrum and that of a standard.

Better Peak Handling for 19F Spectra with Strong Couplings

  • You can now automatically pick and assign peaks in 19F spectra of structures containing CHF2 groups more accurately. When the proposed structure contains these groups, the software checks the spectrum for peaks associated with a typical AB spin system for F atoms (two strongly coupled doublets with an evident ‘roof’ effect).

Expanded 1H-31P Coupling Ranges in Auto Assignment

  • You can now more accurately assign and verify structures whose spectra contain large 1H-31P coupling constants with increased upper limits for JHP. The new expanded ranges are: 
    • 3–20 Hz for 2JHP
    • 0–20 Hz for 3JHP
    • 0–6 Hz for 4JHP

Define Parameters Once for All Replicates in External Standard qNMR

  • You can now define parameters including pulse angle, scans, and receiver gain once and have them applied to all selected spectra in external standard qNMR workflows with replicates when they cannot be automatically extracted from the raw data files.

Reporting

Set the Relative Height of “Median” Peak in Report

  • You can now better control the “Fit” option for dynamic Y-scaling of the 1D spectra in the reporting templates with the new Ratio parameter that allows you to specify the relative height of the “median” peak in the report.
Image 5 from WN MS Workbook Suite v2026.docx

Use the new ratio parameter for dynamic y-scaling of 1D spectra. 
Left spectrum has a fit = 90%, right = 10%

What’s New

We're delighted to introduce ChemDraw Desktop 26.1, which delivers enhancements that improve security, administrative flexibility, and chemistry workflows. This release adds support for modern authentication standards, expanded deployment controls for administrators, and improvements to structure naming and editing capabilities. We have also addressed several bugs and usability issues to provide a more seamless experience.

ChemDraw Desktop

  • Authentication & Administration Improvements 
  • Chemistry & Drawing Improvements

ChemDraw Desktop

Authentication & Administration Improvements

Administrators can now disable automatic updates for ChemDraw Desktop deployments. This provides greater control over software rollout and validation processes in regulated or managed IT environments. Configuration options are available for both Windows and macOS deployments.

ChemDraw for Excel now prompts users to sign in only when ChemDraw functionality is accessed. Previously, users were prompted to authenticate whenever Excel was launched with the add-in installed.

Signals ChemDraw now supports Proof Key for Code Exchange (PKCE) authentication when signing into Signals. This enhancement improves compatibility with modern authentication standards and organizational security requirements.

Chemistry & Drawing Improvements

Image 1 from 26.1 ChemDraw Desktop September 2026.docx

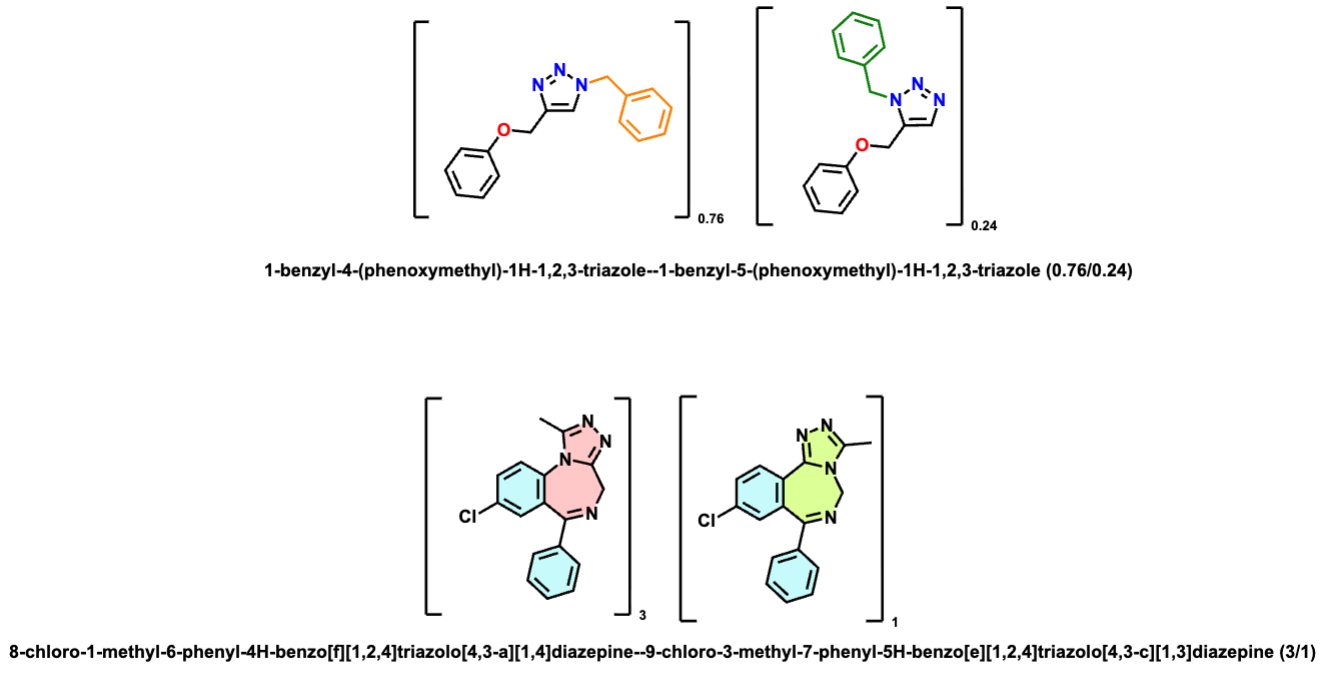
ChemDraw naming capabilities have been expanded to support mixtures containing non-integral component ratios. This improves handling of chemically relevant mixtures and generates more accurate nomenclature for these structures.

Image 2 from 26.1 ChemDraw Desktop September 2026.docx

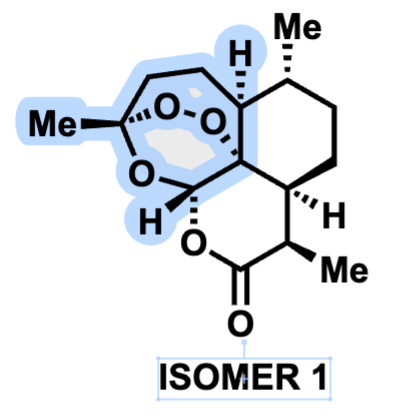
When a structure contains an attached data label, selecting the label now automatically highlights the atoms associated with that label. This makes it easier to identify the portion of the structure represented by the selected data.

Image 3 from 26.1 ChemDraw Desktop September 2026.docx

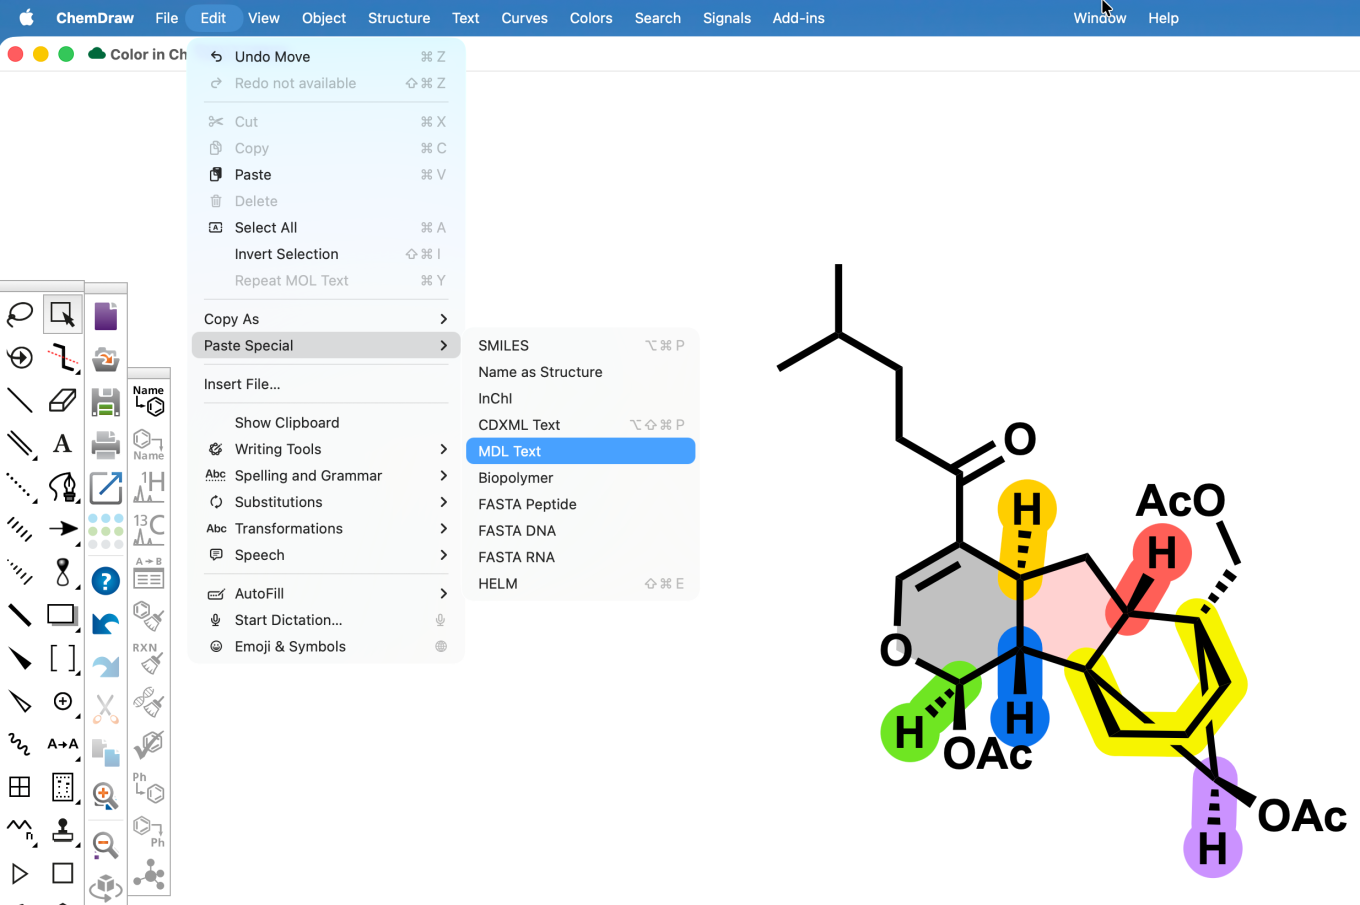
The Edit > Paste Special menu has been updated to provide separate options for CDXML Text and MDL Text. Previously, both formats were combined into a single menu item. The existing keyboard shortcut remains associated with CDXML Text, while MDL Text is available as a separate option.

What's New

We are delighted to release our new version of Signals, 26.8.

The following improvements are available for users, administrators and developers on the Signals platform. Certain features may only be available with appropriate licensing and/or with enablement by an administrator.

  • Fundamentals
    - SMILES management in Solvate list
    - Product selection on Bulk Sample creation in Parallel Experiments
    - Mapping of HELM string in External Enumerator
    - Audit trail displays highlighted granular changes for structured tables such as hierarchical tables, variations tables, materials tables, etc is available to all systems
    - Audit trail displays highlighted granular changes for worksheets is available to all systems
    - Audit trail displays highlighted granular changes for ChemDraw Stoich Grid
    - Manage assay variant lifecycles and compliance* (beta)
  • Data Workflows & Analytics*
    - Create and assign custom parameter sets
    - Fit linear concentration data using new system Agonist and Antagonist dose-response models
  • SAR & Decisioning*
    - Use Insights to query, generate, and analyze Measurement and SAR Tables directly in Signals is available to all systems
    - Explore key results faster in Insights with a cleaner default SAR table and dynamic chemical structure filtering directly
    - ChemCharts: New antibody engineering and molecule alignment data functions, plus updates to visualization settings including visual cloning and per-column tooltips
  • Synergy†
    - Designs now support LogP, predicted pKa, Labute ASA, and other calculated properties
    - Designs import now supports CSV with HELM notation
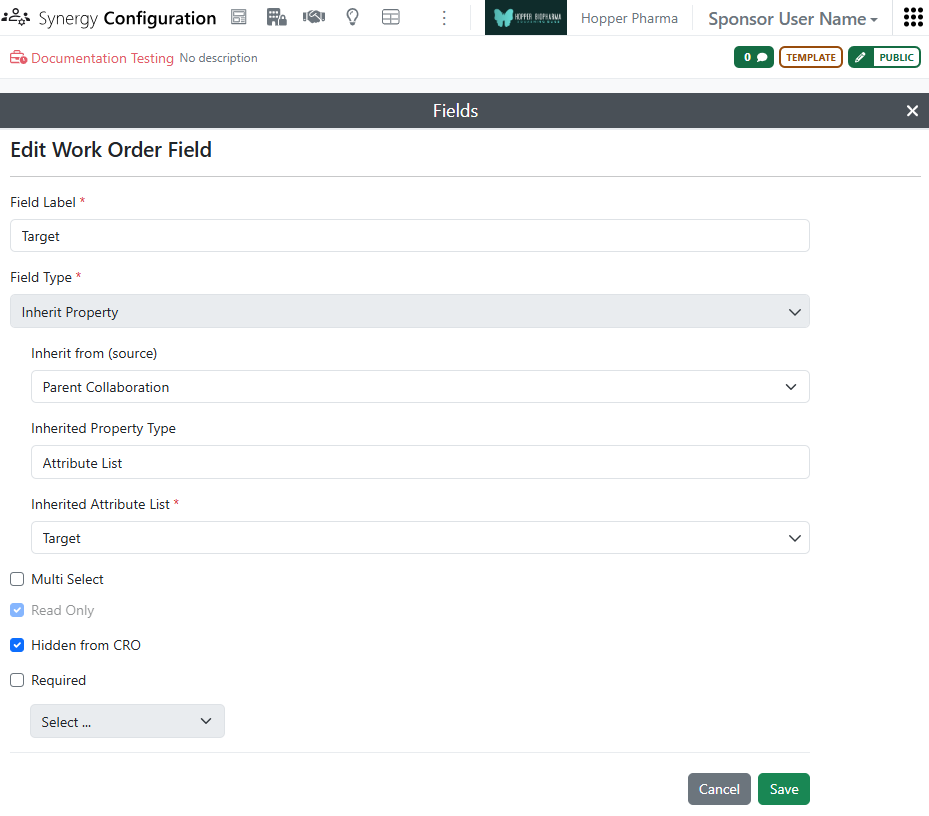
    - Work Order properties can inherit from Collaboration properties
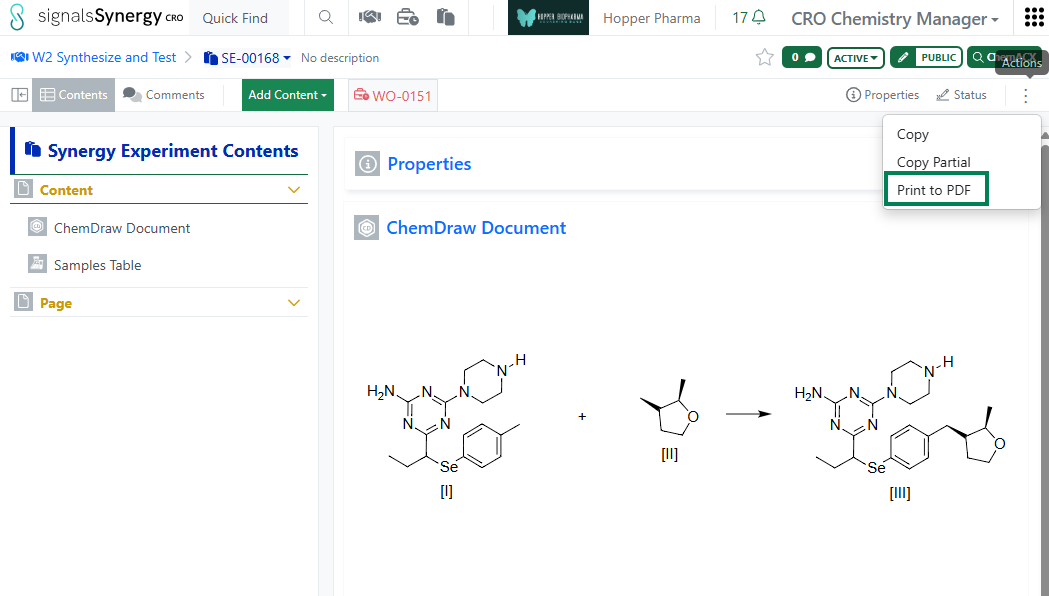
    - CRO users can print Synergy Experiments to PDF
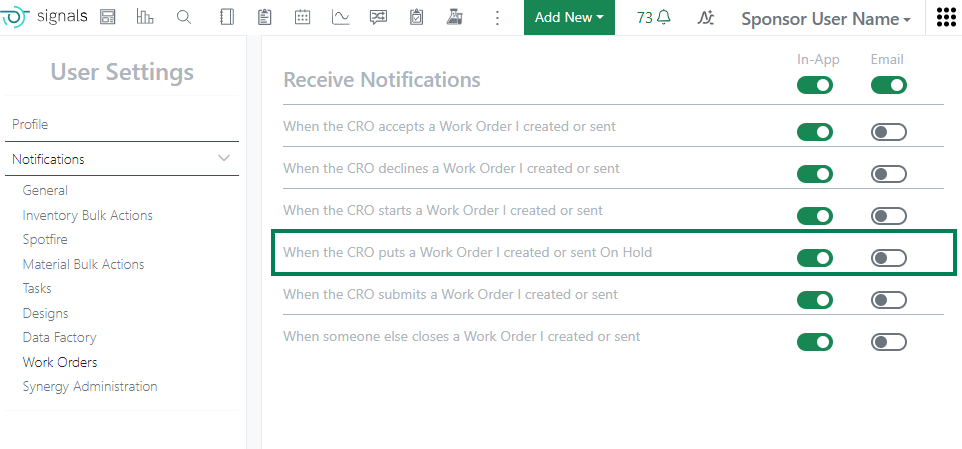
    - New Sponsor notification when a CRO user puts a Work Order On Hold
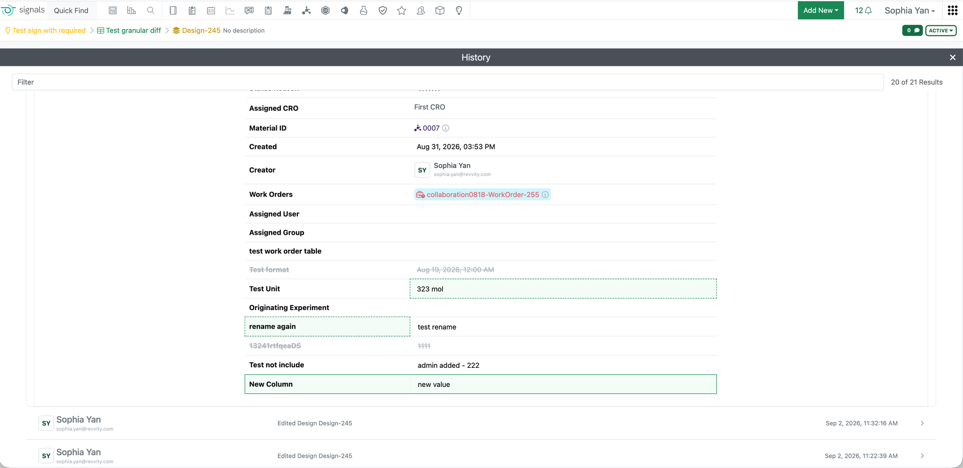
    - Audit trail displays highlighted granular changes for Design tables
  • Tables
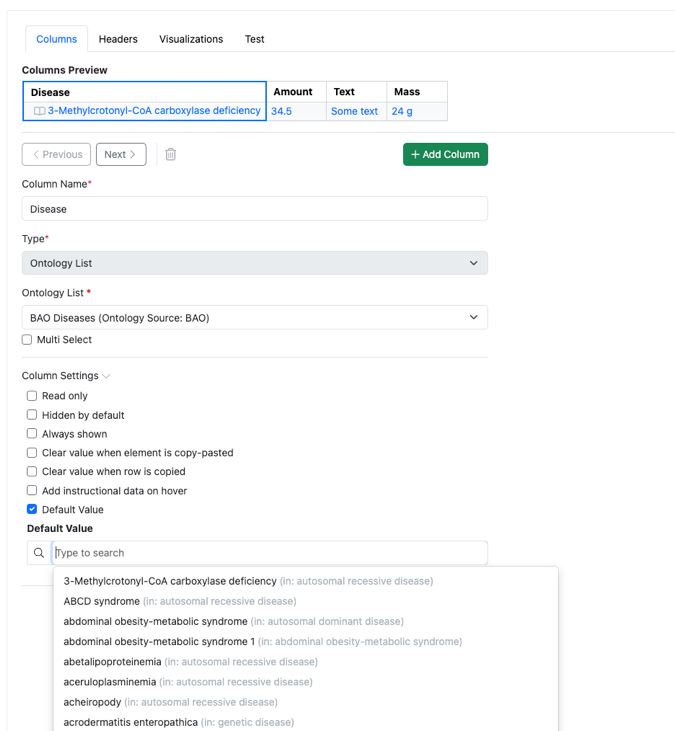
    - Default values for Headers and Properties in Admin Defined Tables and Variation Tables
    - Default values for Headers and Properties in Hierarchical Tables*
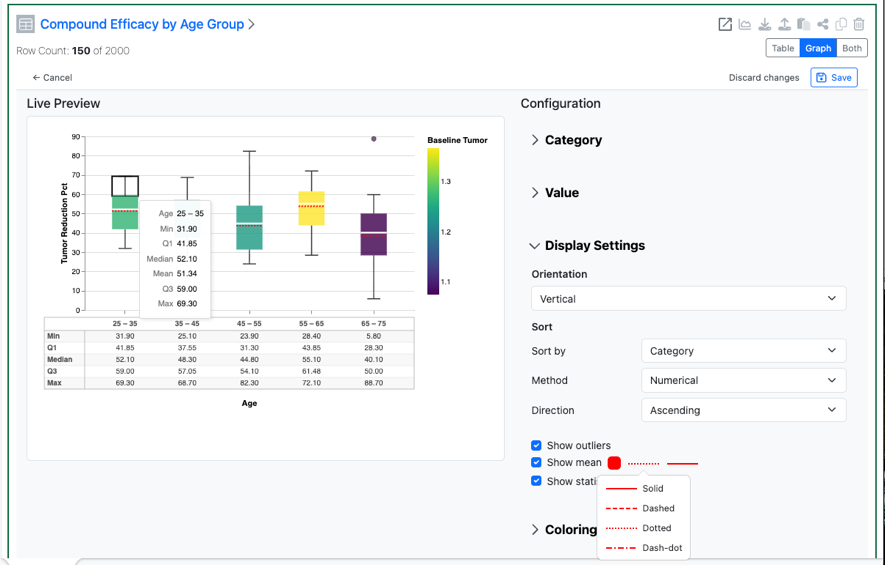
    - Display Mean in Box Plots*
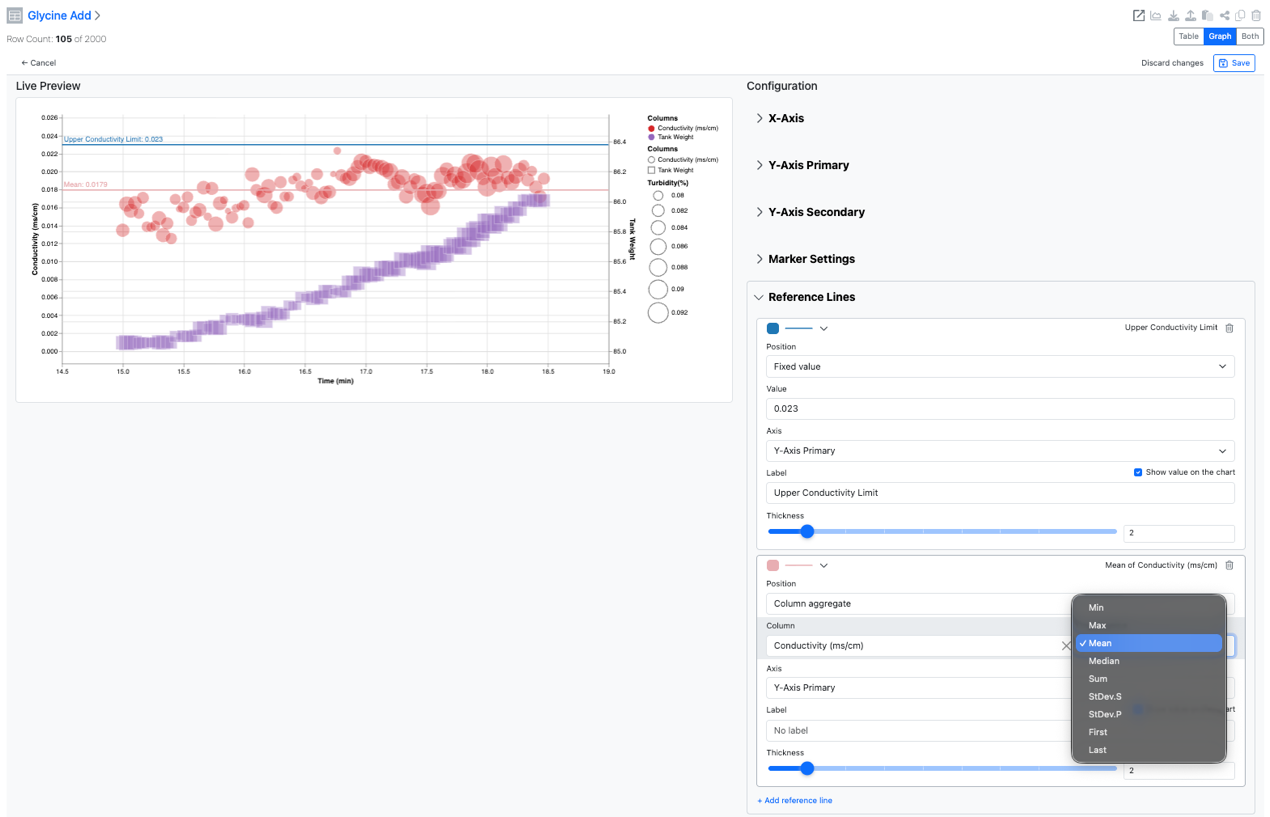
    - Define Reference Lines on charts*
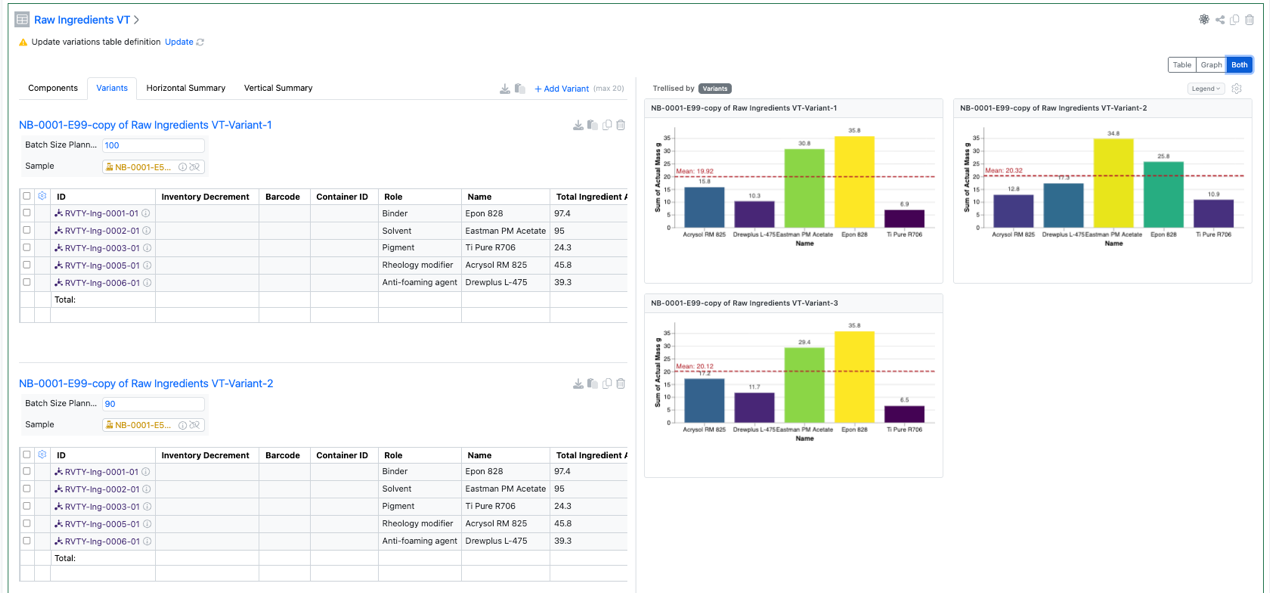
    - Define charts on Variation Tables*
  • Plates
    - Hide column in table when Annotation layer is hidden
  • Inventory
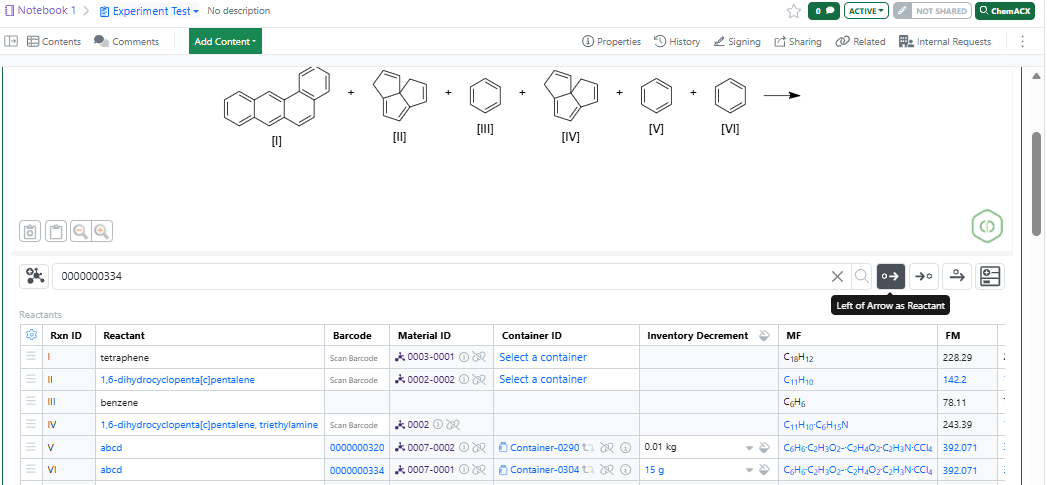
    - Record consumed quantities directly from a container while automatically tracking the remaining balance and vice versa
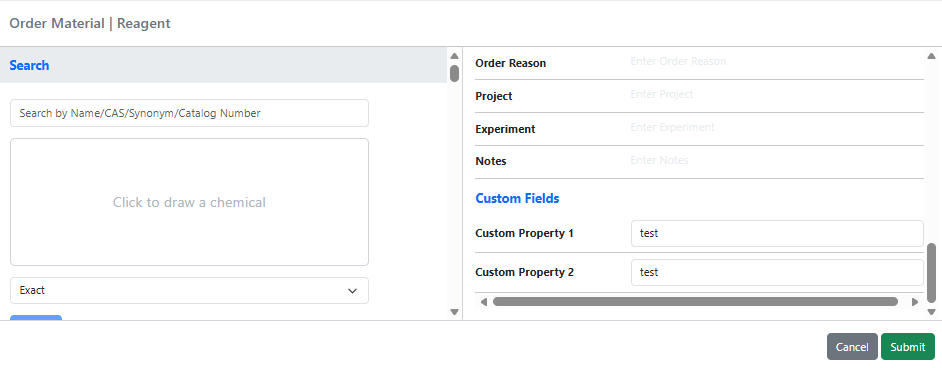
    - Support for Material Orders custom field types
    - Faster Quick Add Workflow in ChemDraw Document
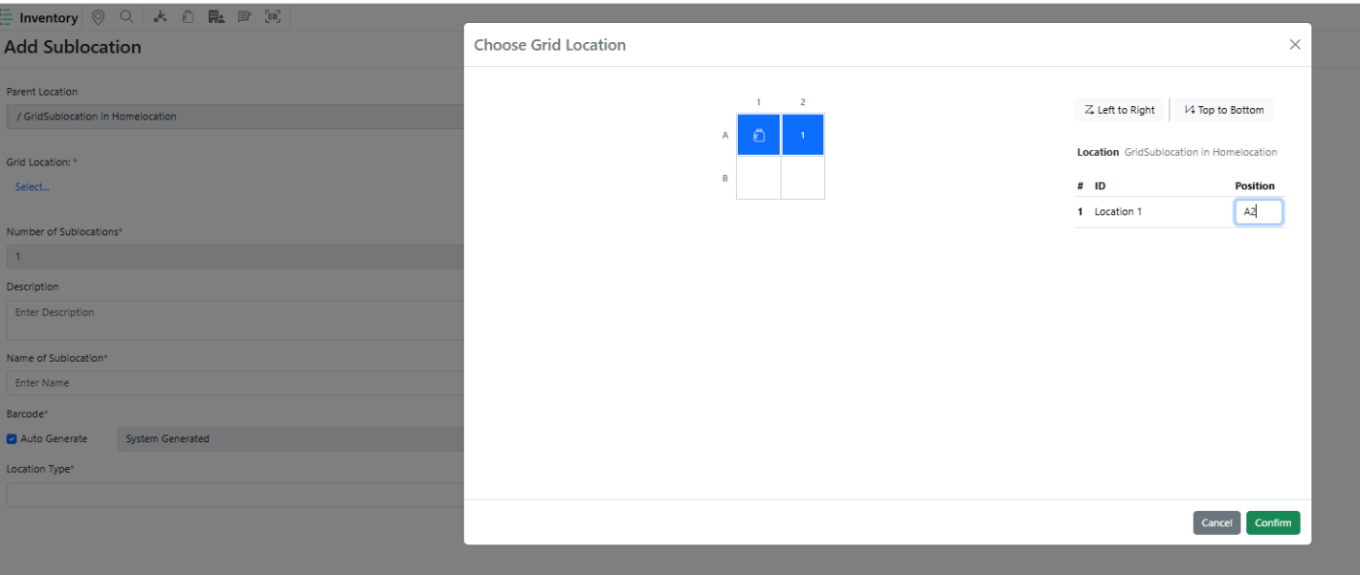
    - Prevent the creation of grid sub-locations within designated home location cells
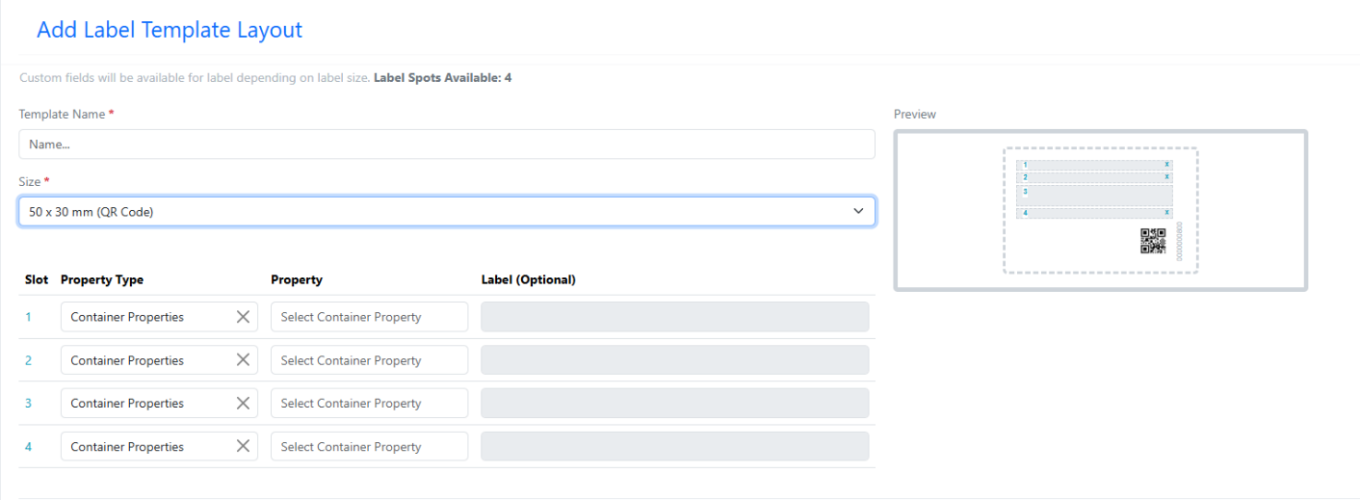
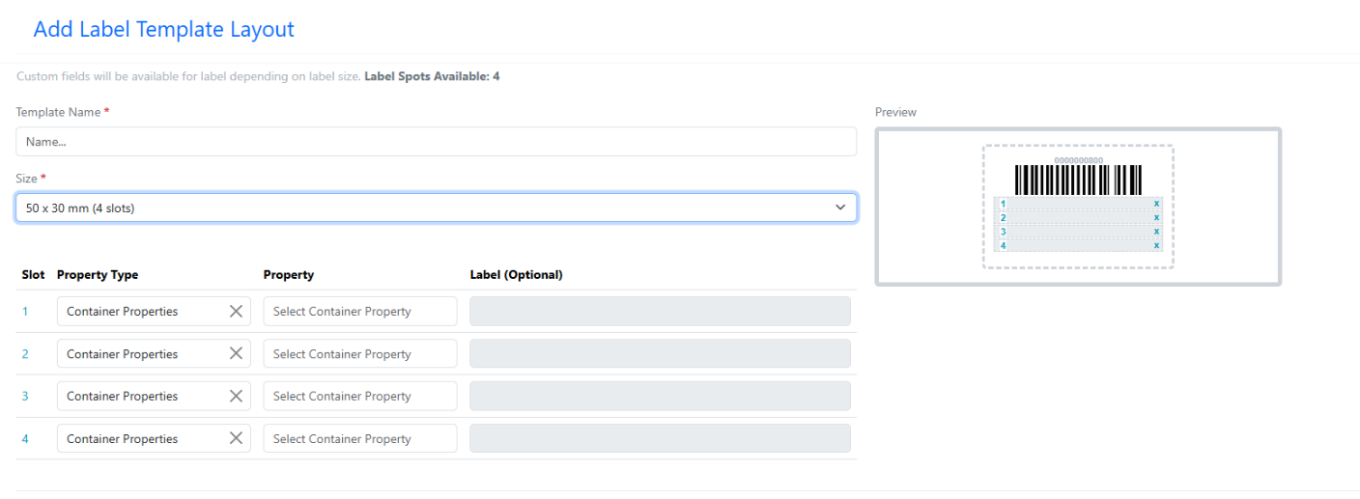
    - New Container Label Templates - 50 x 30 mm (QR Code) and 50 x 30 mm (4 slots)
    - Design and customize Inventory label templates layouts (beta)
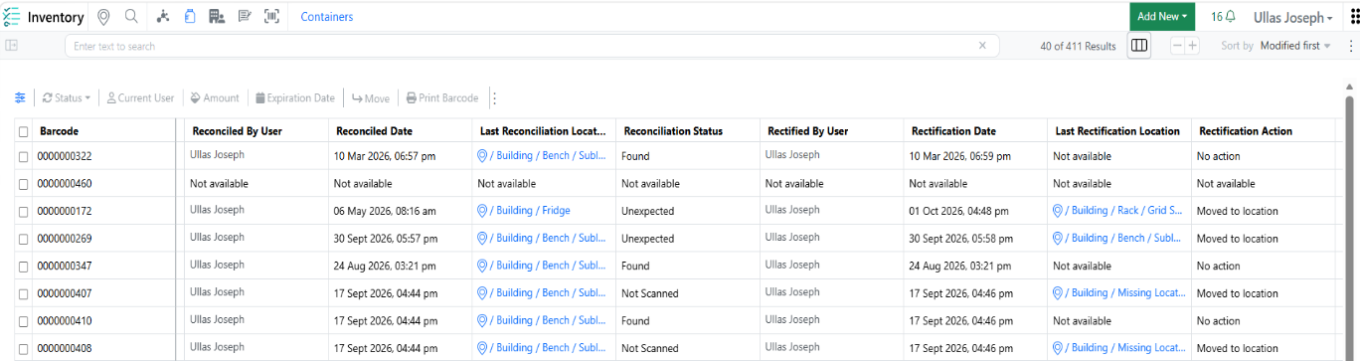
    - Reconciliation and Rectification details added to Container Search Table
  • InventoryGo ‡
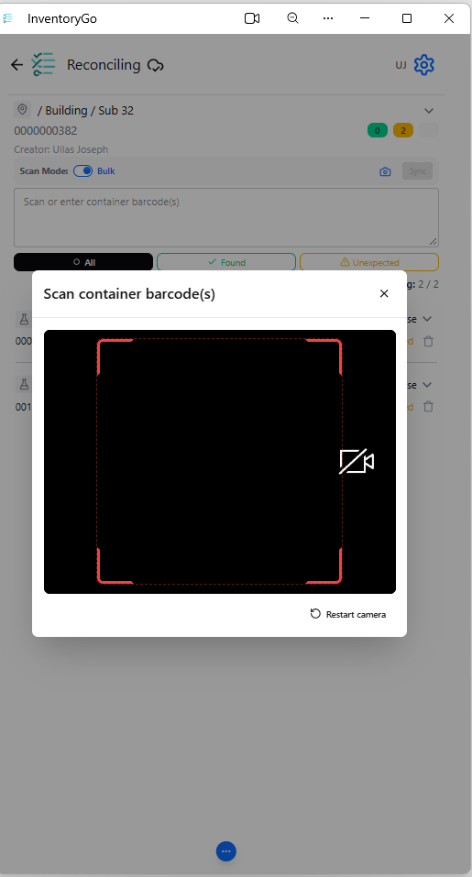
    - Support for Barcode and QR Code Scanning via Camera scanning
  • Materials
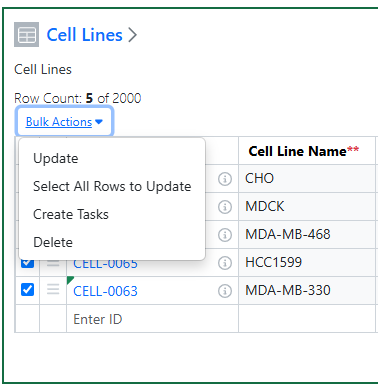
    - Bulk update materials tables
    - HELM String calculated property
  • ELN Archive
    - Combined ELN Archive and Signals Search (beta)
  • Administration
    - Configure Data Factory maps to support user-defined fixed values*
  • Integrations & APIs
    - Create Material Order via API
    - FASTA support for writing to Chemical Drawings via API
    - Fetch Material Reports via API
  • Xynthetica*
    - Xynthetica Administrative UI (beta)
  • Formulations*
    - Formulations Development (beta)

* Requires Signals One license

† Requires Signals Synergy license

‡ Requires InventoryGo license

We also fixed several small bugs in this release. Details of the enhancements are described below.

The following OnDemand videos for Signals Notebook Administrators are now available:

  • Data Exchange Mapping Settings for Publication to Data Factory
  • Synergy Experiment Mapping Settings for Publication to Data Factory

Data Factory now enforces a limit of 100 endpoints per measurement type

Data Factory administrators should be aware that all primary APIs will be deprecated in a future release.

Data Factory administrators should be aware that ‘username’ has been removed from the primary API GET /datafactory/search-service/my-saved-searches

Data Factory Administrators should complete migration of legacy data factory projects before 27.4; after this the migration deadline, legacy projects will become read-only and no longer support data publication.

Data Factory administrators should also note that the Advanced Security policies in Inventa apply an “AND” logic across all user groups, restricting access if any groups lack permissions. This behavior differs from the standard Signals security model and will be fixed to align with the standard in a future release.

Administrators are recommended to subscribe to the channels within our support news site found at https://support.revvitysignals.com/hc/en-us/categories/360004446171-Support-News which contains more information about releases and other pertinent product information.

This content is anticipated for release on our Production E3 environments, and for Private Cloud customers on our deferred release schedule, in March 2027.

Further Details

The following improvements are available for users, administrators and developers on the Signals platform. Certain features may only be available with appropriate licensing and/or with enablement by an administrator.

Fundamentals

Image 1 from What's New 26.8.docx

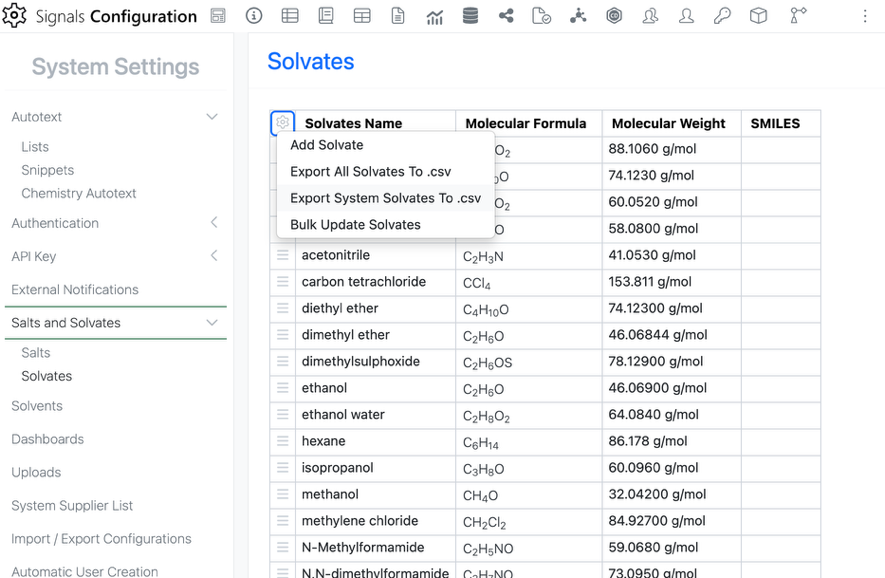
In preparation for expanding the Salt Stripping functionality of Normalized Compounds to Solvates, the Solvates list in the SN Config has been updated to allow for SMILES management as well.

To manage Solvate SMILES, the user can navigate to the Solvate list in the System Settings

Image 2 from What's New 26.8.docx

The SMILES for the System provided Solvate list can be added by “Exporting System Solvates To .csv” and Bulk updating Solvates. Individual Solvate SMILES can be entered directly in the Text SMILES column.

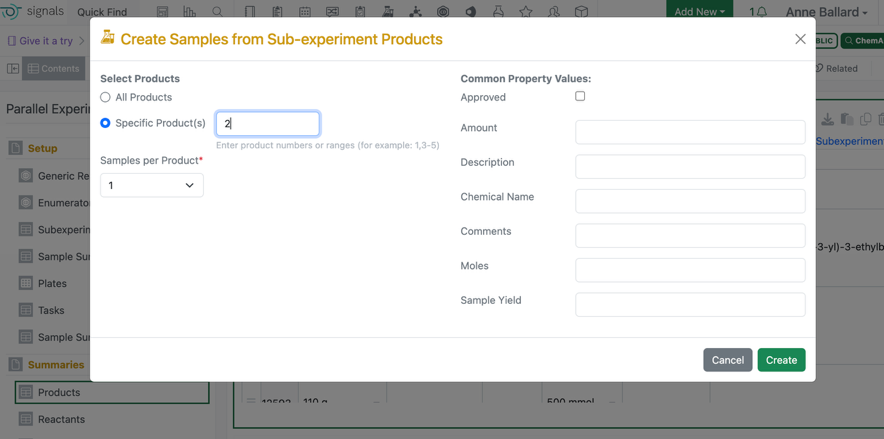
In Parallel Experiments, users will now have the option to select which Product to use on Bulk Sample creation. When the user goes to Bulk create samples, there will now be an option to select which product to use in sample creation, ie. P1 or P2. Utilizing the “All Products” selection will preserve existing behavior.

Image 3 from What's New 26.8.docx

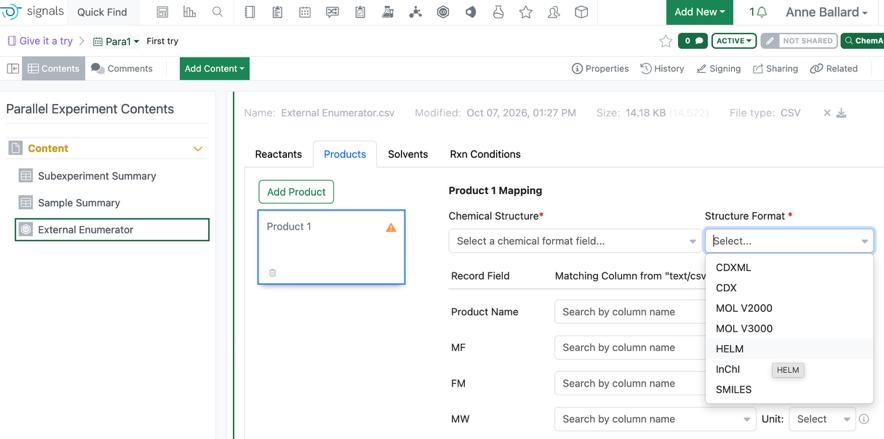
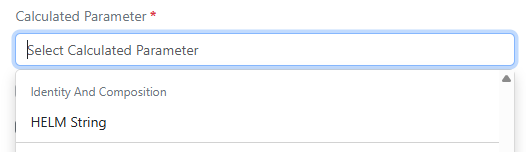
The HELM string is now an available option for mapping the Chemical Structure in the External Enumerator.

Image 4 from What's New 26.8.docx

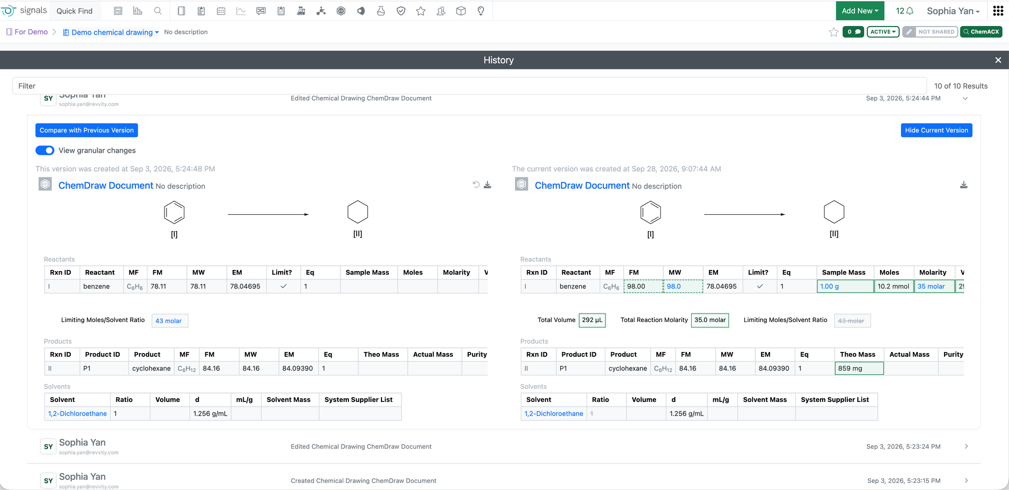
Users can view visual granular change comparisons for ChemDraw Stoichiometry Grids in the audit trial. When enabling the “View granular changes” toggle, field and value updates are clearly highlighted: green indicates newly added data, a green dashboard boarder denotes modified data, and gray represents removed entries. This visual comparison also applies to the Reactants Summary table as well as table visibility changes (showing or hiding stoichiometry tables). Note: visual diffs for Chemical drawings (molecular diagrams) are not supported by this tool.

Data Workflows & Analytics

Image 5 from What's New 26.8.docx

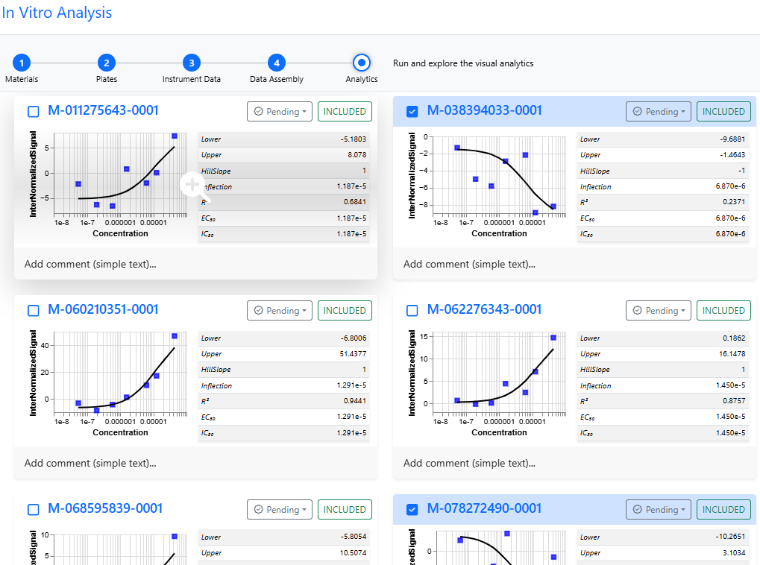
In the Curve Fitting step of the In Vitro Analysis, following an analysis run, it is now possible for Signals One users to select some of the curves and apply a new set of fit parameters to these curves specifically to improve their curve fitting.

Image 6 from What's New 26.8.docx

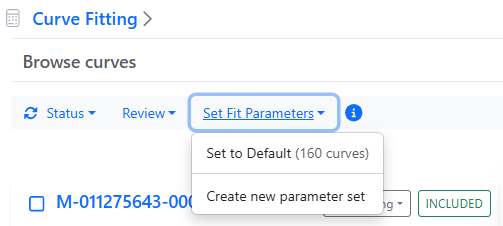
A new pull down menu in the bulk actions bar is now available to set the fit parameters:

Image 7 from What's New 26.8.docx

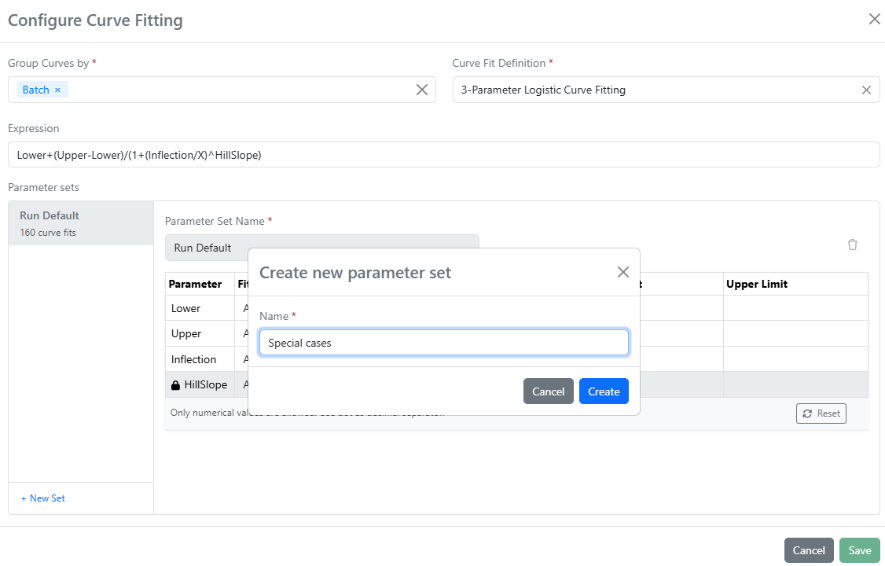
Each new set of curve fitting parameters, identified by a name, can then be applied to the selected curves for recalculating the curve fits.

Image 8 from What's New 26.8.docx

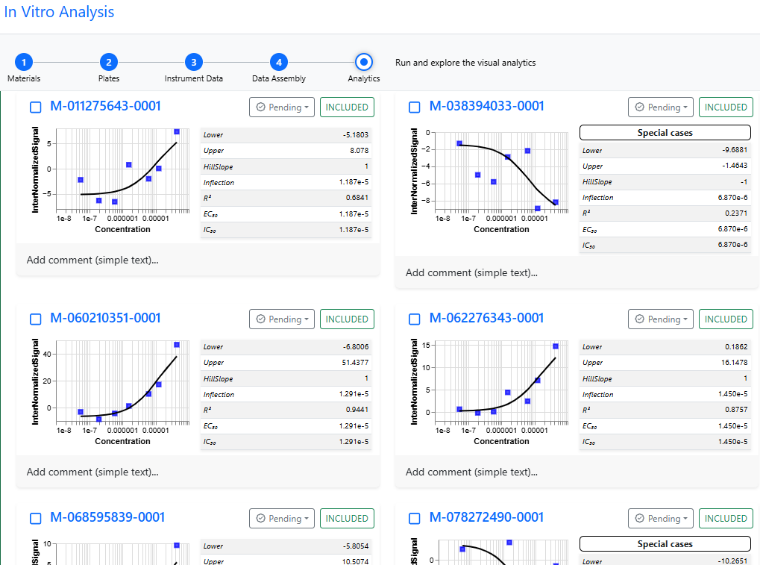
The name of the parameter set remains associated with the curves that were recalculated with it.

Image 9 from What's New 26.8.docx

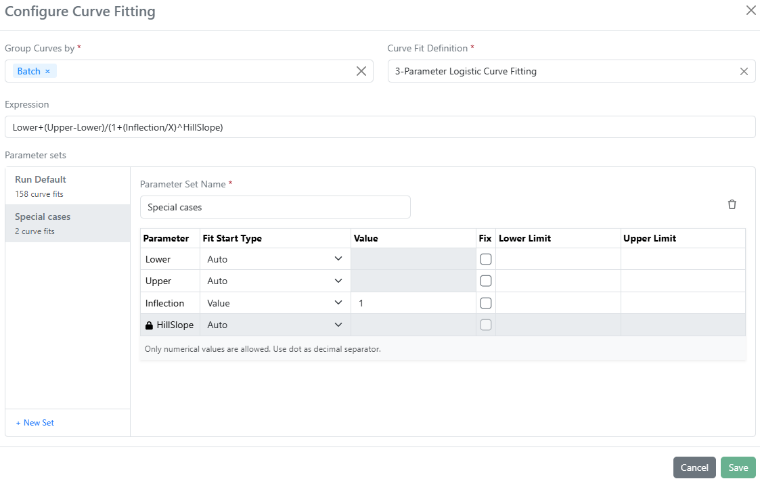
Finally, the parameter sets in the analysis, which can be part of the In Vitro Analysis template, can be managed by clicking on the cog wheel in the upper right corner of the Curve Fitting element. The number of curve fits using each of the parameter sets is visible:

Image 10 from What's New 26.8.docx

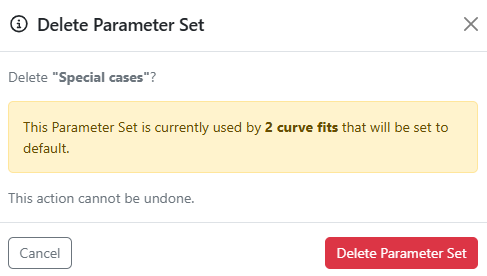
When deleting a set of parameters used to recalculate some of the curves, the default parameters used for the initial global run are automatically reapplied.

Image 11 from What's New 26.8.docx

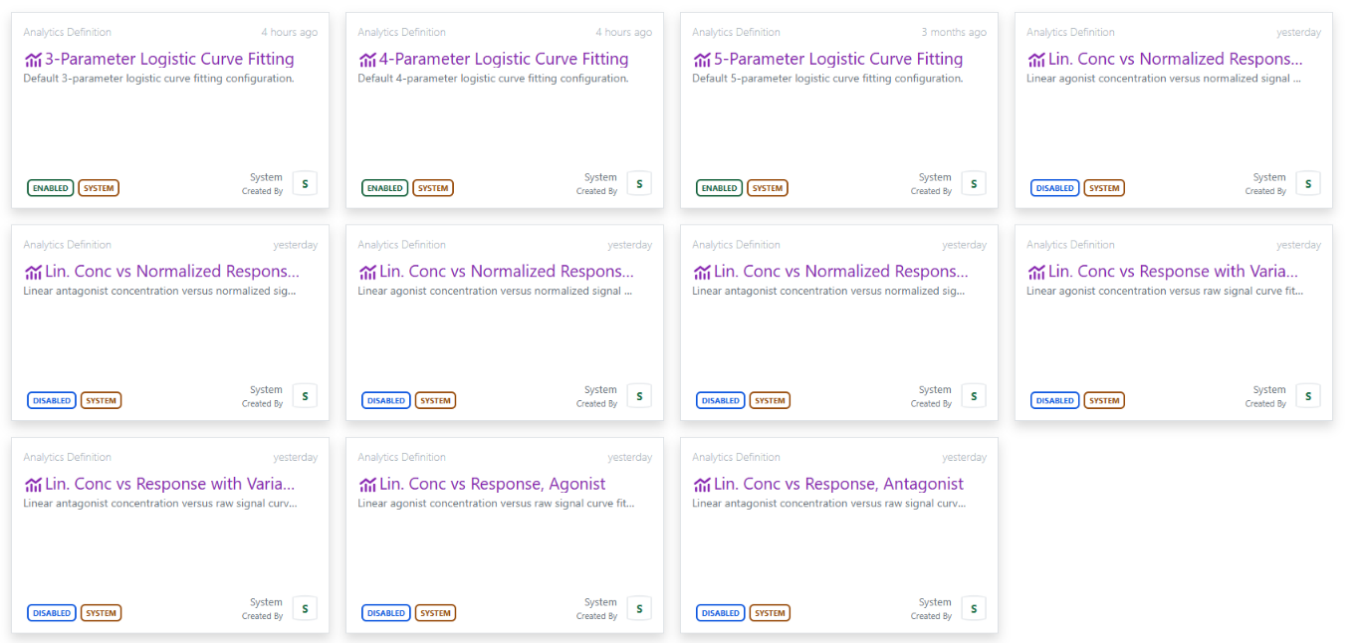
Moreover, in addition to the 3, 4 and 5 Parameters logistic curve fitting definitions, eight new system definitions are now available in the Analytics smart folder of Signals One configuration.

These new definitions, which can be enabled or disabled, allow using linear concentrations of agonists or antagonists with either raw or normalized signal.

SAR & Decisioning

Image 12 from What's New 26.8.docx

Use Insights to query, generate, and analyze Measurement and SAR Tables directly in Signals is available to all systems

Image 13 from What's New 26.8.docx
Image 14 from What's New 26.8.docx

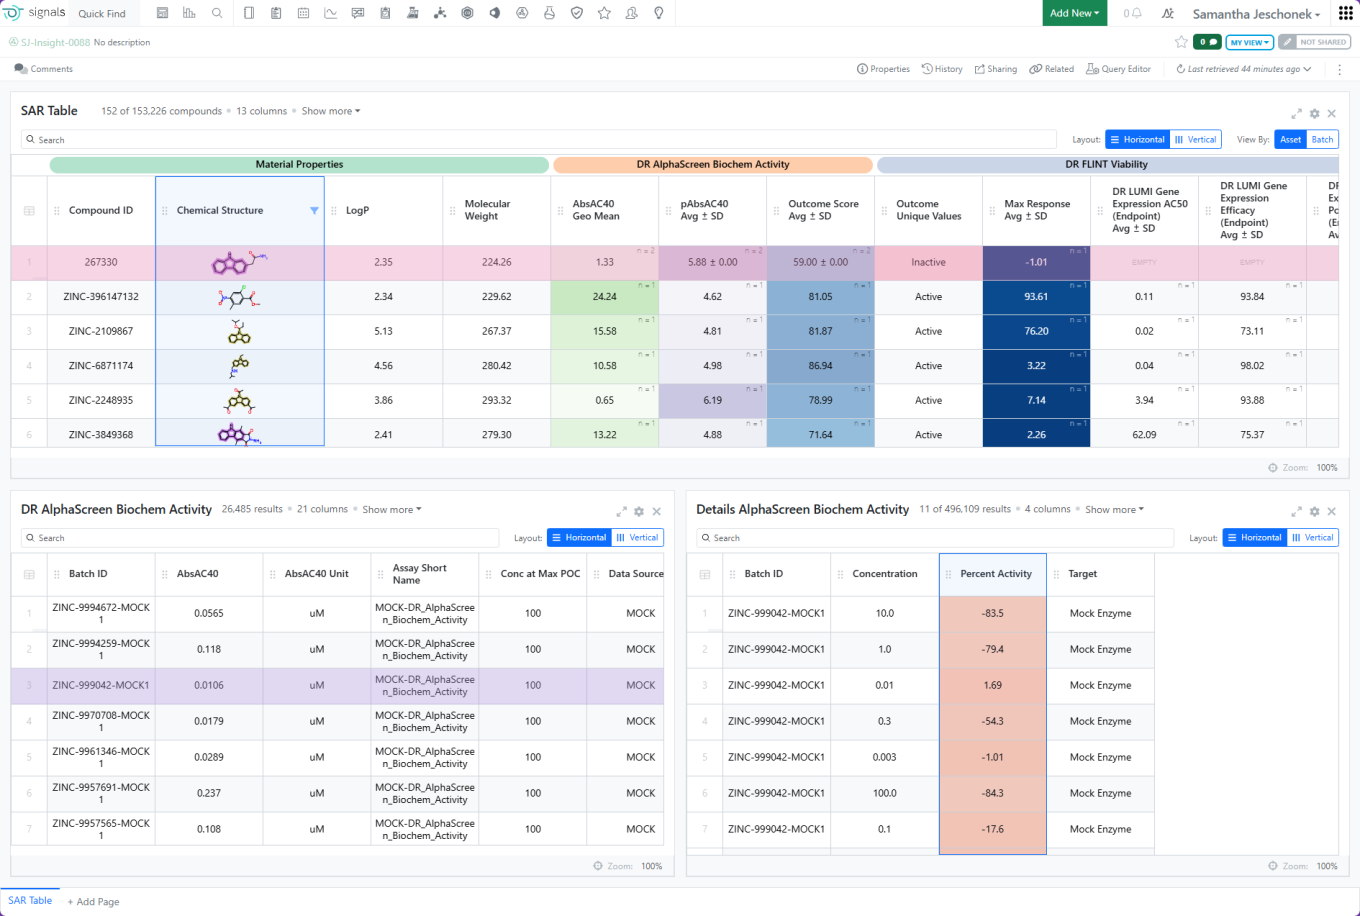
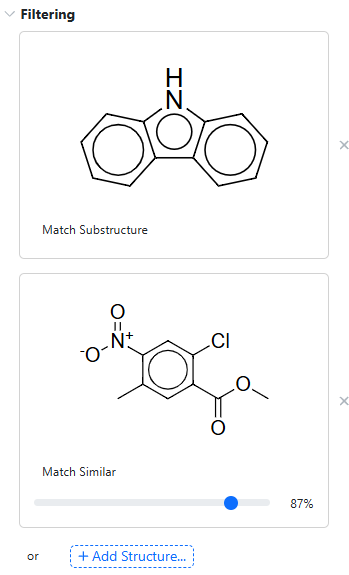
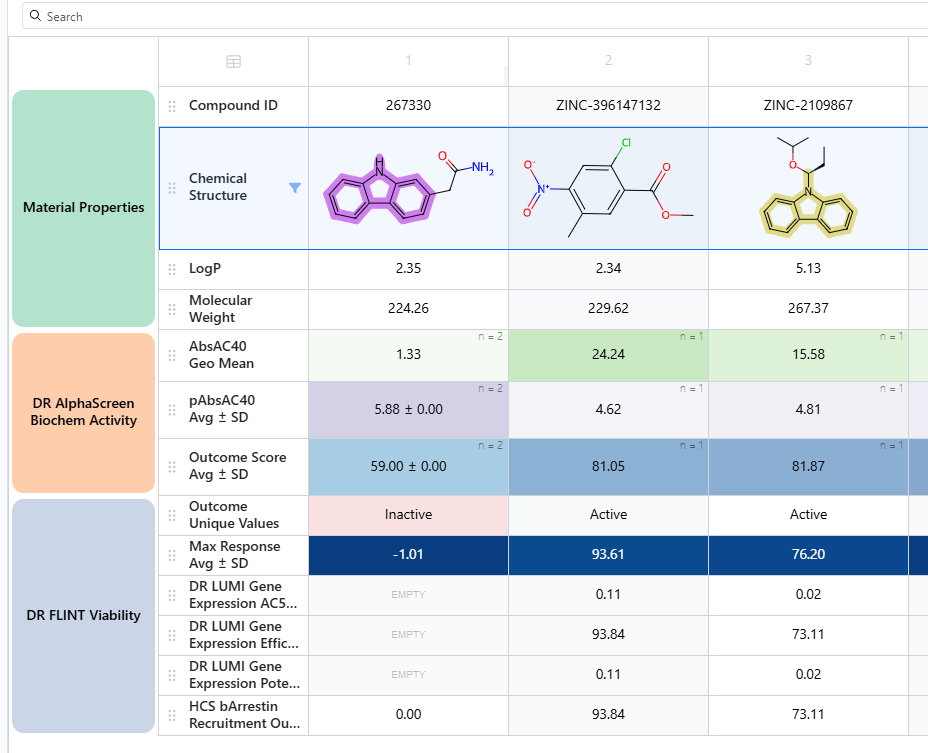
Insights now supports advanced chemical filtering within SAR and Measurement Tables, including substructure, similarity, exact, full-structure, and tautomer matching. Multiple filters can be combined to refine results, while chemical fragment highlighting provides additional context during analysis. A cleaner default SAR table layout helps users focus on key endpoints, with additional data available through table configuration options.

Image 15 from What's New 26.8.docx
Image 16 from What's New 26.8.docx
Image 17 from What's New 26.8.docx
Image 18 from What's New 26.8.docx
Image 19 from What's New 26.8.docx
Image 20 from What's New 26.8.docx
Image 21 from What's New 26.8.docx
Image 22 from What's New 26.8.docx

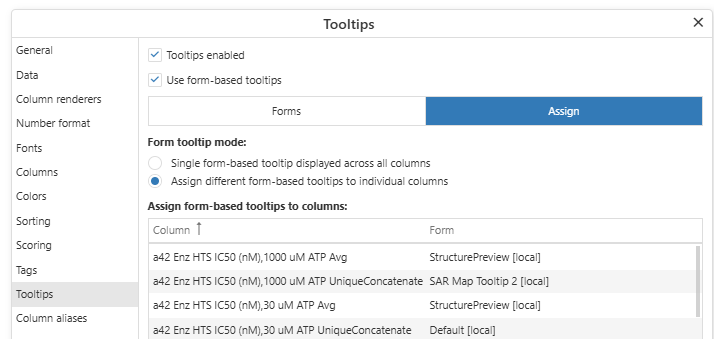
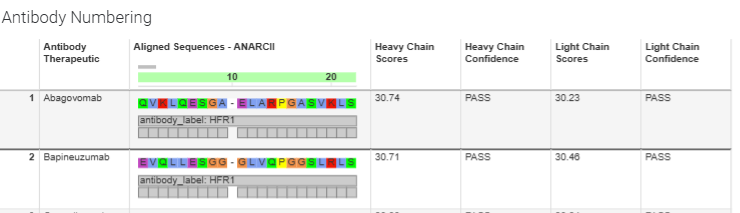
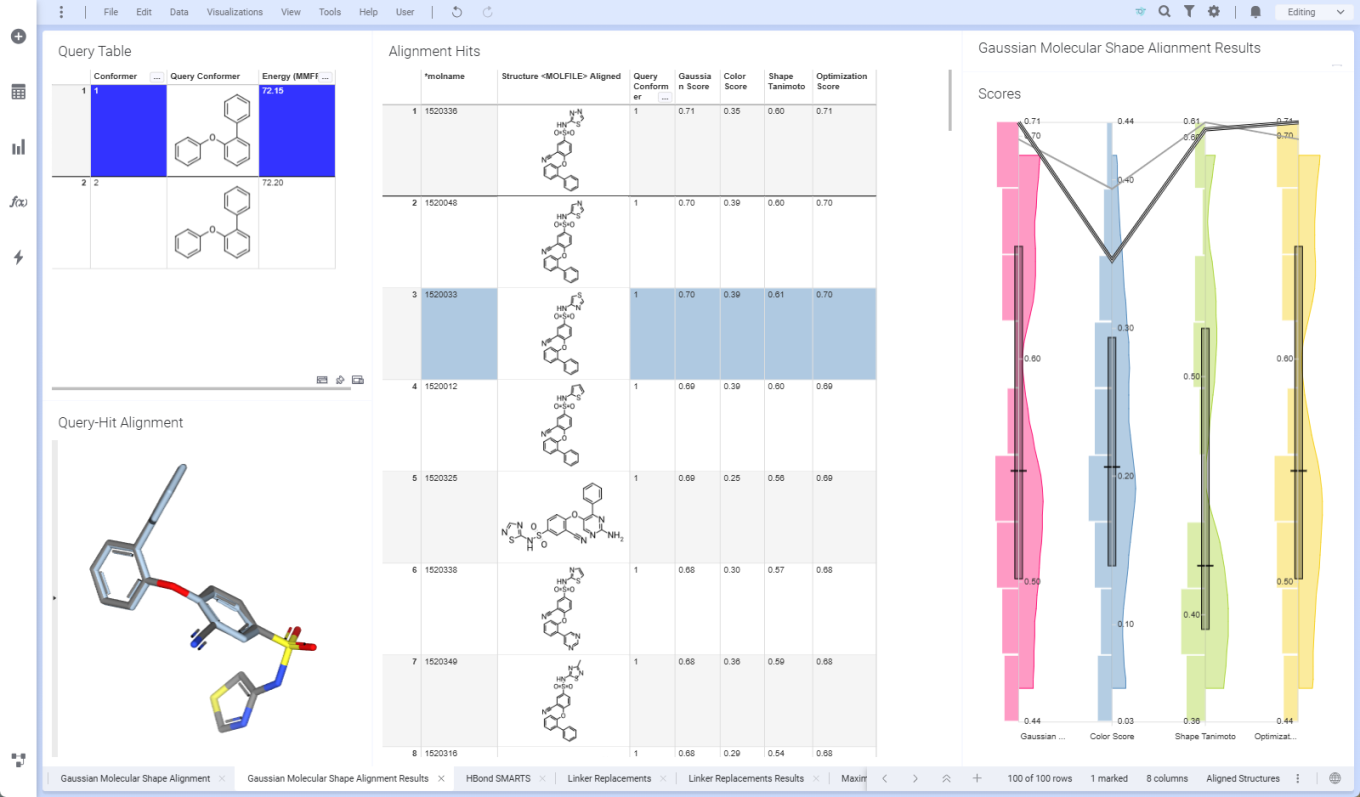
ChemCharts introduces new data functions for antibody engineering and molecular alignment, along with visualization enhancements such as visual cloning and per-column form tooltips.

ChemCharts now supports assigning different form-based tooltips to individual columns, providing greater control over the contextual information displayed throughout a visualization. New visual cloning capabilities also make it easier to duplicate and adapt existing visualizations.​

The Antibody Numbering data function now supports ANARCII and can return prediction scores and confidence values for heavy and light chains.​

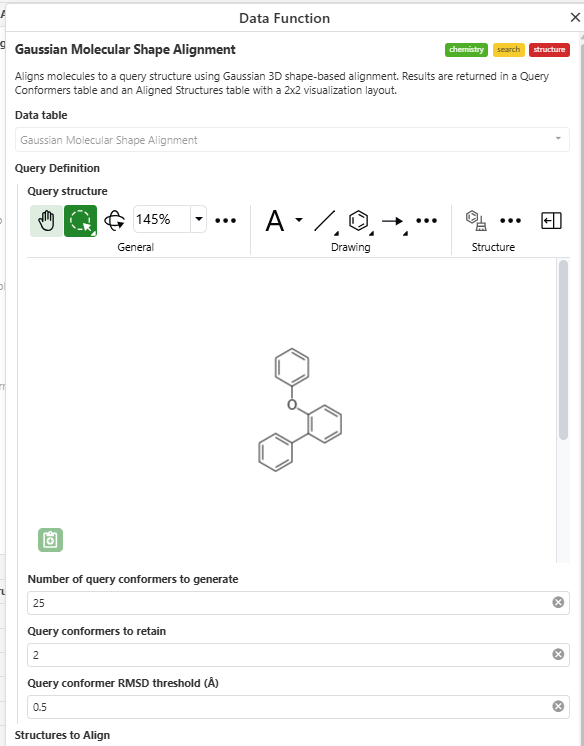
The Gaussian Molecular Shape Alignment data function aligns small molecules to a query structure using Gaussian 3D shape-based alignment. Results are returned in Query Conformers and Aligned Structures tables and can be explored using the Molecule Viewer.​

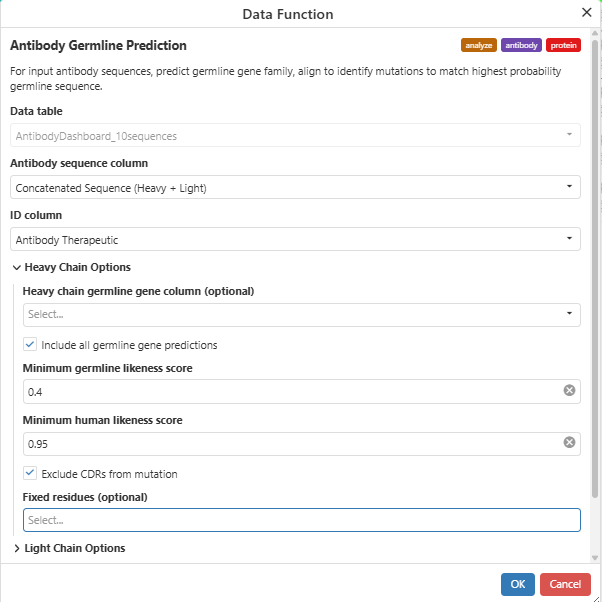
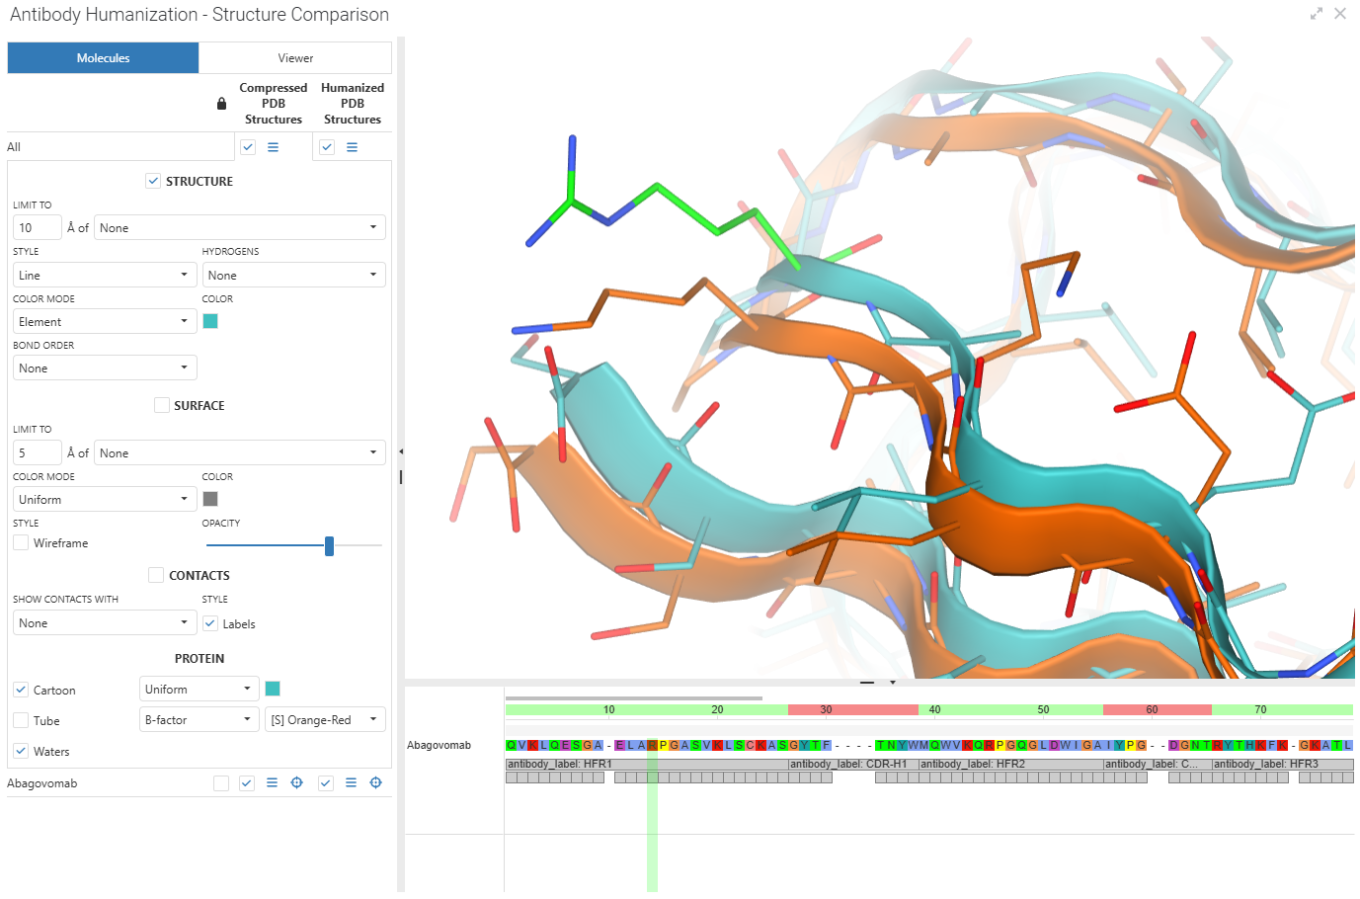
The Antibody Germline Prediction and Antibody Humanization data functions support complementary antibody engineering workflows. Germline Prediction identifies the most likely germline gene families for heavy and light chains and aligns sequences to identify mutations relative to the highest-probability germline sequence. Humanization then suggests sequence changes intended to improve predicted human-likeness while maintaining antibody chain pairing characteristics. When used with the Biomolecule Viewer, users can compare the original and predicted humanized structures.

Synergy

Image 23 from What's New 26.8.docx

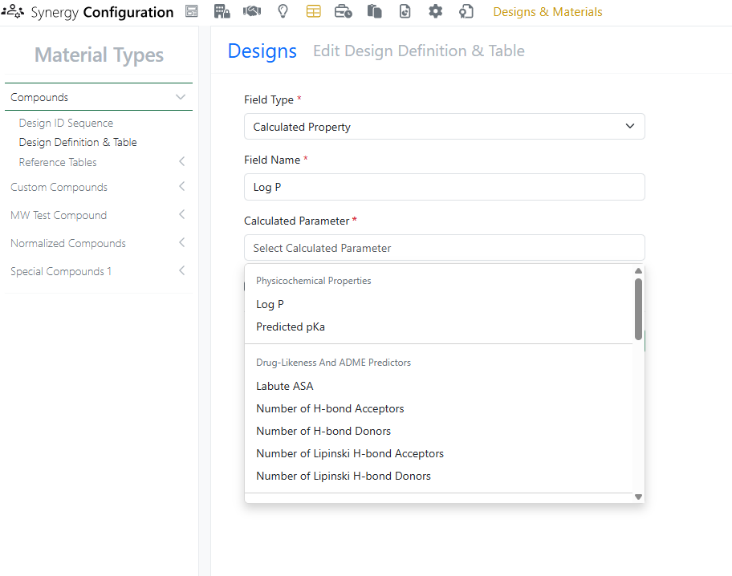
Release 26.8 brings several updates to Synergy Designs. First, calculated properties, including a variety of physicochemical properties (e.g., Log P, predicted pKa), drug-likeness and ADME predictors (e.g, Labute ASA, Lipinski H-bond acceptors), structure and topology, ring system, atomic composition, and stereochemistry calculations, are now available for Synergy Designs. Administrators can selectively configure which properties to include in each library’s Designs Definition and Design Tables in Synergy Configuration by adding a new field and selecting Calculated Property.

Image 24 from What's New 26.8.docx

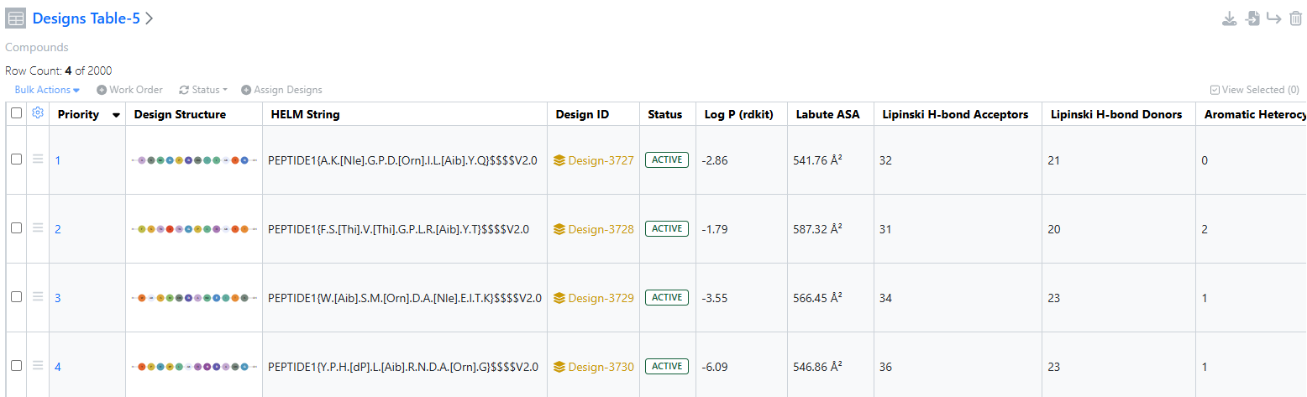
When new Designs are created, properties are automatically calculated and represented on the Design.

Image 25 from What's New 26.8.docx
Image 26 from What's New 26.8.docx
Image 27 from What's New 26.8.docx

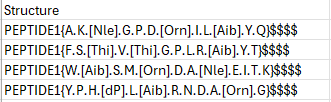
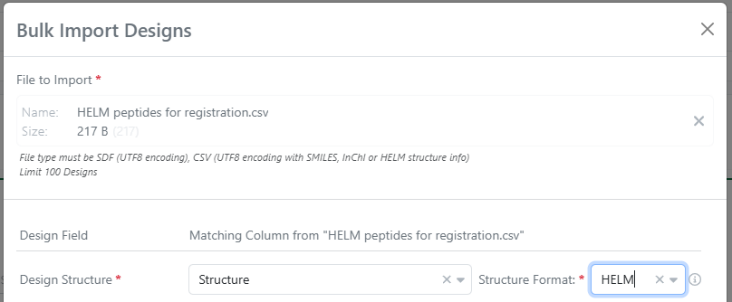
In this release, bulk Import Designs to Designs Table now supports CSV files with HELM notation. Note that Designs already support HELM notation; this is an expansion of the import file CSV file support.

Image 28 from What's New 26.8.docx

Currently, Synergy Experiment properties can be configured to inherit property values from the parent Collaboration or associated Work Order. In 26.8, we extended this feature to Work Orders. Work Order Template attribute list fields can be configured to inherit a corresponding property value from the parent Collaboration. If a field is set to inherit from the Collaboration, the Work Order field will automatically populate with the corresponding value from the parent Collaboration at creation. As a result, the Sponsor user does not have to repeatedly populate the same property, such as Project Code or Disease Target, even when this property is Hidden from CRO.

Image 29 from What's New 26.8.docx

Similar to Sponsor users, CRO users can now Print to PDF their Synergy Experiments. As always, Hidden from CRO metadata is excluded from the print PDF functionality for CROs.

Image 30 from What's New 26.8.docx

Sponsor users can receive an in-app or email notification when a CRO user puts a Work Order On Hold.

Image 31 from What's New 26.8.docx

Sponsor Administrators can view visual granular change comparisons for fields in Synergy Design tables in the audit trial. When enabling the “View granular changes” toggle, field updates are clearly highlighted: green indicates newly added data, a green dashboard boarder denotes modified data, and gray represents removed entries. Use cases addressed include adding a new field to a Design, updating or clearing field values, renaming a field header, removing a field or reordering columns. Note: Design Structure previews are not supported by this tool.

Tables

Image 32 from What's New 26.8.docx

Configuration administrators can now define default values for Headers and Properties in Admin Defined Tables, Variation Tables and Hierarchical Tables. Default values can be set for all appropriate property types.

Image 33 from What's New 26.8.docx

The Mean can now be displayed in Box Plots. The Configuration Administrator, or optionally the end user, can set if the Mean is displayed or not, and define the color, line style and line thickness.

Image 34 from What's New 26.8.docx

Reference Lines can be displayed on numerical axes of charts. Lines can be set to be either a fixed value or at a calculated aggregate of a numerical column. The configuration administrator, or optionally end user, can define the line color, style and thickness, and the label display, for the reference lines.

Image 35 from What's New 26.8.docx

Graphing has also been extended to Variation Tables. All included chart types, namely Scatter Plots, Bar Charts, Bar Charts and Box Plots can be configured on Variation Table Templates. The Variant Name can be used as a categorical property, such as to Trellis By.

Plates

Image 36 from What's New 26.8.docx

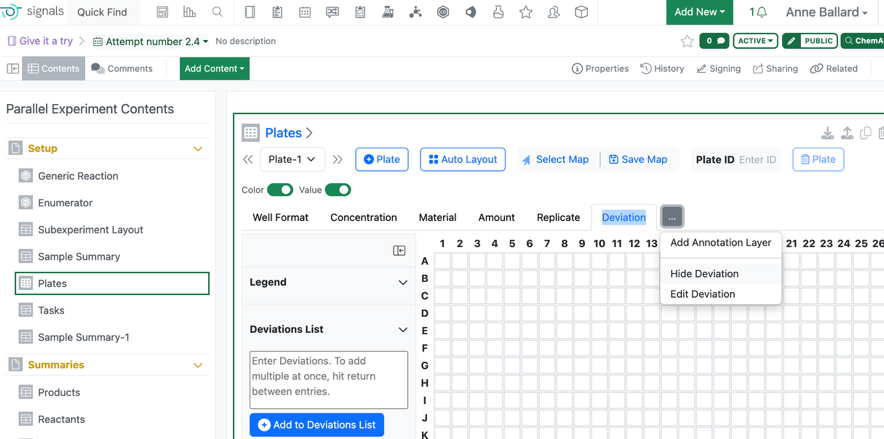
When users Hide an Annotation layer in the plate, the corresponding column in the Plate table is also hidden. This will not alter the data stored on the plate.

Inventory

Image 37 from What's New 26.8.docx

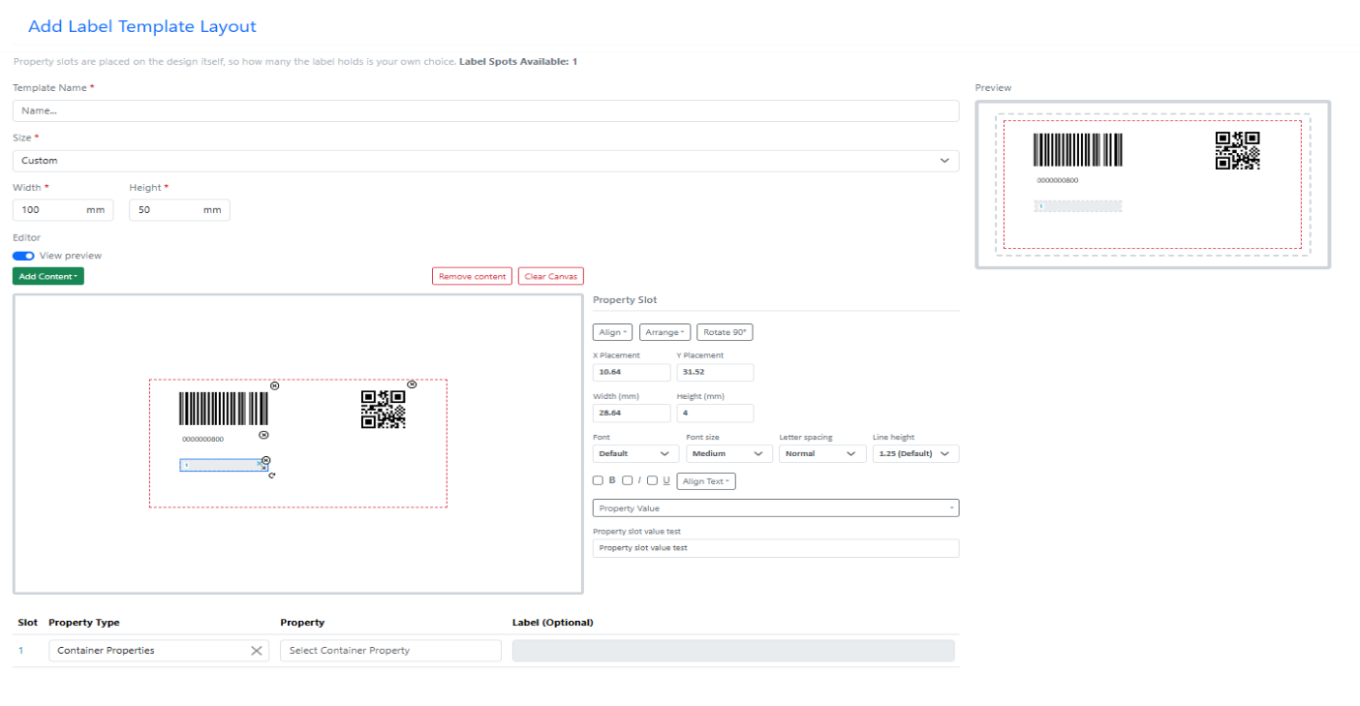
Create and customise inventory label templates by defining label sizes, selecting displayed fields, positioning content, and configuring formatting options such as fonts, barcodes, and QR codes to meet site-specific labelling requirements.

Image 38 from What's New 26.8.docx

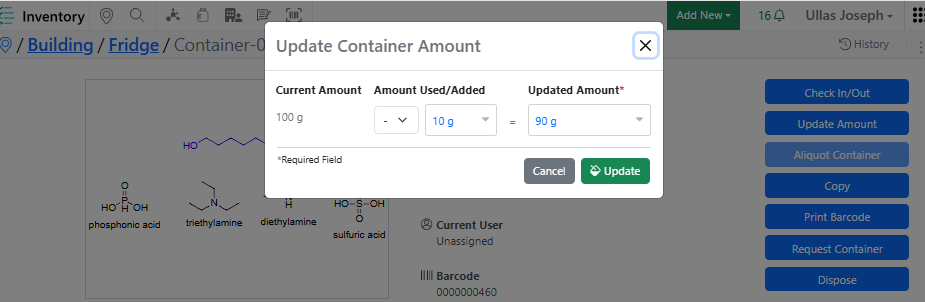
Enter the amount consumed directly during inventory updates. The system automatically deducts the consumed quantity and displays the remaining balance, simplifying inventory consumption tracking.

Image 39 from What's New 26.8.docx
Image 40 from What's New 26.8.docx

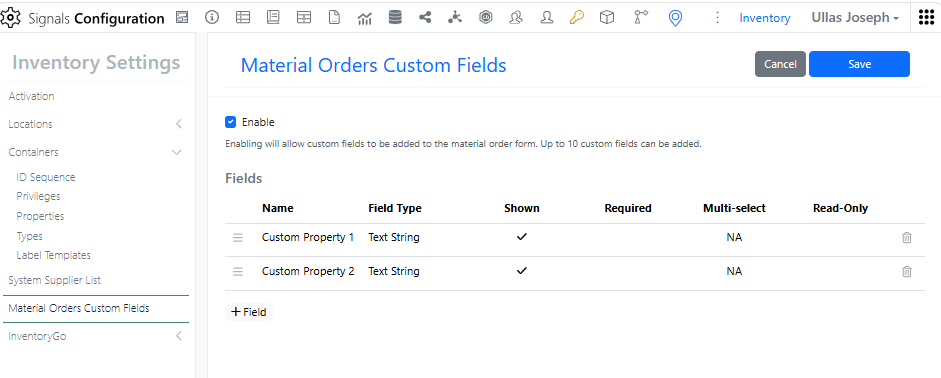
Configure custom fields for material orders and capture additional information tailored to your organization’s procurement and inventory workflows.

Image 41 from What's New 26.8.docx

When searching for items in Quick Add (via barcode scan, container ID, material name, or sample search), the system now automatically selects the item and bypasses the search
modal whenever a single match is found, eliminating unnecessary dialogs and clicks.

Image 42 from What's New 26.8.docx

To maintain location hierarchy integrity and prevent configuration conflicts, the system now validates grid cells before sub-location creation. Users are prevented from converting any grid cell that is already assigned as a container’s Home Location into a Grid-type sub-location.

Image 43 from What's New 26.8.docx
Image 44 from What's New 26.8.docx

New Container Label Templates - 50 x 30 mm(QR Code) and 50 x 30 mm(4 slots)

Image 45 from What's New 26.8.docx

Container search results now display reconciliation and rectification details, providing greater visibility into inventory status and recent inventory adjustments.

InventoryGo

Image 46 from What's New 26.8.docx

Scan barcodes and QR codes directly using your device’s camera, enabling faster identification and management of inventory items without dedicated scanning hardware.

Materials

Image 47 from What's New 26.8.docx

Materials tables within an experiment can now be updated in bulk to reflect the latest material changes. Users can now select multiple rows that contain stale data and update them in one action.

Image 48 from What's New 26.8.docx

A new calculated property in Compounds and Normalized Compounds libraries and the pre-configured Reagents (SNB) library is available to generate a HELM string of the structure drawn in the ChemDraw canvas.

Administration

Image 49 from What's New 26.8.docx
Image 50 from What's New 26.8.docx
Image 51 from What's New 26.8.docx
Image 52 from What's New 26.8.docx

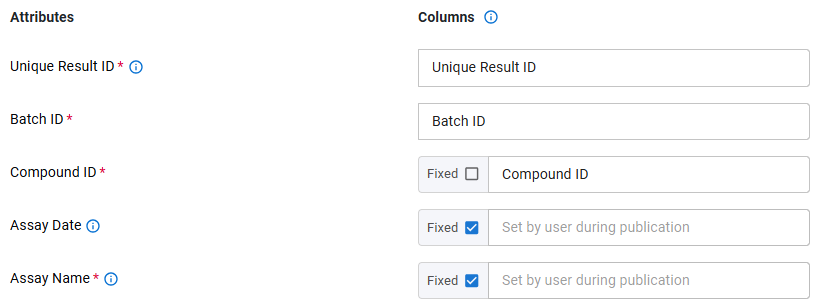
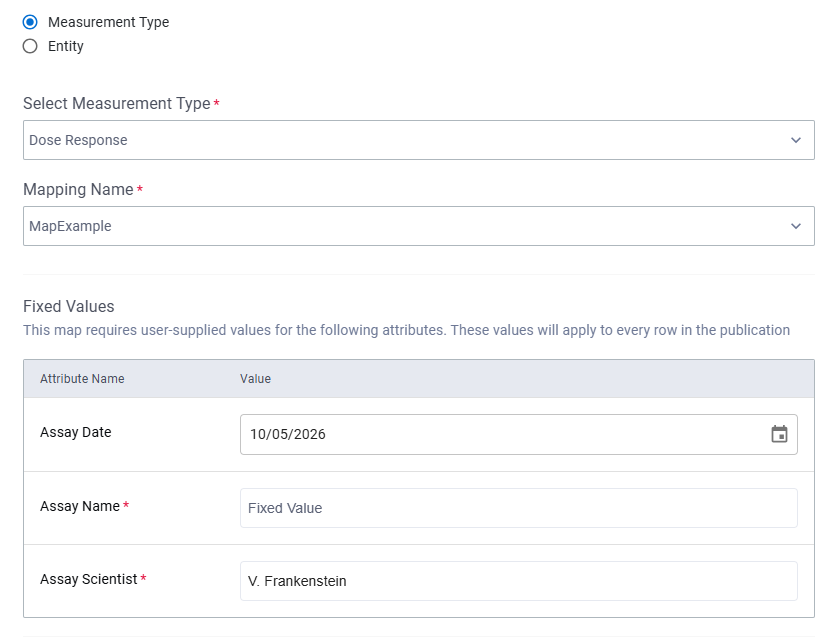
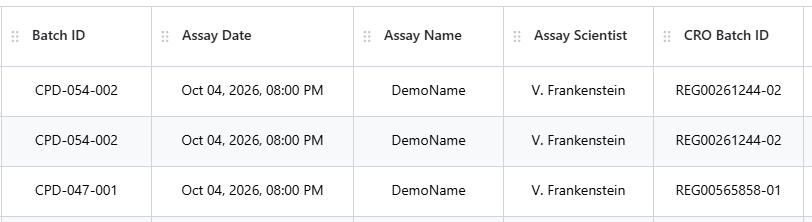
Data Factory file maps now allow user to supply a constant value when publishing data via the Inventa Dashboard or Publish Results to Data Factory app. Administrators can enable the “Fixed” value from an Entity or Measurement Type map from the Data Factory configuration. When users select this map during publication either via the Inventa Dashboard or the Publish Results to Data Factory app they are prompted to enter a value. This value will appear on every row for that column in the publication.

Integrations & APIs

Image 53 from What's New 26.8.docx

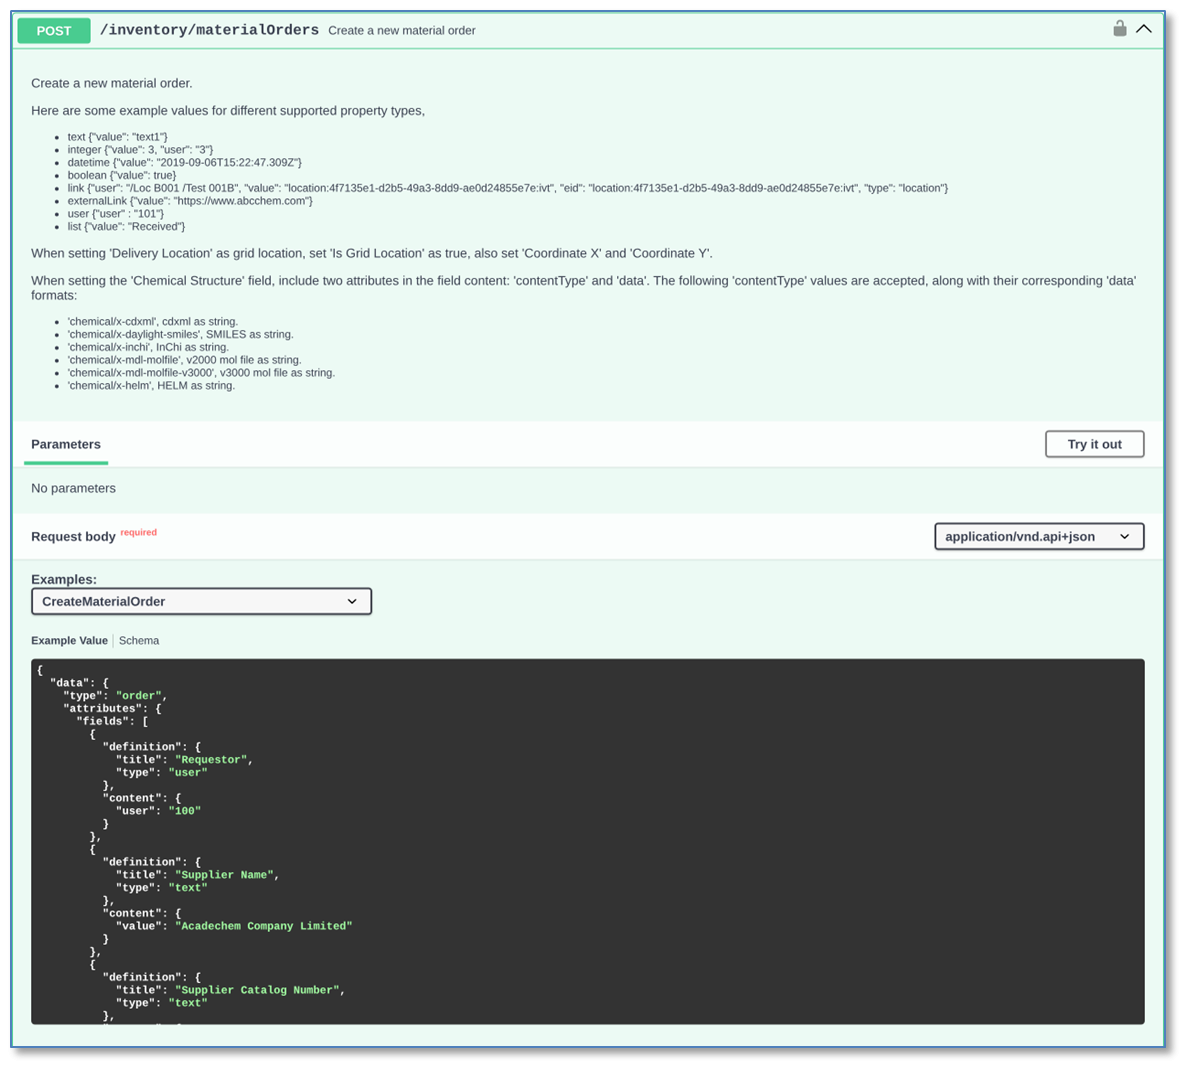
We have added a new API to create material orders (POST /inventory/materialOrders). The request sets the order fields, for example Requestor, Supplier Name, Supplier Catalog Number, Destination Location and Status. The Destination Location can be a grid location. The Chemical Structure field accepts CDXML, SMILES, InChI, MOL V2000, MOL V3000 and HELM.

Image 54 from What's New 26.8.docx

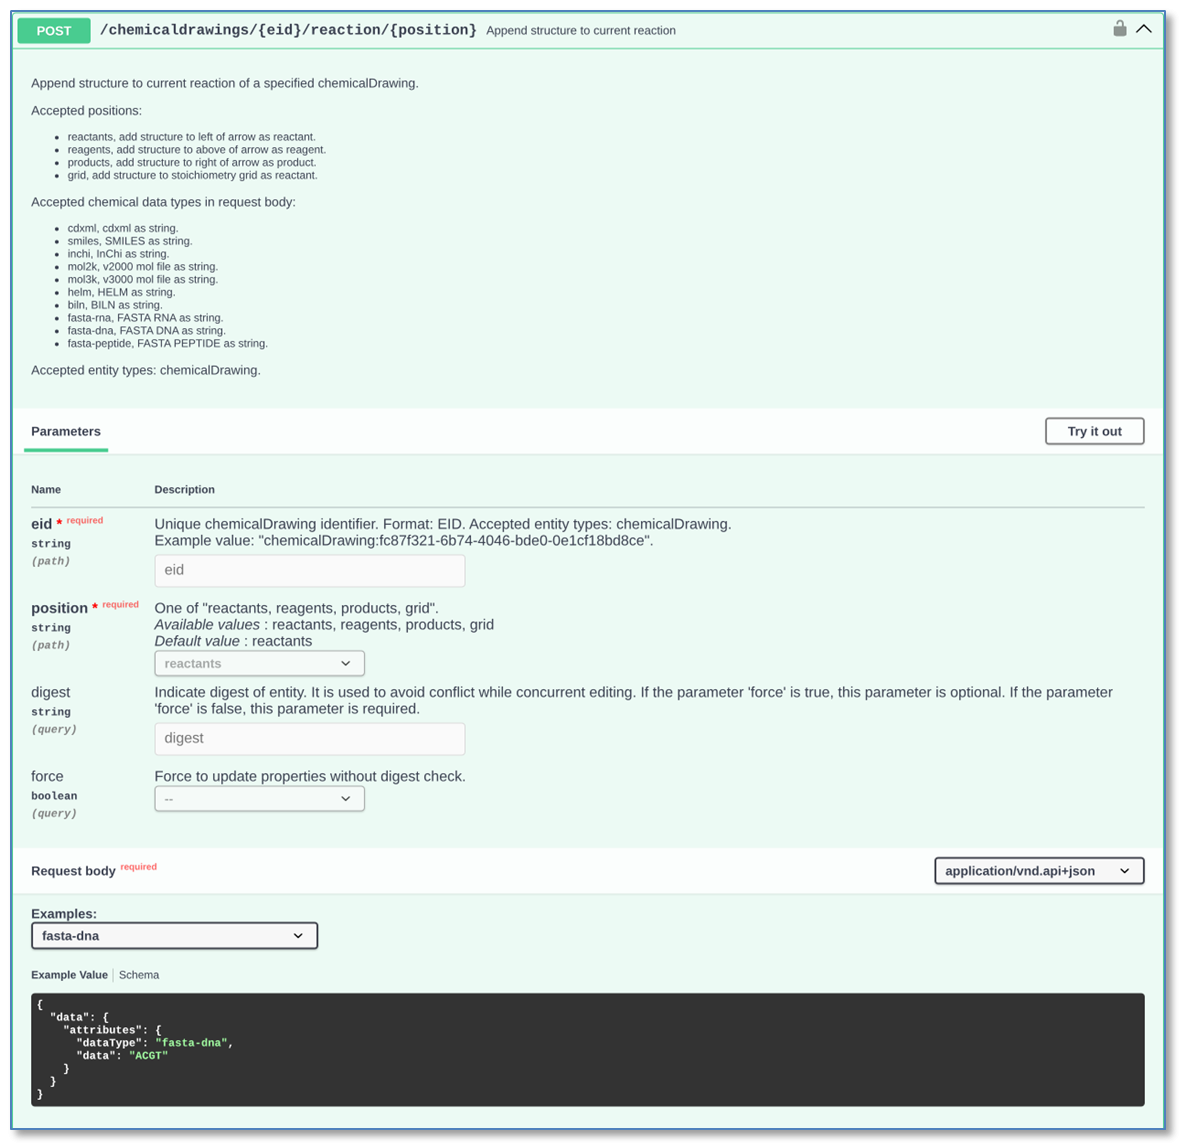
We have enhanced the Chemical Drawing APIs to support FASTA sequences. The API to append a structure to a reaction (POST /chemicaldrawings/{eid}/reaction/{position}) now accepts the data types “fasta-dna”, “fasta-rna” and “fasta-peptide”.

Image 55 from What's New 26.8.docx

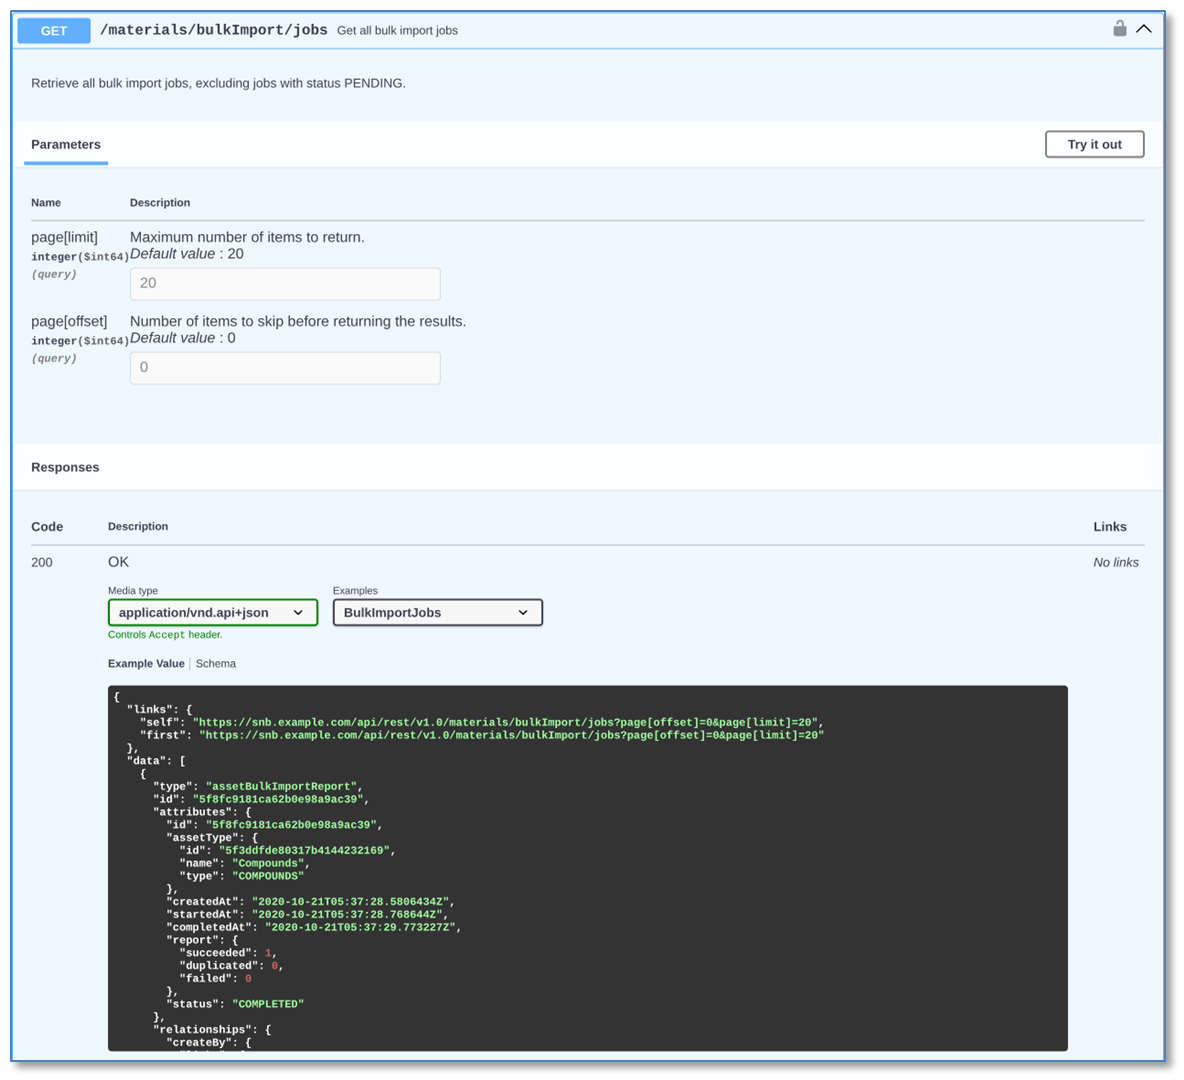
We have added new APIs to fetch the reports of all material bulk import, bulk export and bulk update jobs (GET /materials/bulkImport/jobs, /materials/bulkExport/jobs and /materials/bulkUpdate/jobs). Each API returns a paged list of jobs with their status and results.

Beta Features

The following capabilities are in beta and are available for users, administrators and developers on the Signals platform upon request. Please contact your account representative or our support team if you would like access to the following features.

Fundamentals

Image 56 from What's New 26.8.docx
Image 57 from What's New 26.8.docx
Image 58 from What's New 26.8.docx
Image 59 from What's New 26.8.docx
Image 60 from What's New 26.8.docx
Image 62 from What's New 26.8.docx

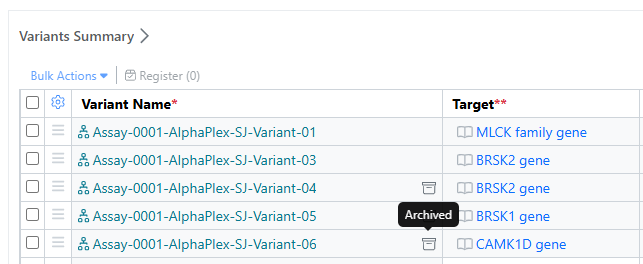
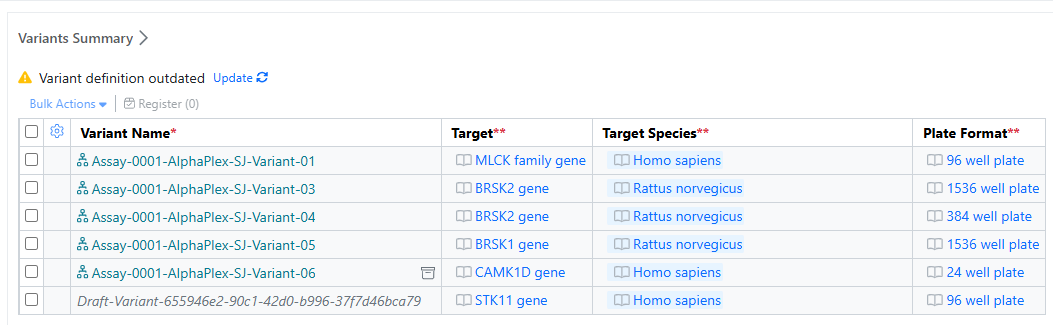
Assays and their Variants now support Archiving. If a Variant is no longer needed for production use, it can be marked as Archived, which will prevent further editing of the Variant, unless it is restored

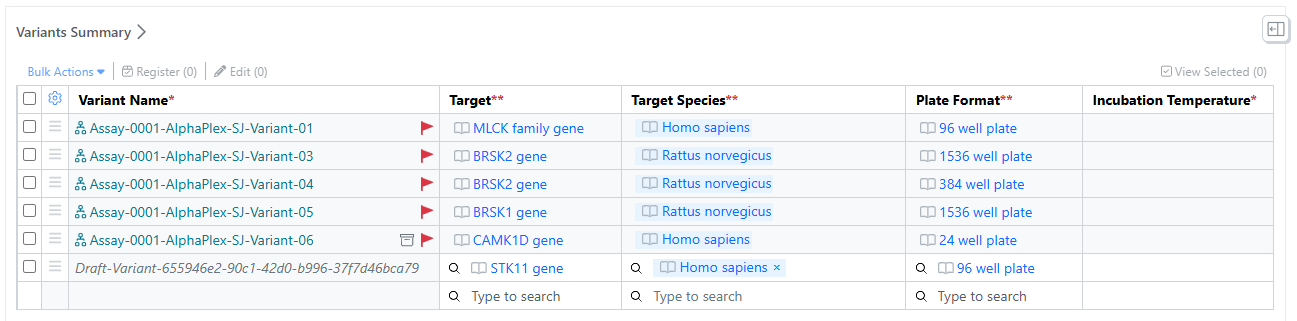
Configuration admins may need to update a Variant template after its in use, for example to add an additional data capture field. When a administrator modifies a template, users will see an outdated message on the Variants Summary table. When they select update, the table will be updated with the latest definition, and the existing Variants checked for compliance with that new definition. Users can individually edit Variants to meet the up dated definition requirements. Assay state and compliance are both searchable fields and clear labels on the Variant. The parent Assay’s state and compliance is automatically updated based on it’s Variants.

ELN Archive

Image 63 from What's New 26.8.docx

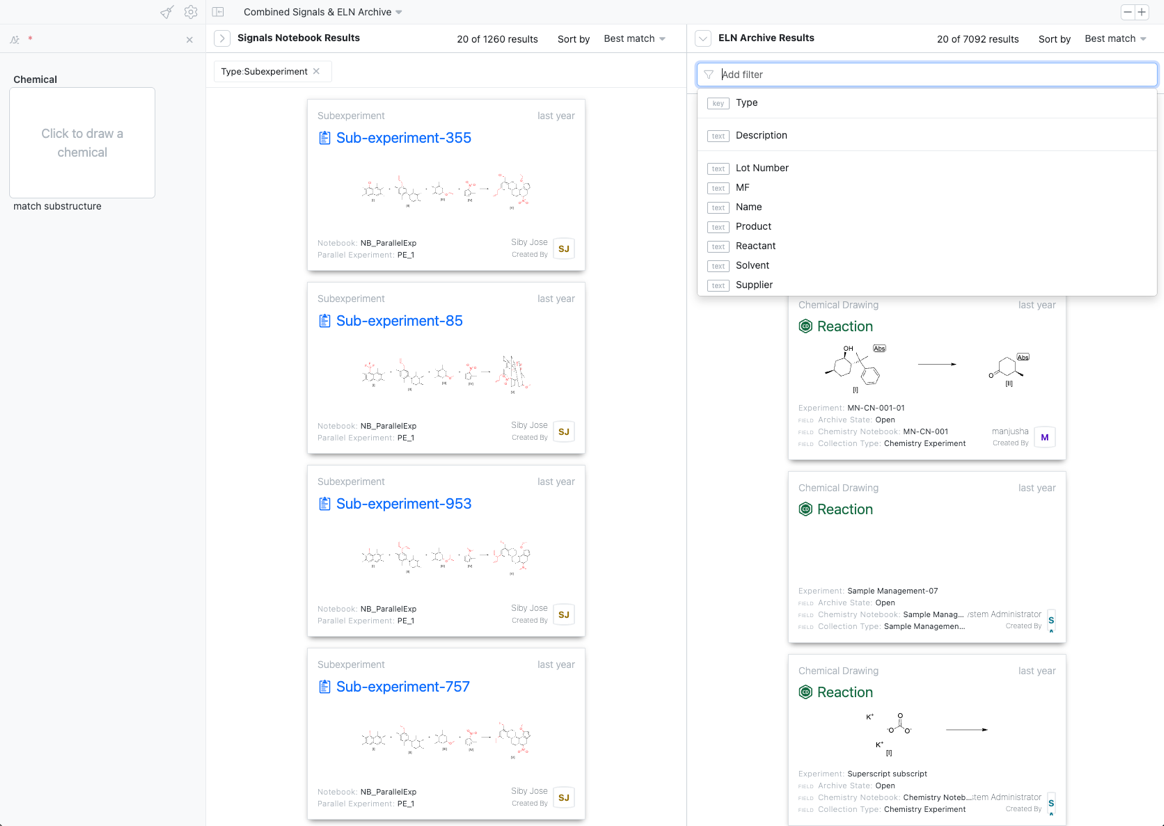
Users can now conduct a simultaneous search across Signals Notebook and ELN Archive content. This search is available via a new combined Source and allows users to query both sets of content by text and chemical structure. Each set of content can be further refined using facets specific to that set of content.

Xynthetica

Image 64 from What's New 26.8.docx
Image 65 from What's New 26.8.docx

Xynthetica now supports a native admin UI.

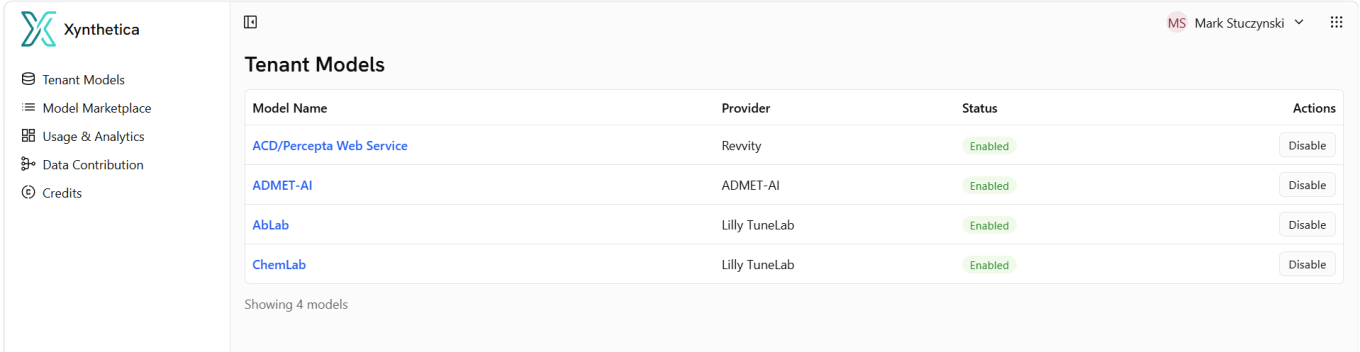
The Tenant Models pane gives the administrator a navigable UI to see details around how their users are leveraging Xynthetica models.

Image 66 from What's New 26.8.docx

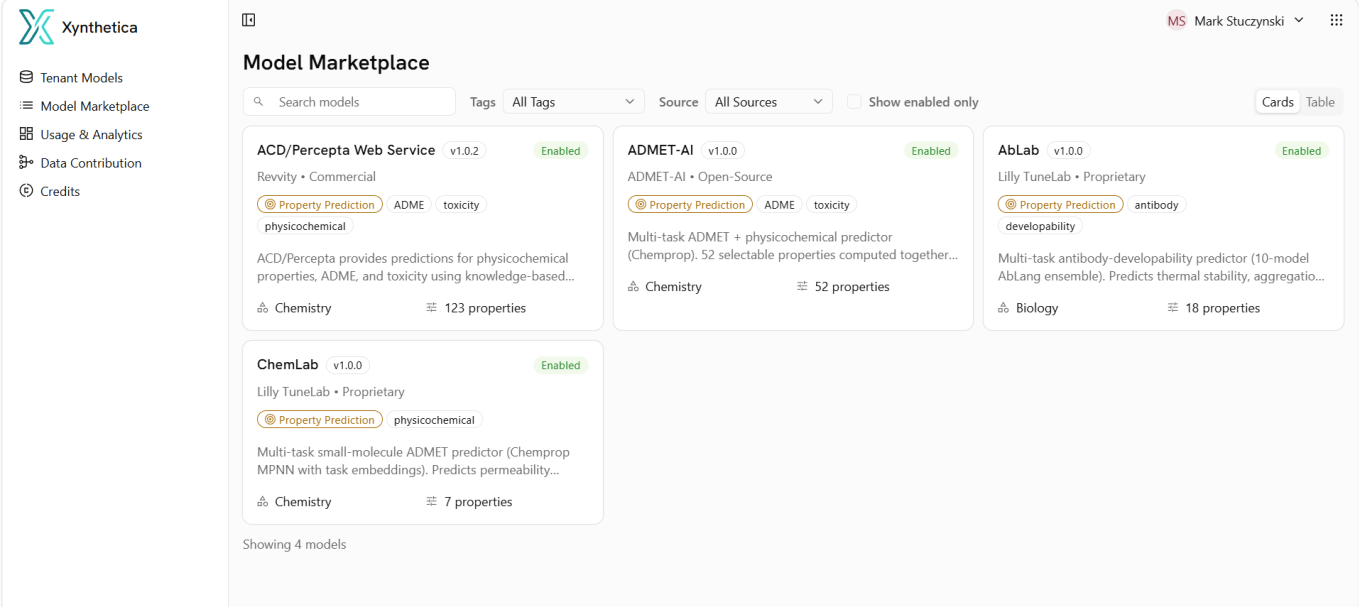
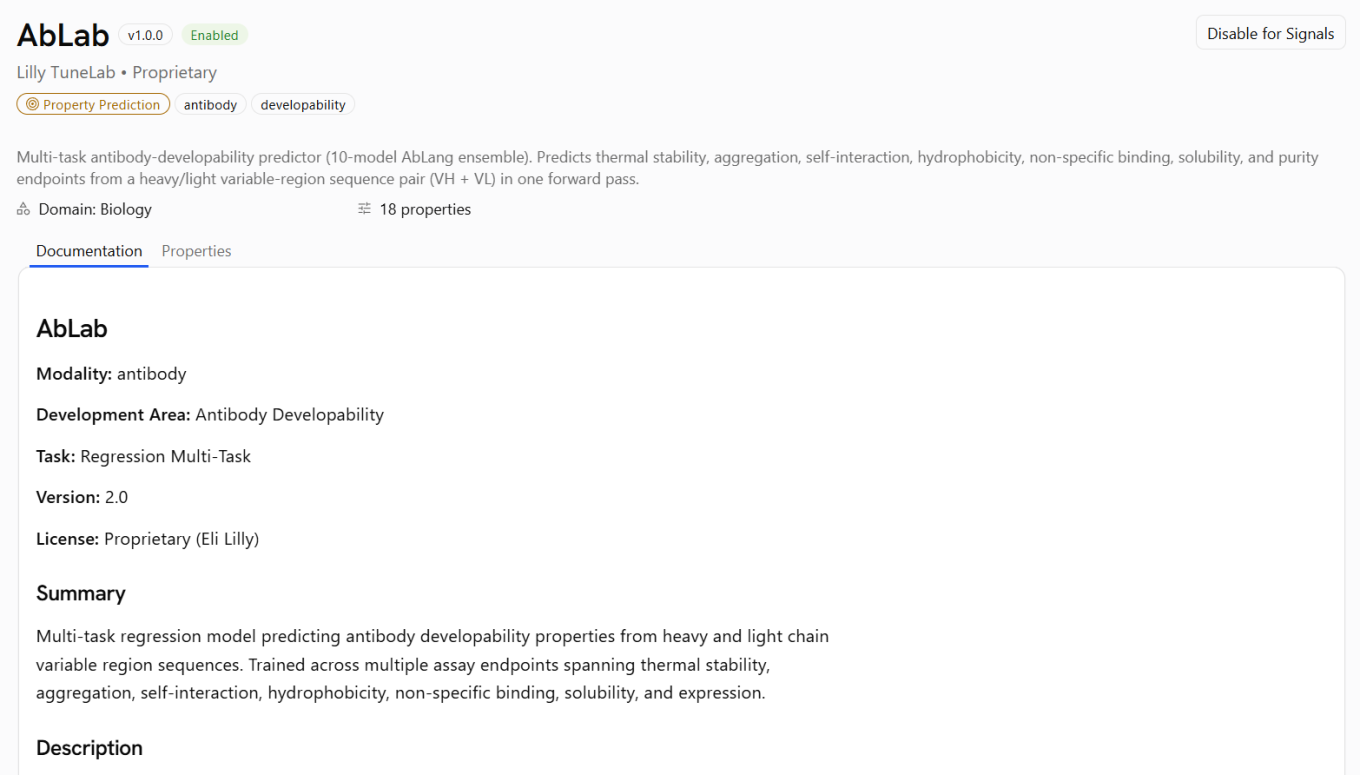
The Model Marketplace is used to gain access to models, and their model card information can be viewed by simply clicking into the relevant model of interest.

Image 67 from What's New 26.8.docx

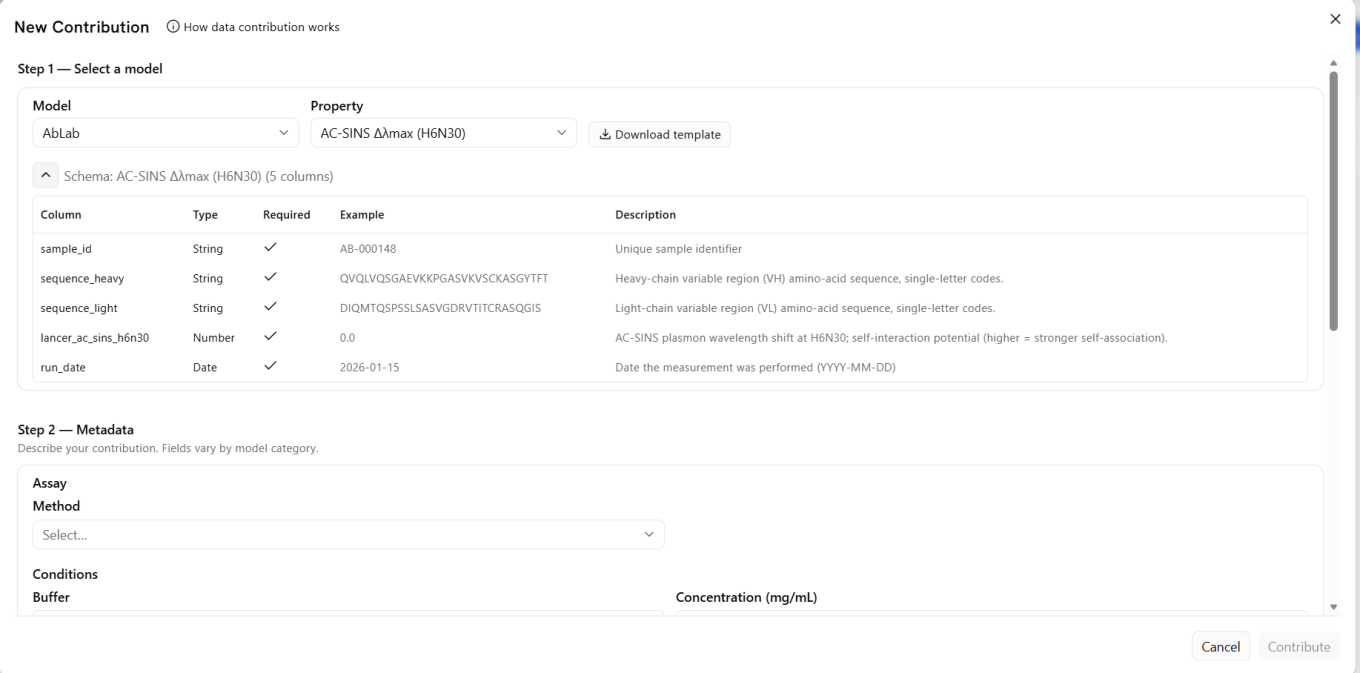
Data Contribution allows users to commit training data to federated models. User selects values of interest and parameter, then submits relevant metadata to improve.

Image 68 from What's New 26.8.docx

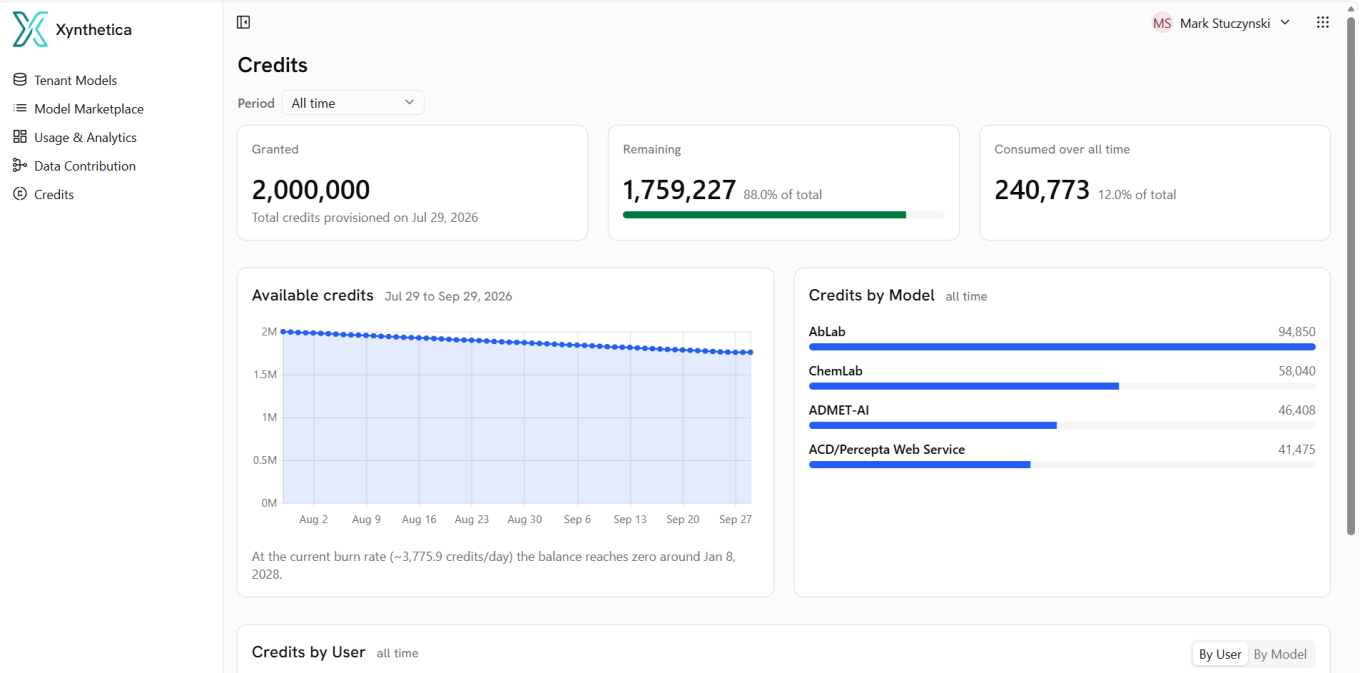
Monitor credit spend in the Credits panel. The Xynthetica-Tunelab bundle includes 2M starter credits.

Formulations

Image 69 from What's New 26.8.docx

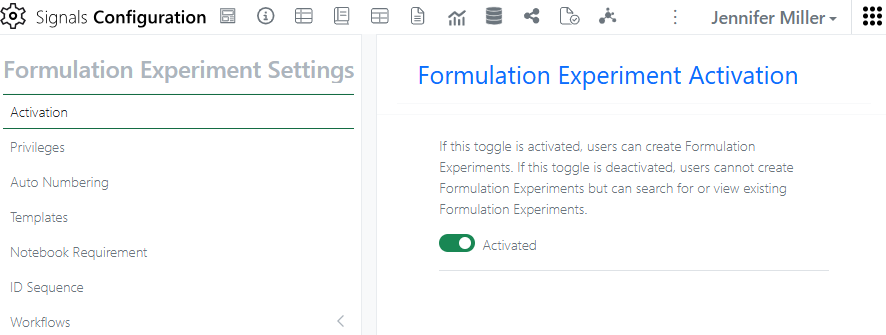
Formulation Development will need some administration set up before it can be used. Activation is in the System Objects à Formulation Experiment:

Image 70 from What's New 26.8.docx

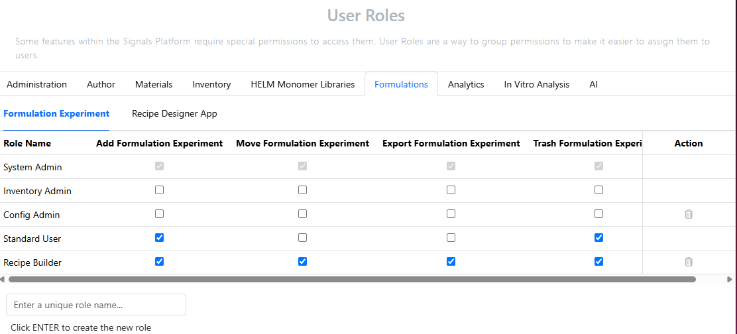
There is only 1 Default System Template currently supported. User Roles has a heading for managing permission to User Roles. Formulation Experiments permissions are for Signals Notebook users:

Image 71 from What's New 26.8.docx

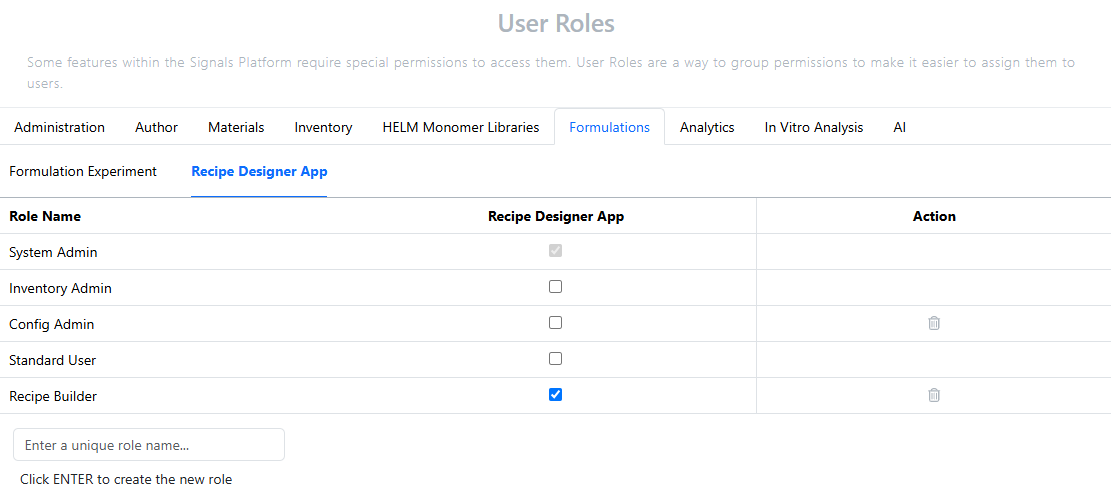
Recipe Designer App is for users that will be creating Parameters, Steps, Recipes and Formulation Experiment Designs:

Image 72 from What's New 26.8.docx

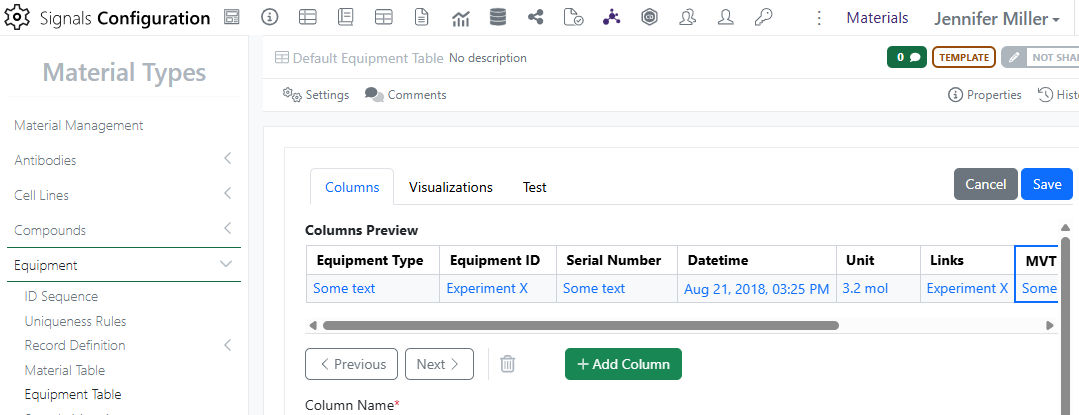
There is a new System Group called Recipe Builders. All Steps, Recipes and Formulations Experiment Designs are automatically shared with the Recipe Builder group by default. The Equipment Table for Formulations can be adjusted in the Material Library:

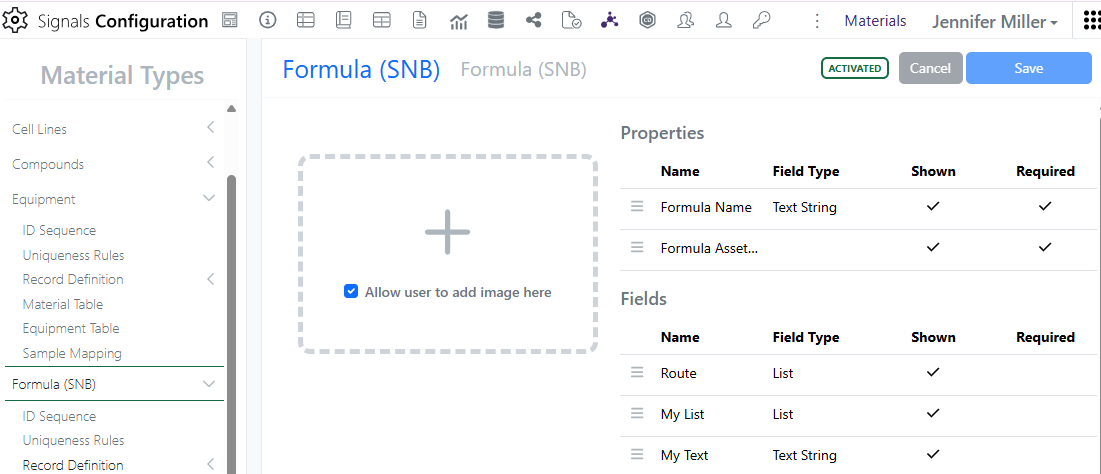
Image 73 from What's New 26.8.docx

A new Material Library called Formula (SNB) has been created and will need to be set up with an ID Sequence, Uniqueness Rule and Record Definition for both the Material and the Batch/Lot, as well as activated:

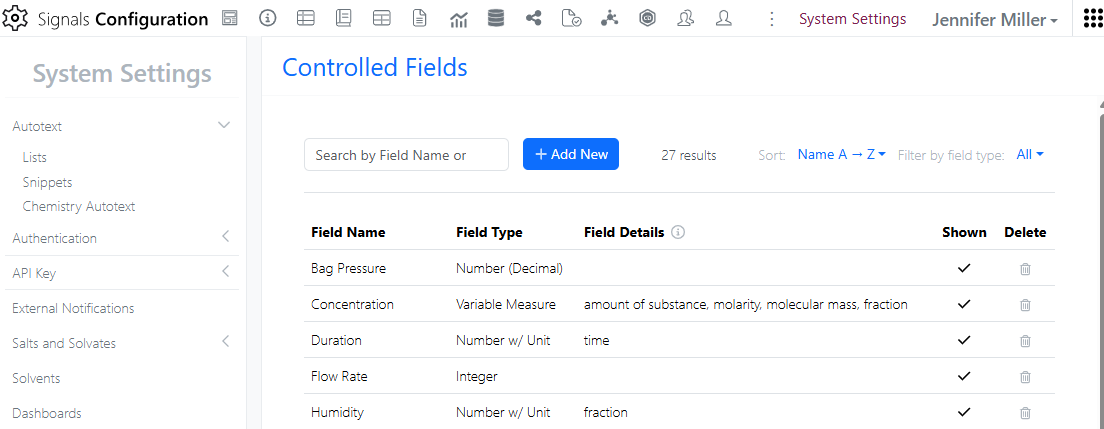
Image 74 from What's New 26.8.docx

Before any parameters can be created, the System Administrator must set up the Controlled Fields in the System Settings in SN Config:

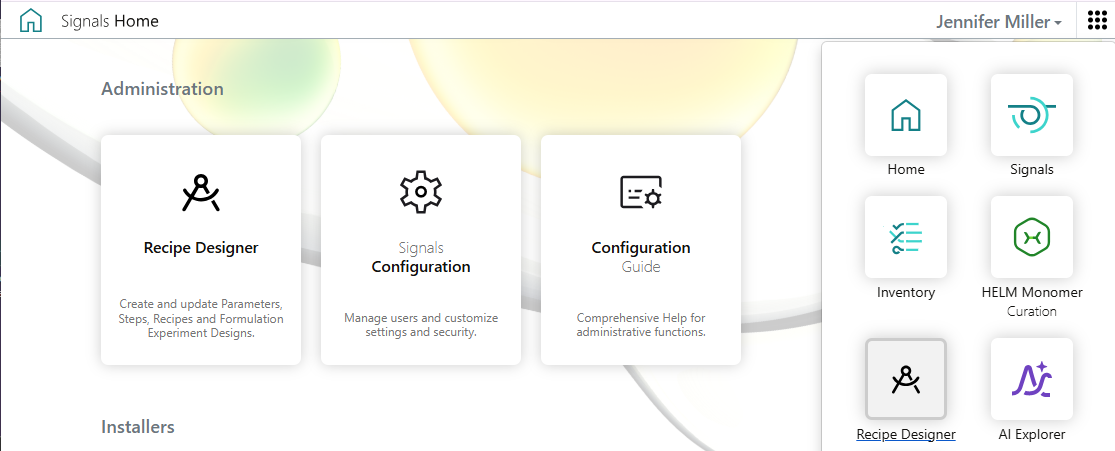
Image 75 from What's New 26.8.docx

Once the above items have been configured, users with the role with Recipe Builder/permissions to the Recipe Designer App can log into the new app from the home page or via the top right navigation:

Image 76 from What's New 26.8.docx

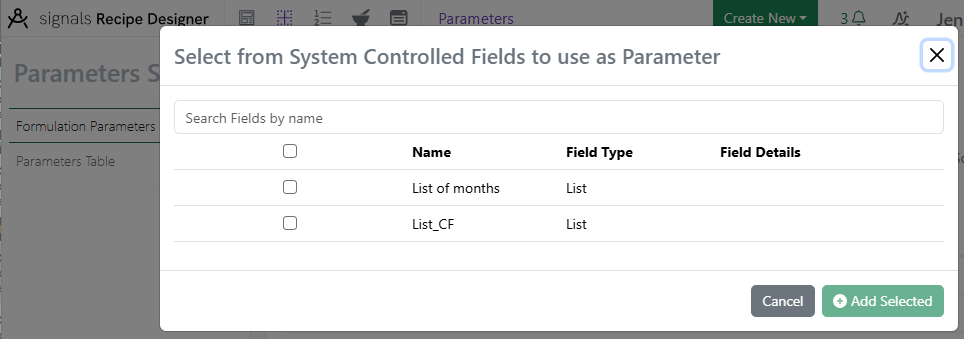
In the Recipe Designer App, users can create Parameters, Steps, Recipes and Formulation Experiment Designs. Parameters are created from the Controlled Fields that the System Administrator has created:

Image 77 from What's New 26.8.docx

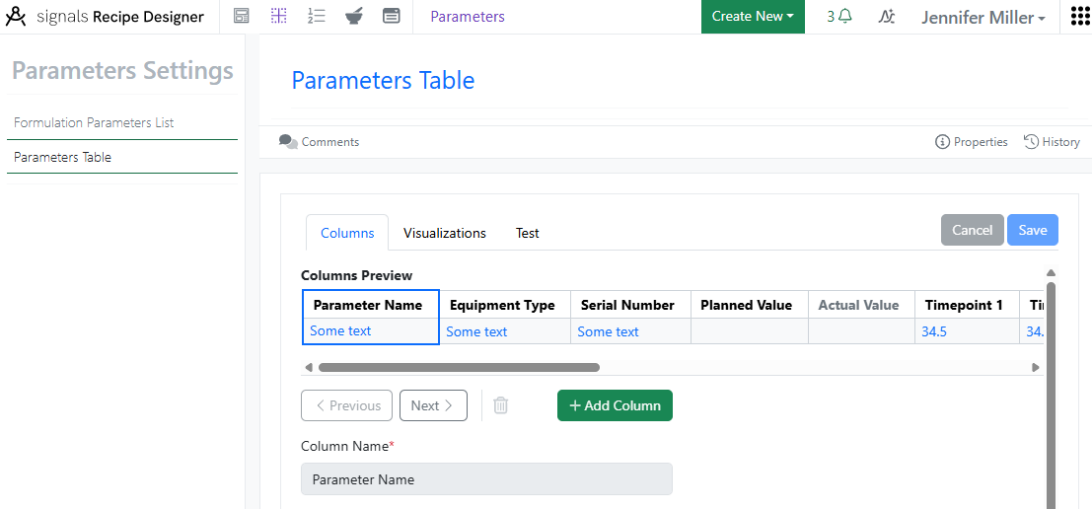
Parameters Table can have additional columns and calculations added to them:

Image 78 from What's New 26.8.docx

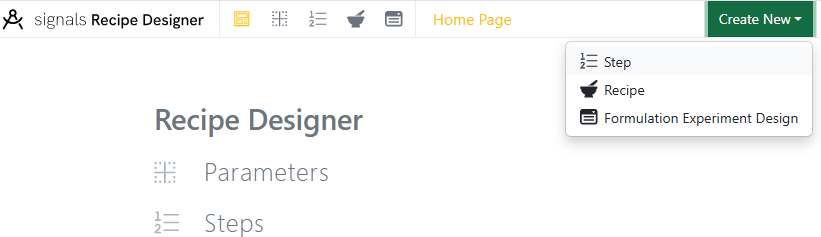
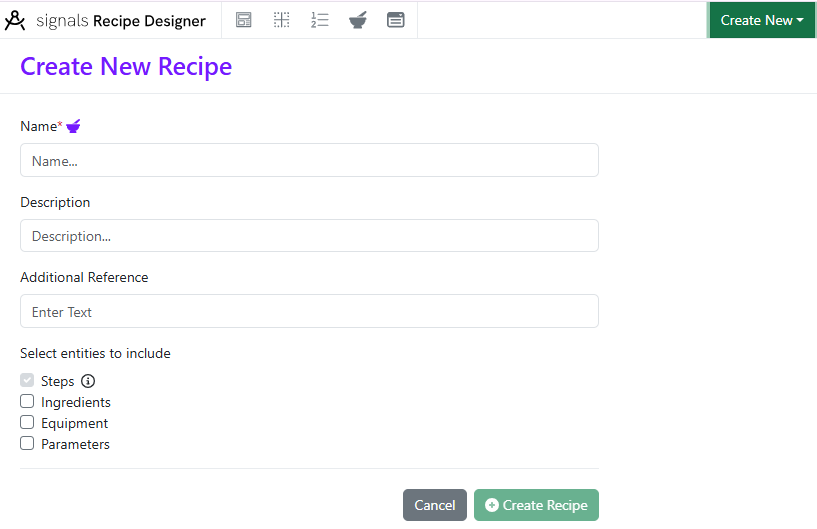
Use the Create New menu to create Steps, Recipes and Formulation Experiment Designs:

Image 79 from What's New 26.8.docx

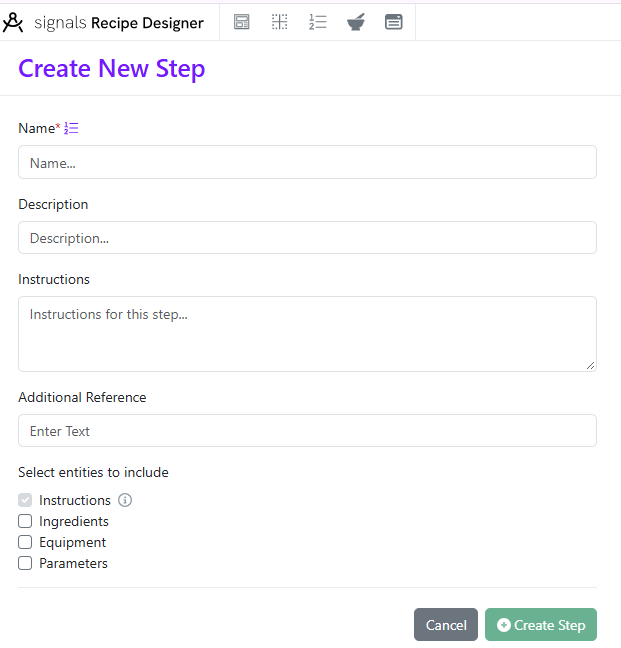
Steps require the Instructions box, but Ingredients, Equipment and Parameters are optional. Steps can be deleted if not used, otherwise they can be retired.

Image 80 from What's New 26.8.docx

Recipes require space for Steps, but Ingredients, Equipment and Parameters are optional. Recipes can be deleted if not used, otherwise they can be retired.

Image 81 from What's New 26.8.docx

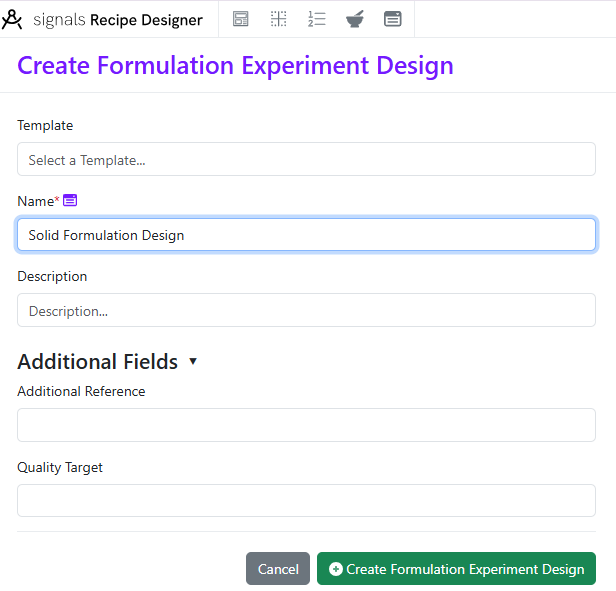
Parameters, Steps and Recipes can be used to create a Formulation Experiment Design. The Formulation Experiment Design acts like a template that Formulators can use to create new Formulation Experiments from.

Image 82 from What's New 26.8.docx

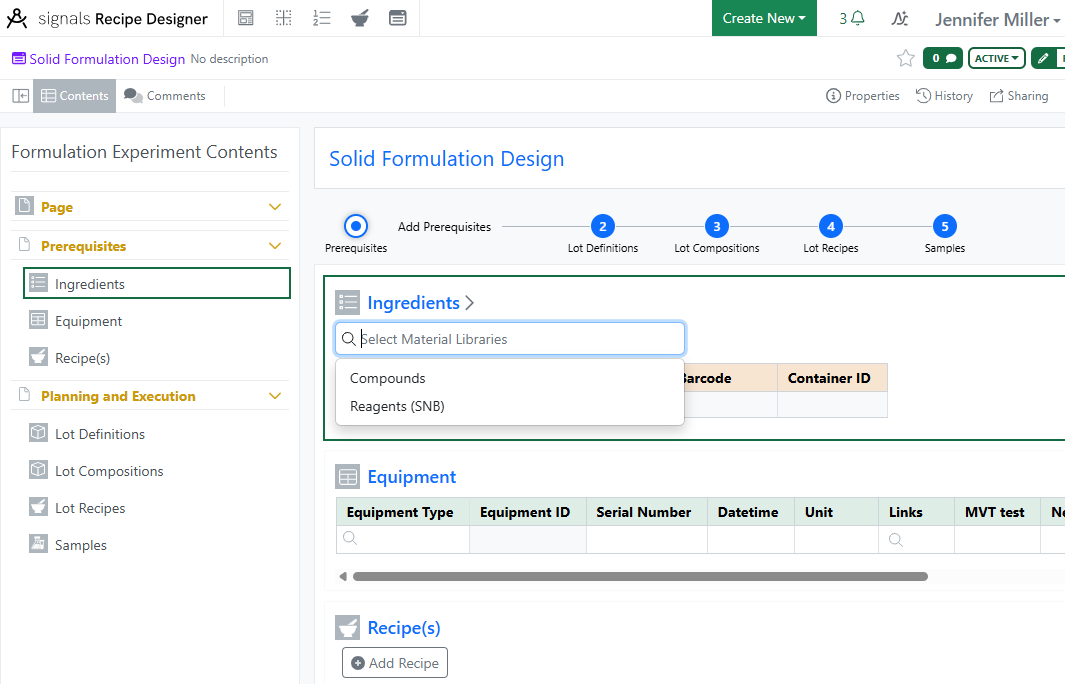
Select the Material Libraries that will be needed:

Image 83 from What's New 26.8.docx

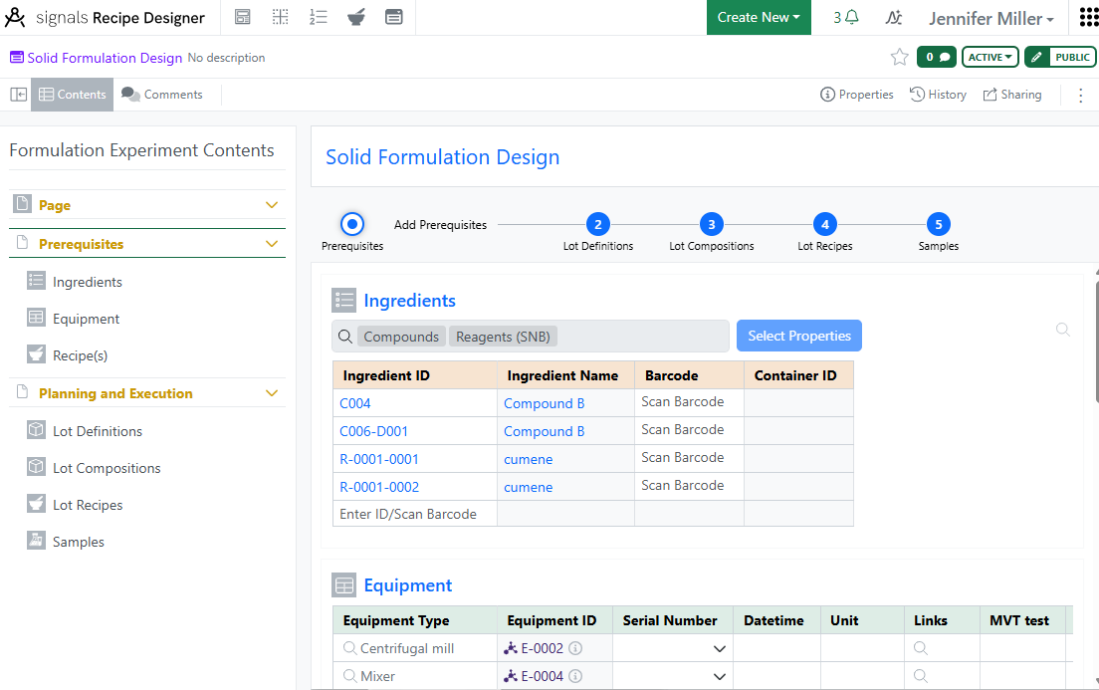
Select Properties and Ingredients can be adjusted in the Ingredients Table in the Formulation Experiment Design or in the Formulation Experiment. Equipment types can be filled in. Recipes, Steps and Parameters can be added and adjusted on the Formulation Experiment Design. Once ready, share the Formulation Experiment Design with the correct Users or User Groups to be used in Signals Notebook. Formulation Experiment Designs can be deleted if not used or retired in the top right corner.

Image 84 from What's New 26.8.docx

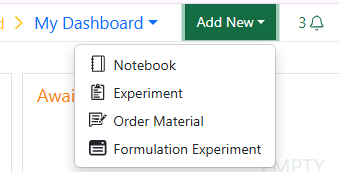
Users in the role with permission to create Formulation Experiments will see the option under the Add New menu:

Image 85 from What's New 26.8.docx

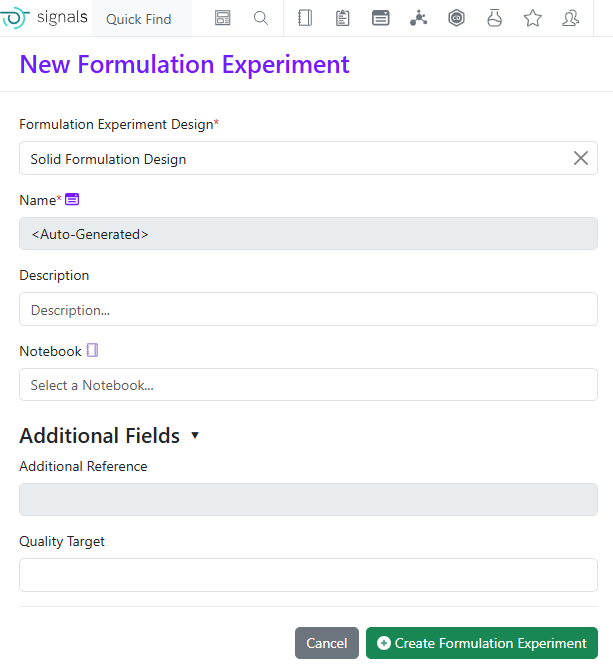
Select a Formulation Experiment Design to start a new Formulation Experiment:

Image 86 from What's New 26.8.docx

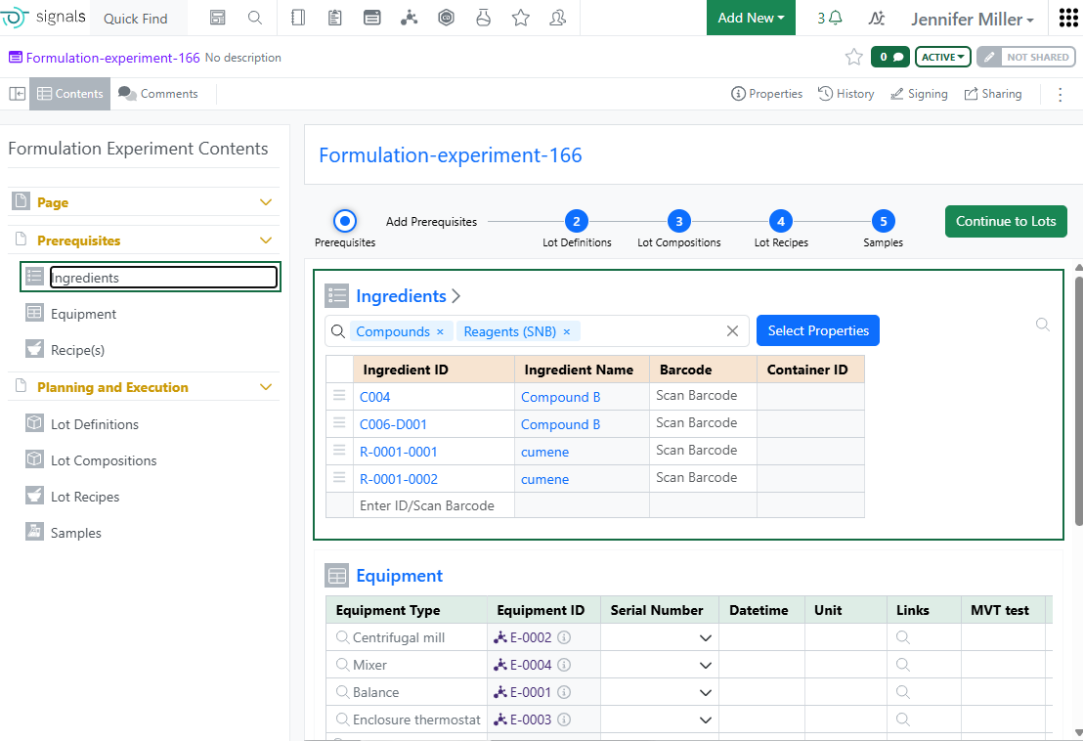
Make updates to the Ingredients, Equipment, Recipes, Steps and Parameters as needed:

Image 87 from What's New 26.8.docx

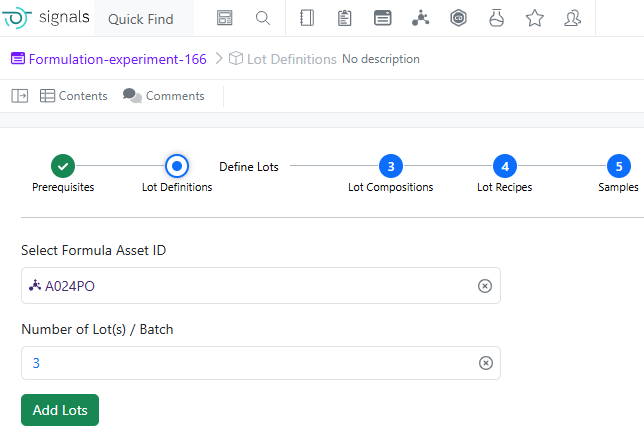
When done making changes, click the Continue to Lots button. Select an asset from the Formula Library and enter the number of batches/lots to create for this experiment:

Image 88 from What's New 26.8.docx

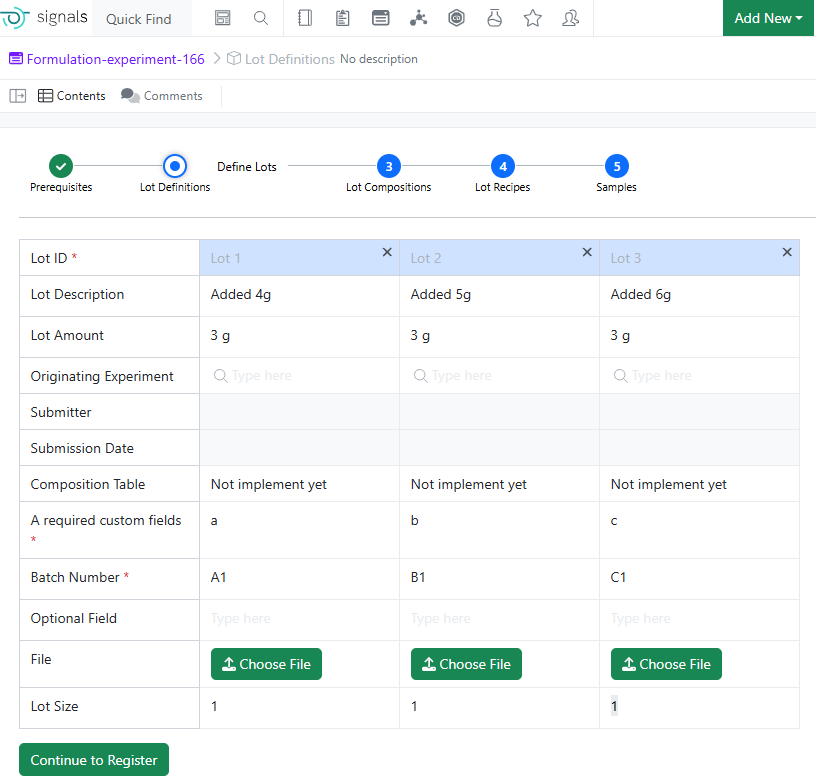
Enter required data on the Lot Definitions before moving to the Lot Composition:

Image 89 from What's New 26.8.docx

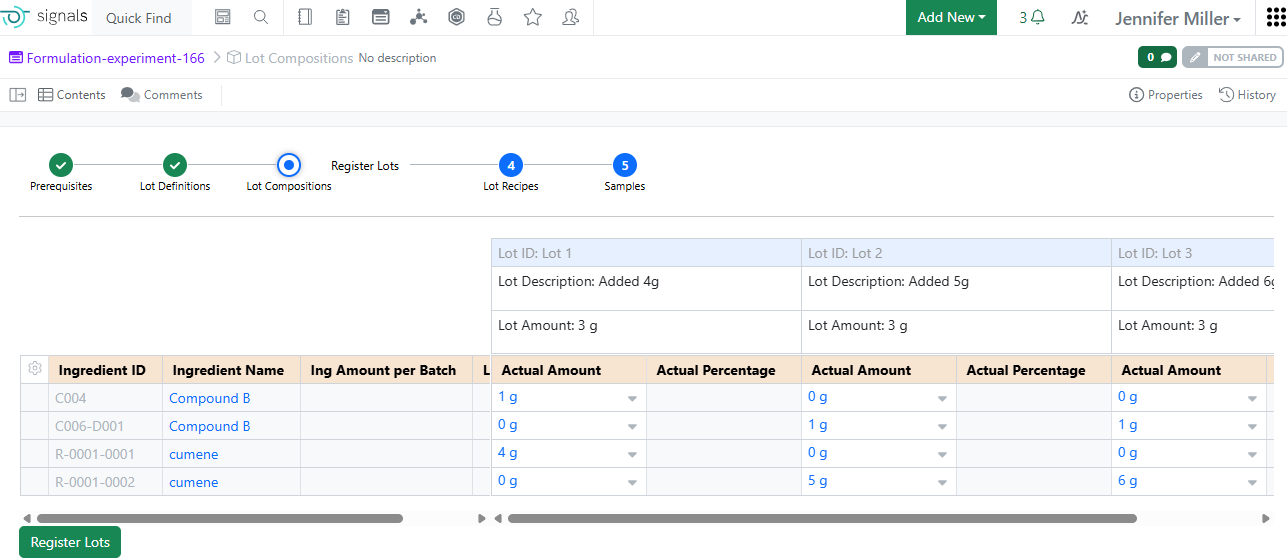
Fill in the Lot Composition to Register the lots directly from the Formulation Experiment:

Image 90 from What's New 26.8.docx

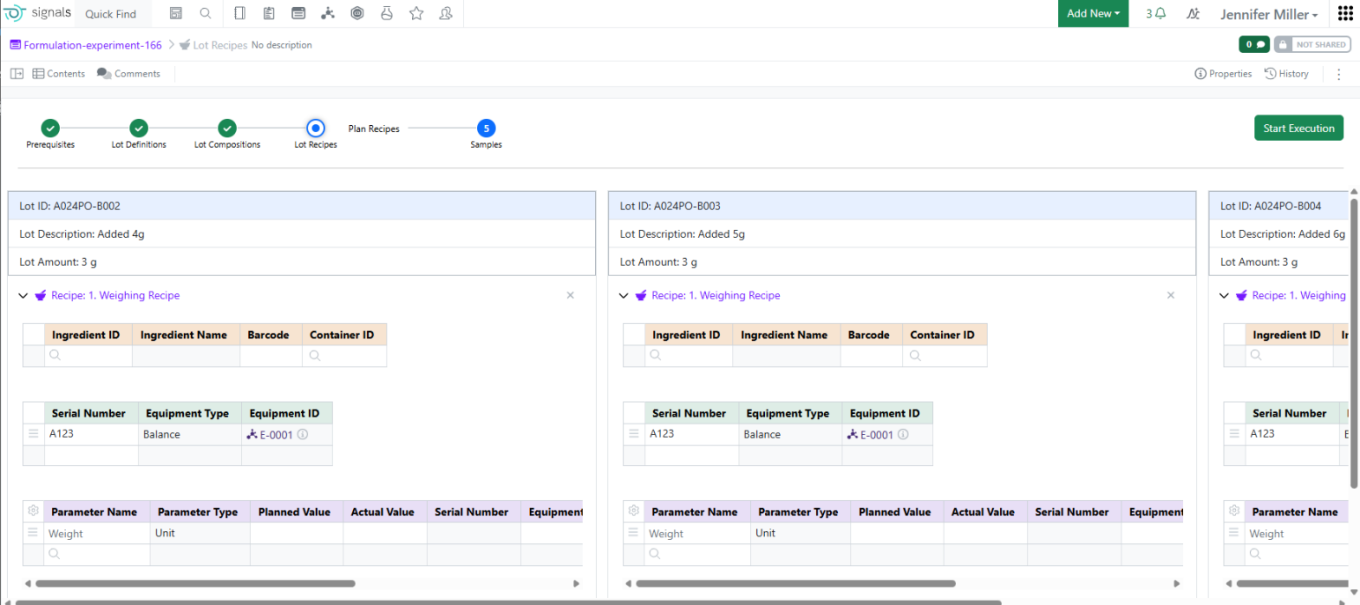
Once the lots have been registered, users will see the Lot IDs have been replaced with real Material IDs and the Lot Recipes will be repeated on a per lot basis:

Image 91 from What's New 26.8.docx

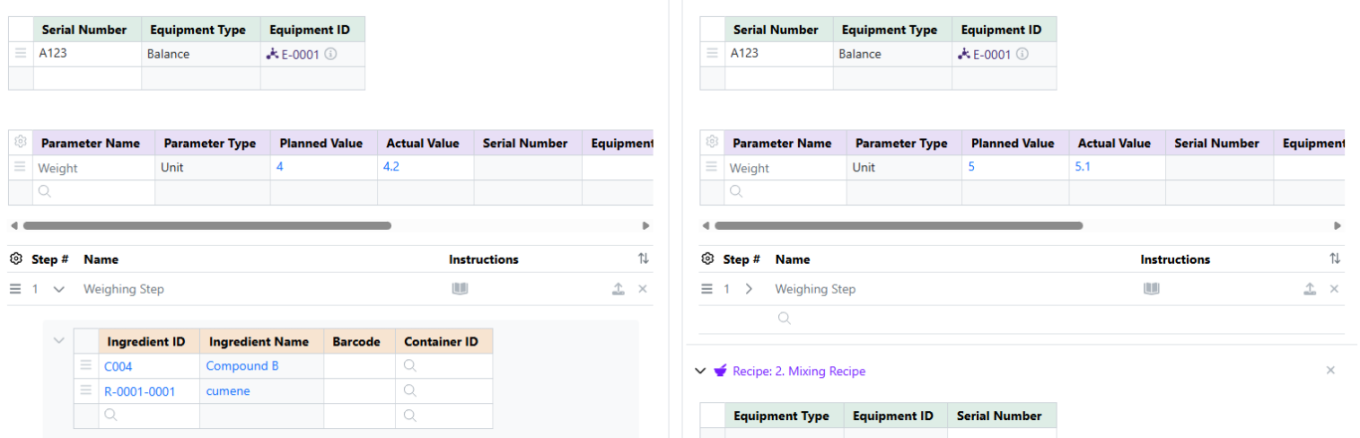
Users can make changes on a per lot basis to the Recipe, Steps or Parameters. Once changes are completed, users can click the Start Execution button to capture the experiment data as they run the experiment: